Why price rises to demand - and why the Sharemaestro Demand Threshold Line matters
Markets run on the oldest law in economics: supply and demand. Prices do not rise because of headlines alone - they rise when demand consistently outweighs supply. They fall when supply takes back control. The mystery for most investors is timing: when does demand run out, and how do you see it coming before the crowd?
Price rises to demand - it gravitates toward the ceiling until demand is exhausted. Respect that ceiling, and you respect risk.
Supply vs Demand
When buyers overwhelm sellers, price climbs. When sellers overwhelm buyers, price declines. The imbalance is the engine.
The Ceiling Concept
Demand has limits. As price approaches the ceiling, each incremental bid does less work. Momentum looks strong - until it isn’t.
Why It’s Missed
Headlines lag conditions. The narrative is still bullish as demand thins. By the time the story flips, the turn is underway.
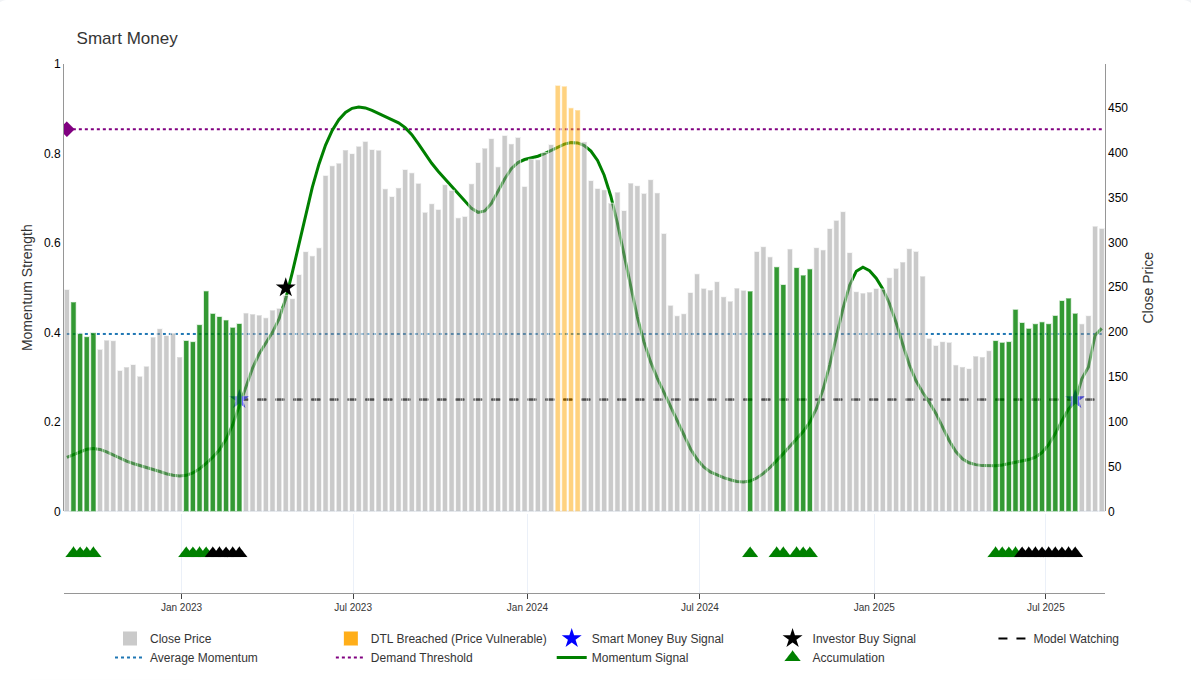
The Sharemaestro Demand Threshold Line
The Sharemaestro Demand Threshold Line is a proprietary lens on where demand is likely to stall. Think of it as an invisible ceiling rendered visible - a boundary beyond which rallies tend to fatigue and the probability of a turn rises. It is not about theatrics. It is about clarity: when demand looks spent, risk expands.
Ignoring the Demand Threshold is like ignoring gravity. You can ride higher for a while - but the reversion risk grows with every step.
Static Use - A Warning Zone
In its static form, the Demand Threshold Line acts as a predefined warning zone. As price advances toward it, the message is simple: the rally is entering a region where demand historically thins. This is not a call to sell on sight. It is a call to prepare - tighten risk, watch behavior closely, and respect the possibility that the next stage is a decline.
Practical takeaway: treat the zone as cautionary. Strong moves can continue, but the risk-reward balance is no longer the same.
Expect diminishing upside efficiency near the zone
Anticipate tighter stops and faster reversals
Prioritise evidence over headlines
Static threshold - a predefined caution area as price rises to demand.
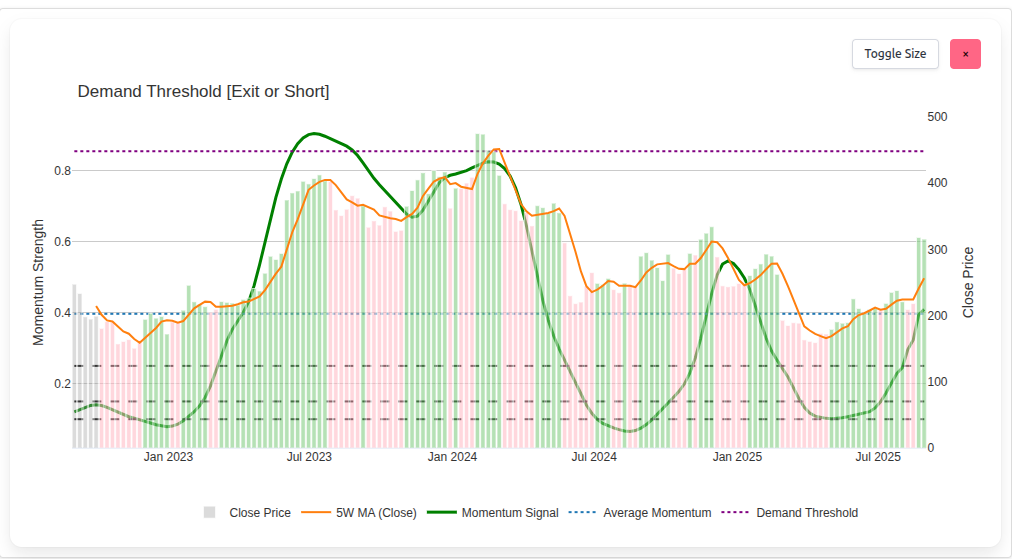
Scaled Use - Pinpointing The Top Region
In its most refined use, the Demand Threshold Line can be scaled - adapting to market conditions to identify the region where demand is not just weakening but exhausted. This is where the ceiling stops being theoretical and becomes real. Distribution replaces accumulation, volume changes character, and strength loses persistence. Often, this is where tops form - or very close to it.
Practical takeaway: scaled thresholds help focus attention on the exact area where odds shift from extension to exhaustion.
Look for failure to make meaningful progress on higher effort
Respect early distribution footprints
Prioritise capital preservation at exhaustion
Scaled threshold - focusing attention on exhaustion zones near tops.
Why The Threshold Matters
The Demand Threshold is a discipline. It acknowledges that demand is finite and that price will eventually rise to meet it. By mapping where demand likely fades, it helps investors avoid buying strength that is running on fumes and holding positions through the transition from markup to distribution.
Respecting The Line
Identifies when trend fuel is thinning
Frames risk before the crowd reacts
Encourages proactive, not reactive, decisions
Supports disciplined exits and trims near exhaustion
Ignoring The Line
Chasing strength into exhaustion
Late exits as narratives flip
Higher drawdowns and whipsaws
Compounding underperformance over cycles
Price Rises To Demand - Then The Stage Changes
Rallies mature when price climbs into the ceiling. At first, demand absorbs supply easily. Later, each new high demands more effort for less progress. The tape looks strong right up to the point where it isn’t. The Demand Threshold Line frames this transition - from easy markup to hard-fought inches, and then to distribution. That is where campaigns end and the next chapter begins.
Conclusion - The Ceiling You Cannot Ignore
Markets will always be shaped by supply and demand. The Sharemaestro Demand Threshold Line is built to respect that truth - highlighting where demand likely runs out, warning when stops are close, and, when scaled, helping to pinpoint the top region or thereabouts. It is not a promise of certainty. It is a framework for clarity.
Ignore the line, and you gamble against gravity. Respect it, and you trade with the market’s heartbeat - not its headlines.