Sharemaestro
Market Dynamics
Weekly charts, proprietary indicators, signals, and market structure tools designed to help investors and traders develop an edge over the market.
Research tools
Market activity
What has changed recently?
Top Stocks
Six useful stock shortlists
Quick ways into the market when you do not want to start from a blank page.
Open Top StocksExplore
Choose your next view
Different market maps for different questions: crypto, commodities, indexes, sectors, signals, and attention.
CSI ScreenerCrypto market hub
Daily crypto charts, pricing, breadth, and one market index for the whole space.
Use it to see whether crypto strength is broad or only sitting in a few coins. CommoditiesCommodity market hub
Daily commodity charts, group moves, intraday action, and a broad commodity index.
Use it when you want to check inflation-sensitive markets like energy, metals, and agriculture. IndexesMajor market indexes
Index charts, intraday buckets, market status, risers, fallers, and breadth.
Use it for the quick read on what the wider market is doing today. Global structureGlobal sector map
Weekly country, sector, and industry indexes built from supported equity markets.
Use it to spot where money is moving around the world. StructureCountry and sector map
Country-level sector and industry charts built from adjusted weekly prices.
Use it to compare a stock with the market group it belongs to. SignalsFresh signal turns
Find stocks where Trend Signal, Market Dynamics, Market Activity, Price Cycle, Fair Value, SMI, or ROC just changed.
Use it when you want setups that have only recently started to trigger. OptionsOptions radar
Options pressure, expected move, volume surges, and trend-confirmation signals.
Use it to see where options traders are paying up for a move. Pattern LabPattern Intelligence
Quant-style pattern reads showing which stocks resemble past winners or losers.
Use it to find the strongest positive and negative analogue setups before opening the chart detail. Short InterestShort interest intelligence
Squeeze pressure, bearish conviction, covering rallies, crowding, and price-positioning divergence.
Use it to spot where short positioning may be trapped, confirmed, or quietly unwinding. Factor IntelCash Generators
Find companies turning profit into real cash, with balance-sheet and value-trap checks.
Use it to shortlist strong cash-producing businesses before opening the detail page. PopularMost watched charts
The chart pages visitors are opening most, with weekly return and rank movement.
Use it as a curiosity check for where attention is gathering.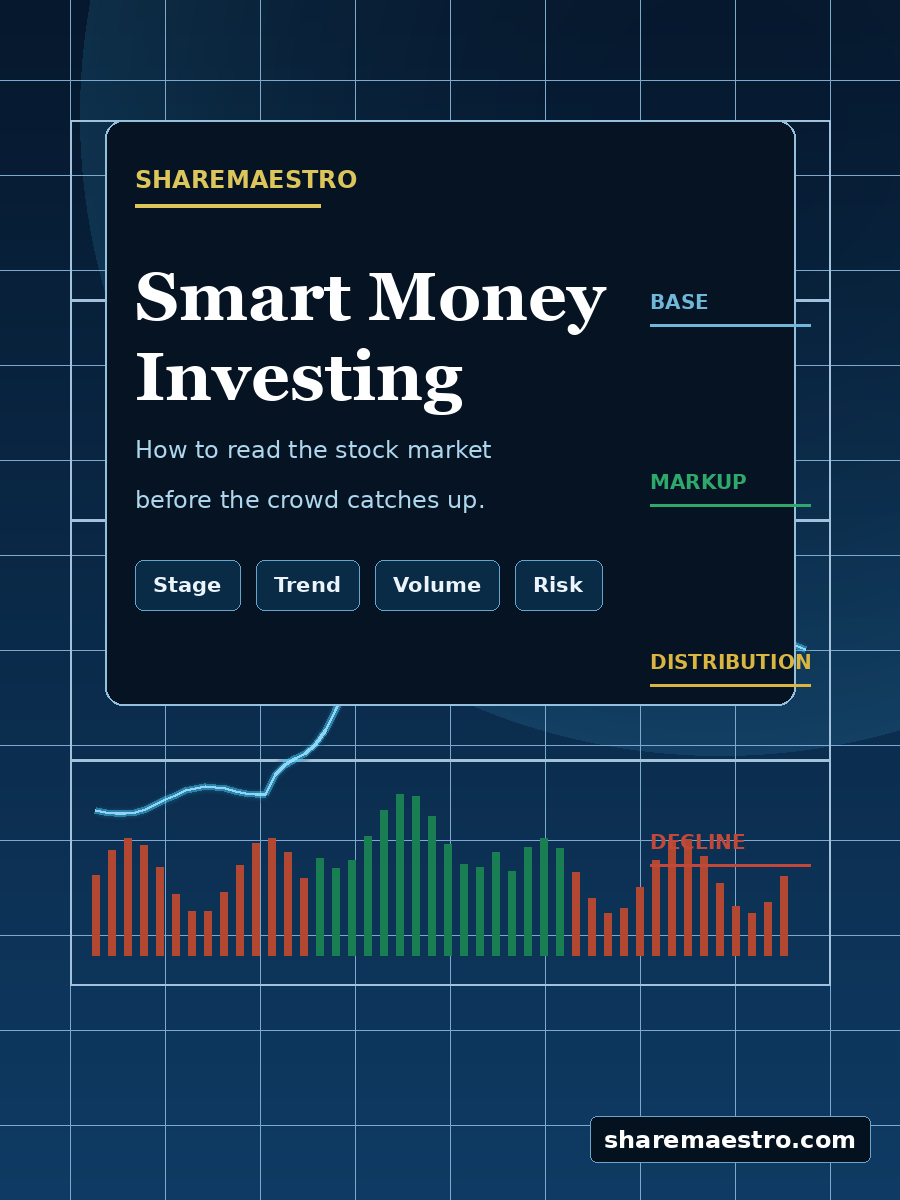
Investor Framework
Smart Money Investing
Learn how to read the stock market like a pro: spot where strength is building, where demand is real, and when risk is starting to rise.
- Identify accumulation, markup, distribution, and decline.
- Use Relative Strength and volume to judge whether demand is real.
- Separate strong advances from late, crowded, or weakening moves.
 Coming soon: Market Dynamics Podcast, weekly financial markets analysis from Sharemaestro, on YouTube at @sm-marketdynamics.
Factor Intelligence
Find stocks by what matters
Pick the kind of stock you want to study: cheap, high quality, moving well, income-led, or a blend.
Open FactorsStocks that score well across price, business strength, and share-price trend.
A starting list when you want fewer obvious weak spots. Cheap, with momentumLow-priced stocks where the share price has already started to move in the right direction.
Useful when you want value ideas that are not just sitting still. Deep valueVery cheap-looking companies with enough financial strength to deserve a second look.
For bargain hunters who still want some quality control. Cheapest value basketThe stocks that look cheapest across several value measures, not just one ratio.
A broad hunting ground for unloved companies. Good businesses at fair pricesCompanies that look reasonably priced without giving up too much business quality.
A calmer value screen that tries to avoid obvious traps. Large dividend valueBigger, established companies ranked by dividend yield.
For investors looking for income from sturdier market leaders. Steady growth at a sensible priceCompanies with consistent earnings growth, reasonable sales multiples, and strong momentum.
A growth screen that still cares what you pay. Growth at a fair priceBusinesses growing revenue while avoiding the most expensive price tags.
For investors who want growth, but not at any price. Cash returned to ownersCompanies returning money through dividends, buybacks, or debt reduction.
Shows where management is sending cash back to shareholders. High earnings powerCompanies with strong operating earnings compared with what the market says the business is worth.
A simple way to spot businesses that may be earning more than their price suggests. Classic trending valueCheap stocks with improving price action, using a wider value-plus-momentum filter.
A slightly broader version of cheap-with-momentum. Quality compoundersProfitable businesses with strong returns, decent margins, and manageable debt.
For long-term investors looking for businesses that can keep compounding. Cheap but financially improvingValue stocks with stronger Piotroski scores, which look for improving financial health.
Helps separate healthier bargains from cheap stocks with bigger problems. Self-funded valueCheap companies that are funding themselves and returning cash without leaning too hard on outside capital.
Looks for value ideas with better capital discipline. Hidden valueStocks that may look expensive on one measure but cheap on cash flow, earnings, or owner returns.
For cases where the usual headline ratio may be misleading. Consistent earnersCompanies with a longer record of steady earnings growth.
A screen for businesses with a more reliable earnings pattern. Strong trendsStocks with powerful price momentum while keeping volatility in check.
For finding shares where buyers are already showing up. Risk-Adjusted MomentumHighest 12-1 momentum per unit of volatility
Market LeadersO'Shaughnessy Market Leaders ranked by OS composite
Market leaders with owner yieldEstablished companies that also return cash to shareholders.
A more mature-company version of shareholder yield. Small-company valueSmaller companies that look cheap and have enough financial strength to screen well.
For investors comfortable looking beyond the biggest names. Tiny TitansVery small companies with low price-to-sales ratios and positive momentum.
A higher-risk small-stock screen for early strength. Lower-drama trendsStocks with positive momentum and lower volatility.
For investors who want trend exposure with less price turbulence. Improving scoresStocks whose overall factor score has recently improved.
Highlights names where the evidence is getting better. Cheapest in their sectorStocks that look cheap compared with companies in the same part of the market.
Useful when you want value ideas without comparing banks to software firms. High incomeStocks with higher dividend yields backed by free cash flow.
For income ideas where the cash flow support matters.SVQF
Value quality screens
Strong value and quality factor rankings, plus Sharemaestro Composite screens across completed exchange universes.
Open SVQFPatient Capital
Market Dynamics buy signals
A unique value-based screener built around the Buy signals generated on the Market Dynamics chart.
Open Patient CapitalElliott Wave Cycles
Structure and cycle timing
A timing view for shares where wave structure, cycle pressure, Hurst rhythm, Fair Value, activity, and momentum may be lining up.
Open Cycle ScreenerSentiment Analysis
Market sentiment intelligence
Equity news tone ranked across tickers, countries, sectors, and industries with focused source and relevance scoring.
Open SentimentMarket Intelligence
Market event pages
Useful pages for recent movers, insider transactions, earnings dates, and options pressure.
Trending Stocks
Stocks and ETFs whose weekly trend has recently strengthened.
Warming up 64.2% top move US weekly tapeActive Movers
Big gainers, sharp losers, and unusually active names from the stored mover set.
Updated 25 Jul 07:29 ACR top recent flow Corporate transaction tapeInsider Activity
Recent director and executive buying or selling, grouped into useful company views.
Updated 31 Jul 12:11 144 today Upcoming reportsEarnings Calendar
Upcoming company reports, dates, and context for names about to update the market.
Updated 31 Jul 11:15 76 top score OptionsOptions Radar
Where options pressure, expected move, and trend confirmation are standing out.
Updated 31 Jul 21:00Strategy Blog
Market Legends
Deep-dive reporting on investors, traders, fund managers, and market pioneers.
Open Blog
John Maynard Keynes Learned the Limits of Macro, Then Made the Endowment Case for Concentrated Equities
The economist who changed macroeconomics also changed institutional investing by turning King's College, Cambridge toward equities, concentration, value, and the uncomfortable discipline of being early.

Robert Shiller Made Markets Explain Their Moods, Then Turned Bubble Warnings Into a Discipline
The Nobel-winning Yale economist changed how investors think about valuation, housing prices and speculative manias by insisting that markets are driven by data, institutions and contagious stories.

Mary Meeker Made the Internet Investable, Then Turned the Slide Deck Into a Growth-Capital Discipline
Mary Meeker’s career traces the migration of technology investing from Wall Street research to Silicon Valley growth capital, with a method built on data density, product intuition, and a persistent willingness to back digital adoption before it looks obvious.
Market Legends
Words of Wisdom
Top Stocks basics
What are these shortlists?
These are ready-made lists that pull the market into smaller groups. Instead of scrolling through thousands of tickers, you can start with stocks showing a specific kind of evidence: strong trends, improving signals, positive sentiment, unusual options pressure, or broad factor strength.
Each card opens a Top 20 list. The lists are not recommendations. They are a practical first filter, designed to help you decide what deserves a closer look.
Explore basics
What is this section for?
This section is the map room. Use it when you know the type of market question you want to ask, but not the exact stock yet.
- Market hubs help you check crypto, commodities, and major indexes at a glance.
- Structure pages show which countries, sectors, and industries are leading or lagging.
- Signals and popular charts help you find fresh changes and names other visitors are paying attention to.
The aim is simple: pick the right section first, then drill into the individual charts.
Factor basics
What are factors?
A factor is just a trait we can measure across lots of stocks. Instead of reading every company from scratch, factors help you ask better first questions: is this cheap, is it a strong business, is the price already improving, or is cash being returned to shareholders?
- Value looks for shares that appear inexpensive compared with earnings, cash flow, assets, or sales.
- Quality looks for businesses with stronger profits, steadier finances, and fewer obvious balance sheet problems.
- Momentum looks for stocks where the market has already started to reward the company.
- Yield looks for companies returning cash through dividends, buybacks, or debt reduction.
Each preset combines a few of those traits into a ready-made shortlist. It is a research starting point, not a buy list. The job is to narrow the market down to names worth looking at properly.