Executive summary
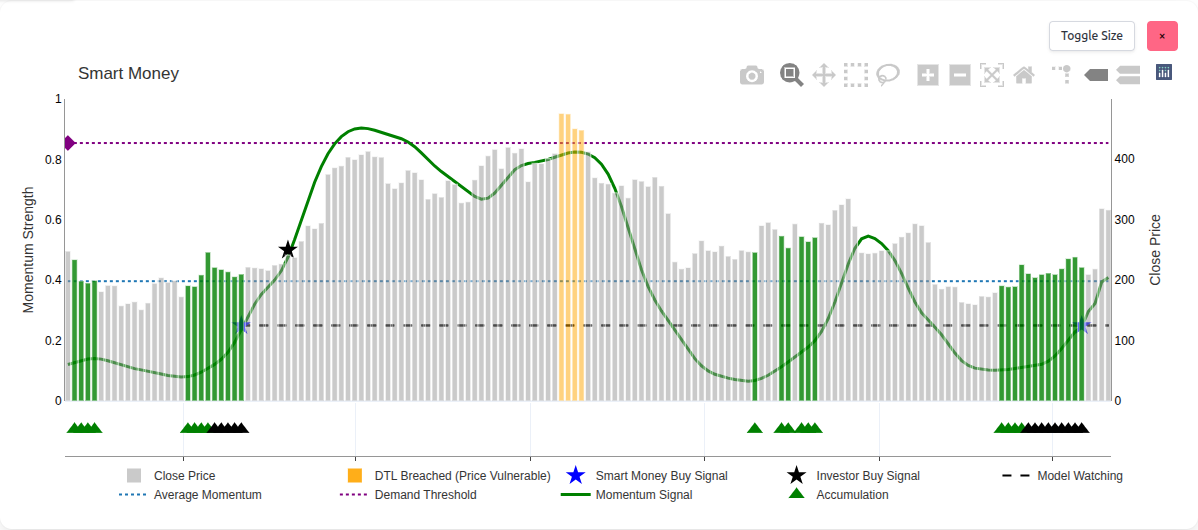
The Smart Money chart summarises how sophisticated participation enters a market through accumulation, how buying campaigns confirm through momentum, and where the natural exit sits at the Demand Threshold Line (DTL). The objective is simple and timeless: buy low, sell high. The method is systematic and market-agnostic.
Accumulation markers reveal early positioning. Smart Money Buy signals recognise statistically meaningful accumulation. Investor Buy signals appear when momentum reaches a qualifying level. The campaign aims to reach or breach the DTL, where price becomes vulnerable and exits are prioritised. Bull or bear, the process remains the same.
Smart Money chart
Accumulation explained
Accumulation is the quiet build-up of positions at value. It is patient and deliberate; it typically happens when sentiment is indifferent or negative. On the chart, green triangles mark the presence of accumulation. When this process intensifies and persists at a level, the markers turn black. That shift signals concentration as well as intent.
Smart money buys low. It favours value, patience, and scale-in execution. Accumulation is the footprint of that behaviour.
Buy signals overview
Smart Money Buy: significance recognised
Smart Money Buy signals are plotted with blue stars. They appear when the accumulation environment is recognised by the model as meaningful. Treat these as early, high-quality confirmations that sophisticated participation is active.
Investor Buy: momentum qualified
Investor Buy signals are plotted with black stars. They trigger later in the campaign when momentum crosses a qualifying level. This marks the shift from groundwork to visible trend.
Demand Threshold Line
The Demand Threshold Line (DTL) is the destination of the campaign. Rendered as a purple dotted line, it represents the level where demand becomes saturated and price is vulnerable. When price bars rise above this line, they are highlighted in orange to indicate vulnerability. In practice, this is the area where exits take priority, whether that means selling long positions or initiating shorts.
The DTL makes the endgame explicit. Accumulation plants the seed, buy signals organise the campaign, and the DTL frames the exit. The framework is market-agnostic and works in both bullish and bearish regimes.
Chart elements
Close price: grounding in reality
Grey bars show closing price. They keep the story anchored to outcomes and make the progression from accumulation to trend visible in the tape.
Momentum signal: trend strength
The green line tracks momentum strength and helps show whether the campaign is gathering energy or losing it.
Average momentum: context
The blue dotted line is a long-horizon reference for momentum. It is context rather than a trigger.
Model Watching: campaign monitoring
The black dashed line indicates campaign monitoring from the first Smart Money Buy and visually tracks progress toward the objective.
The synergy effect
Each component is useful on its own; the advantage emerges when they align. Accumulation establishes intent. Smart Money Buy recognises significance. Investor Buy confirms momentum. Momentum and price reveal execution. The DTL defines the exit.
When these elements converge, noise falls and conviction rises. The chart compresses complexity into a simple journey: build positions at value, allow momentum to carry the campaign, exit at vulnerability. Repeated over time, this sequence compounds results and keeps the process market-neutral.
Putting it into practice
- Watch accumulation: green triangles suggest emergence; black triangles indicate focus.
- Use Smart Money Buy: treat blue stars as recognition of significant accumulation.
- Use Investor Buy: treat black stars as momentum confirmation.
- Track momentum and price: look for alignment and persistence.
- Respect the DTL: orange price bars above the purple line signal exit priority.
Legend
- Close Price: grey bars
- DTL Breached (Price Vulnerable): orange bars when price is above the DTL
- Smart Money Buy Signal: blue star
- Investor Buy Signal: black star
- Model Watching: black dashed line
- Average Momentum: blue dotted line
- Demand Threshold: purple dotted line
- Momentum Signal: green line
- Accumulation: green triangles for standard accumulation, black triangles when intensity increases
Educational content only; not investment advice. Markets involve risk and capital is at risk.