iShares UK Property UCITS ETF
IUKP LSE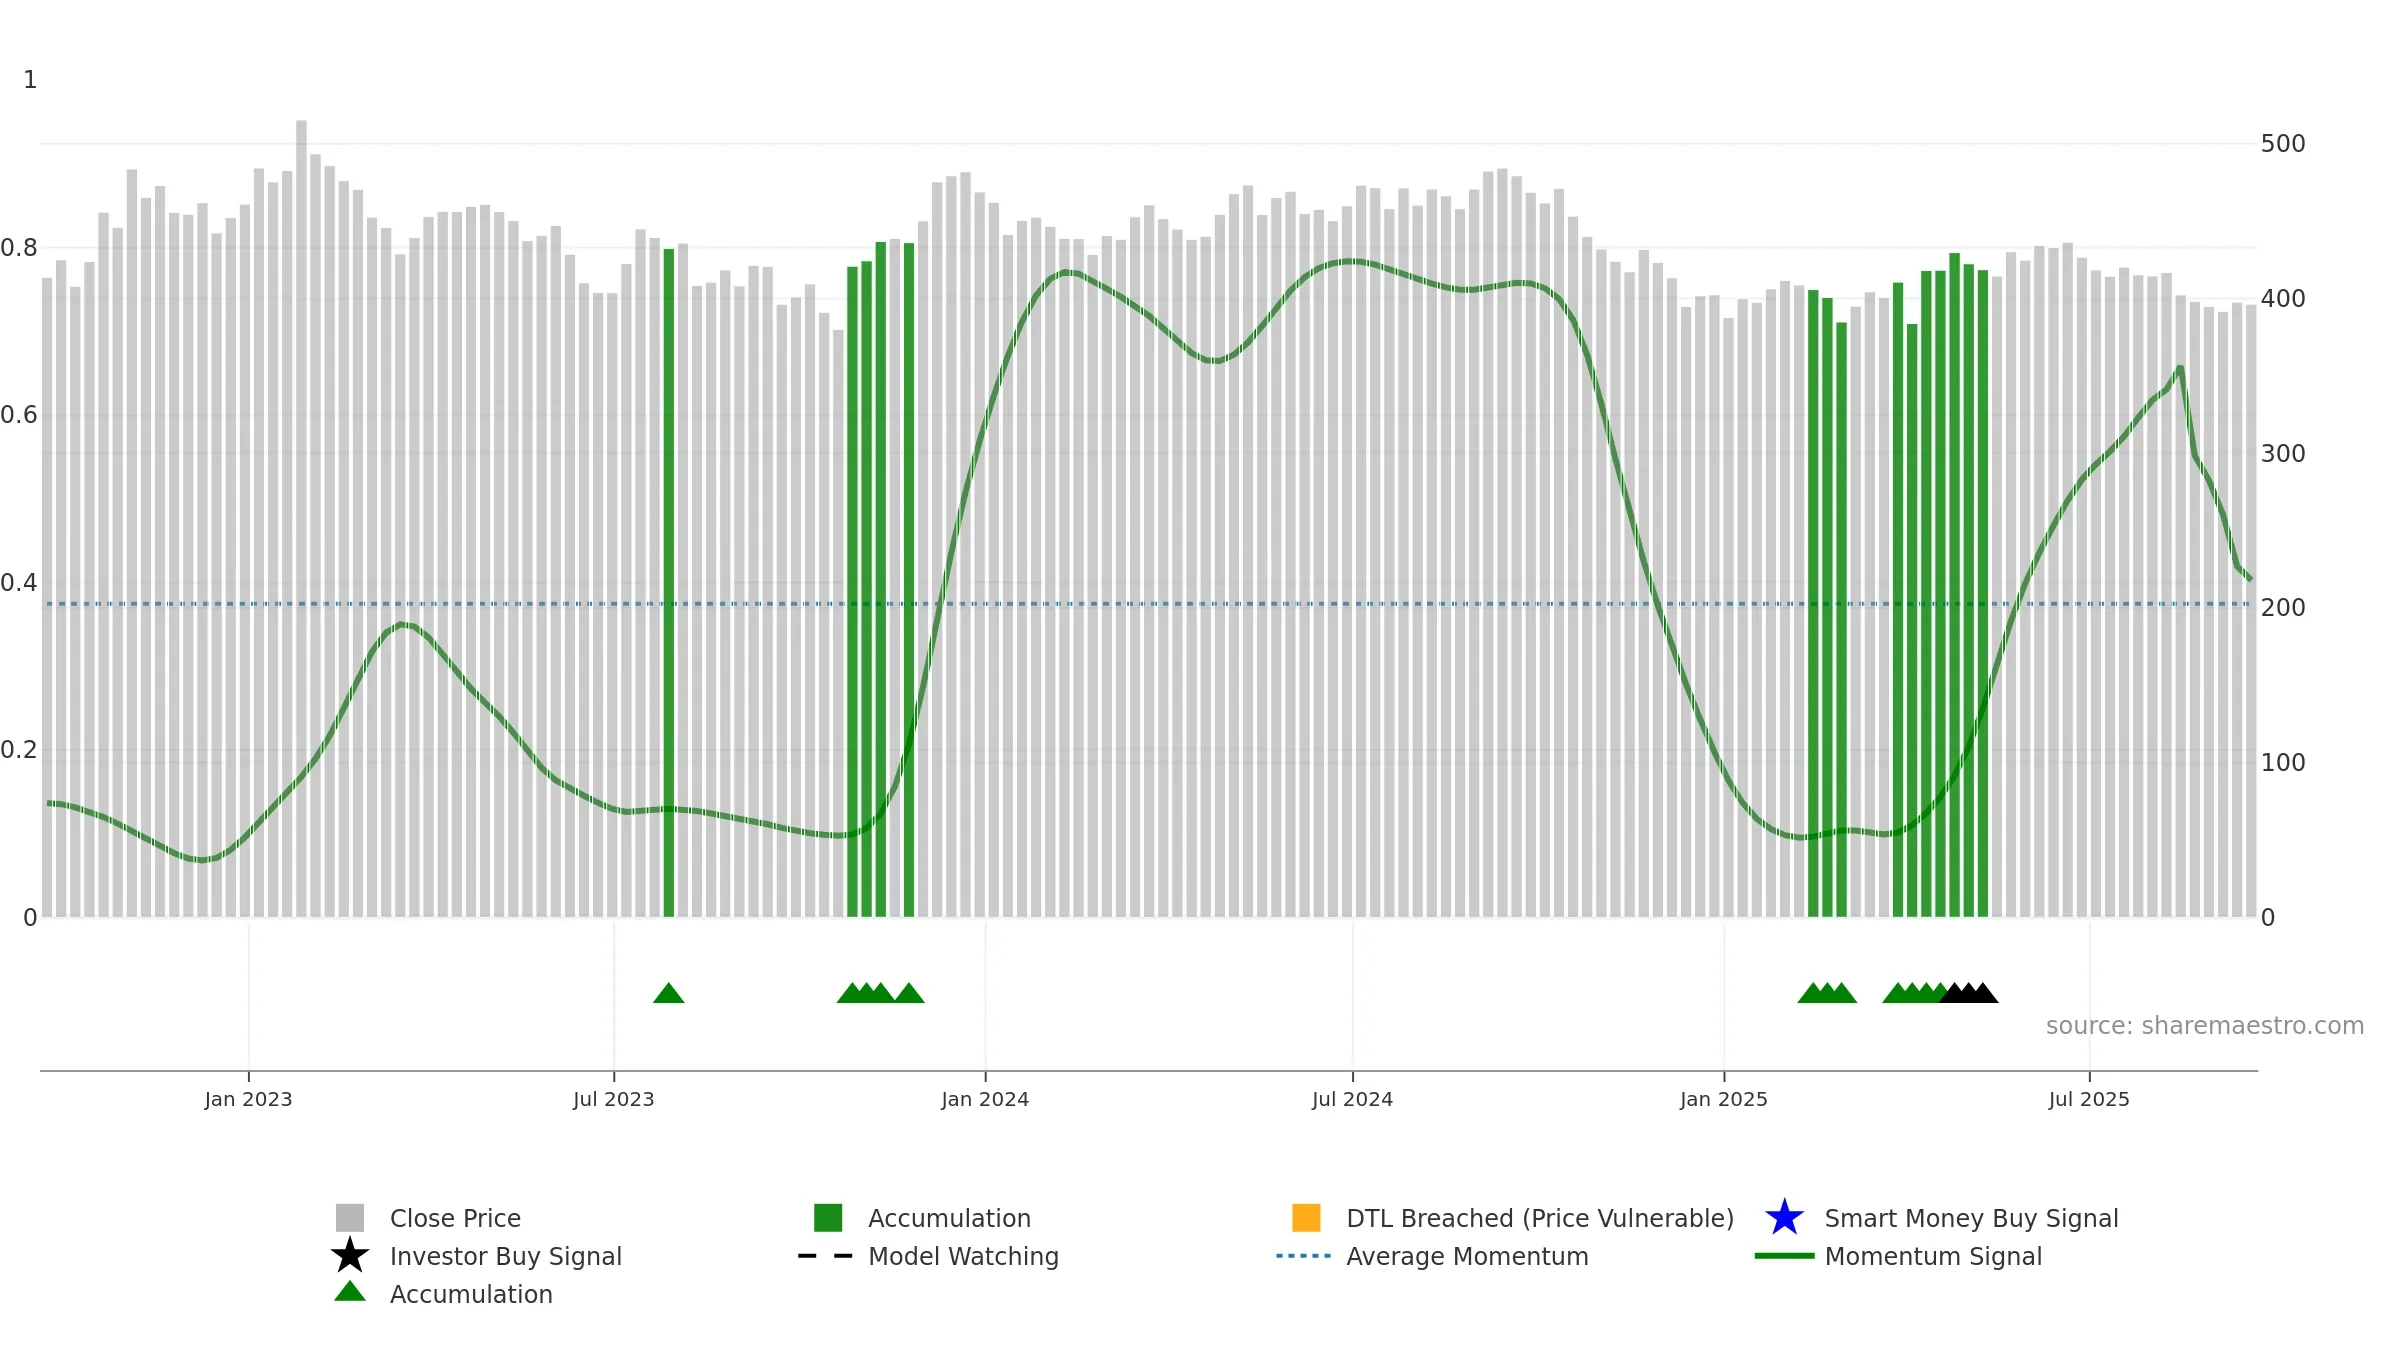
Weekly Report
iShares UK Property UCITS ETF closed at 396.3500 (-0.49% WoW) . Data window ends Fri, 19 Sep 2025.
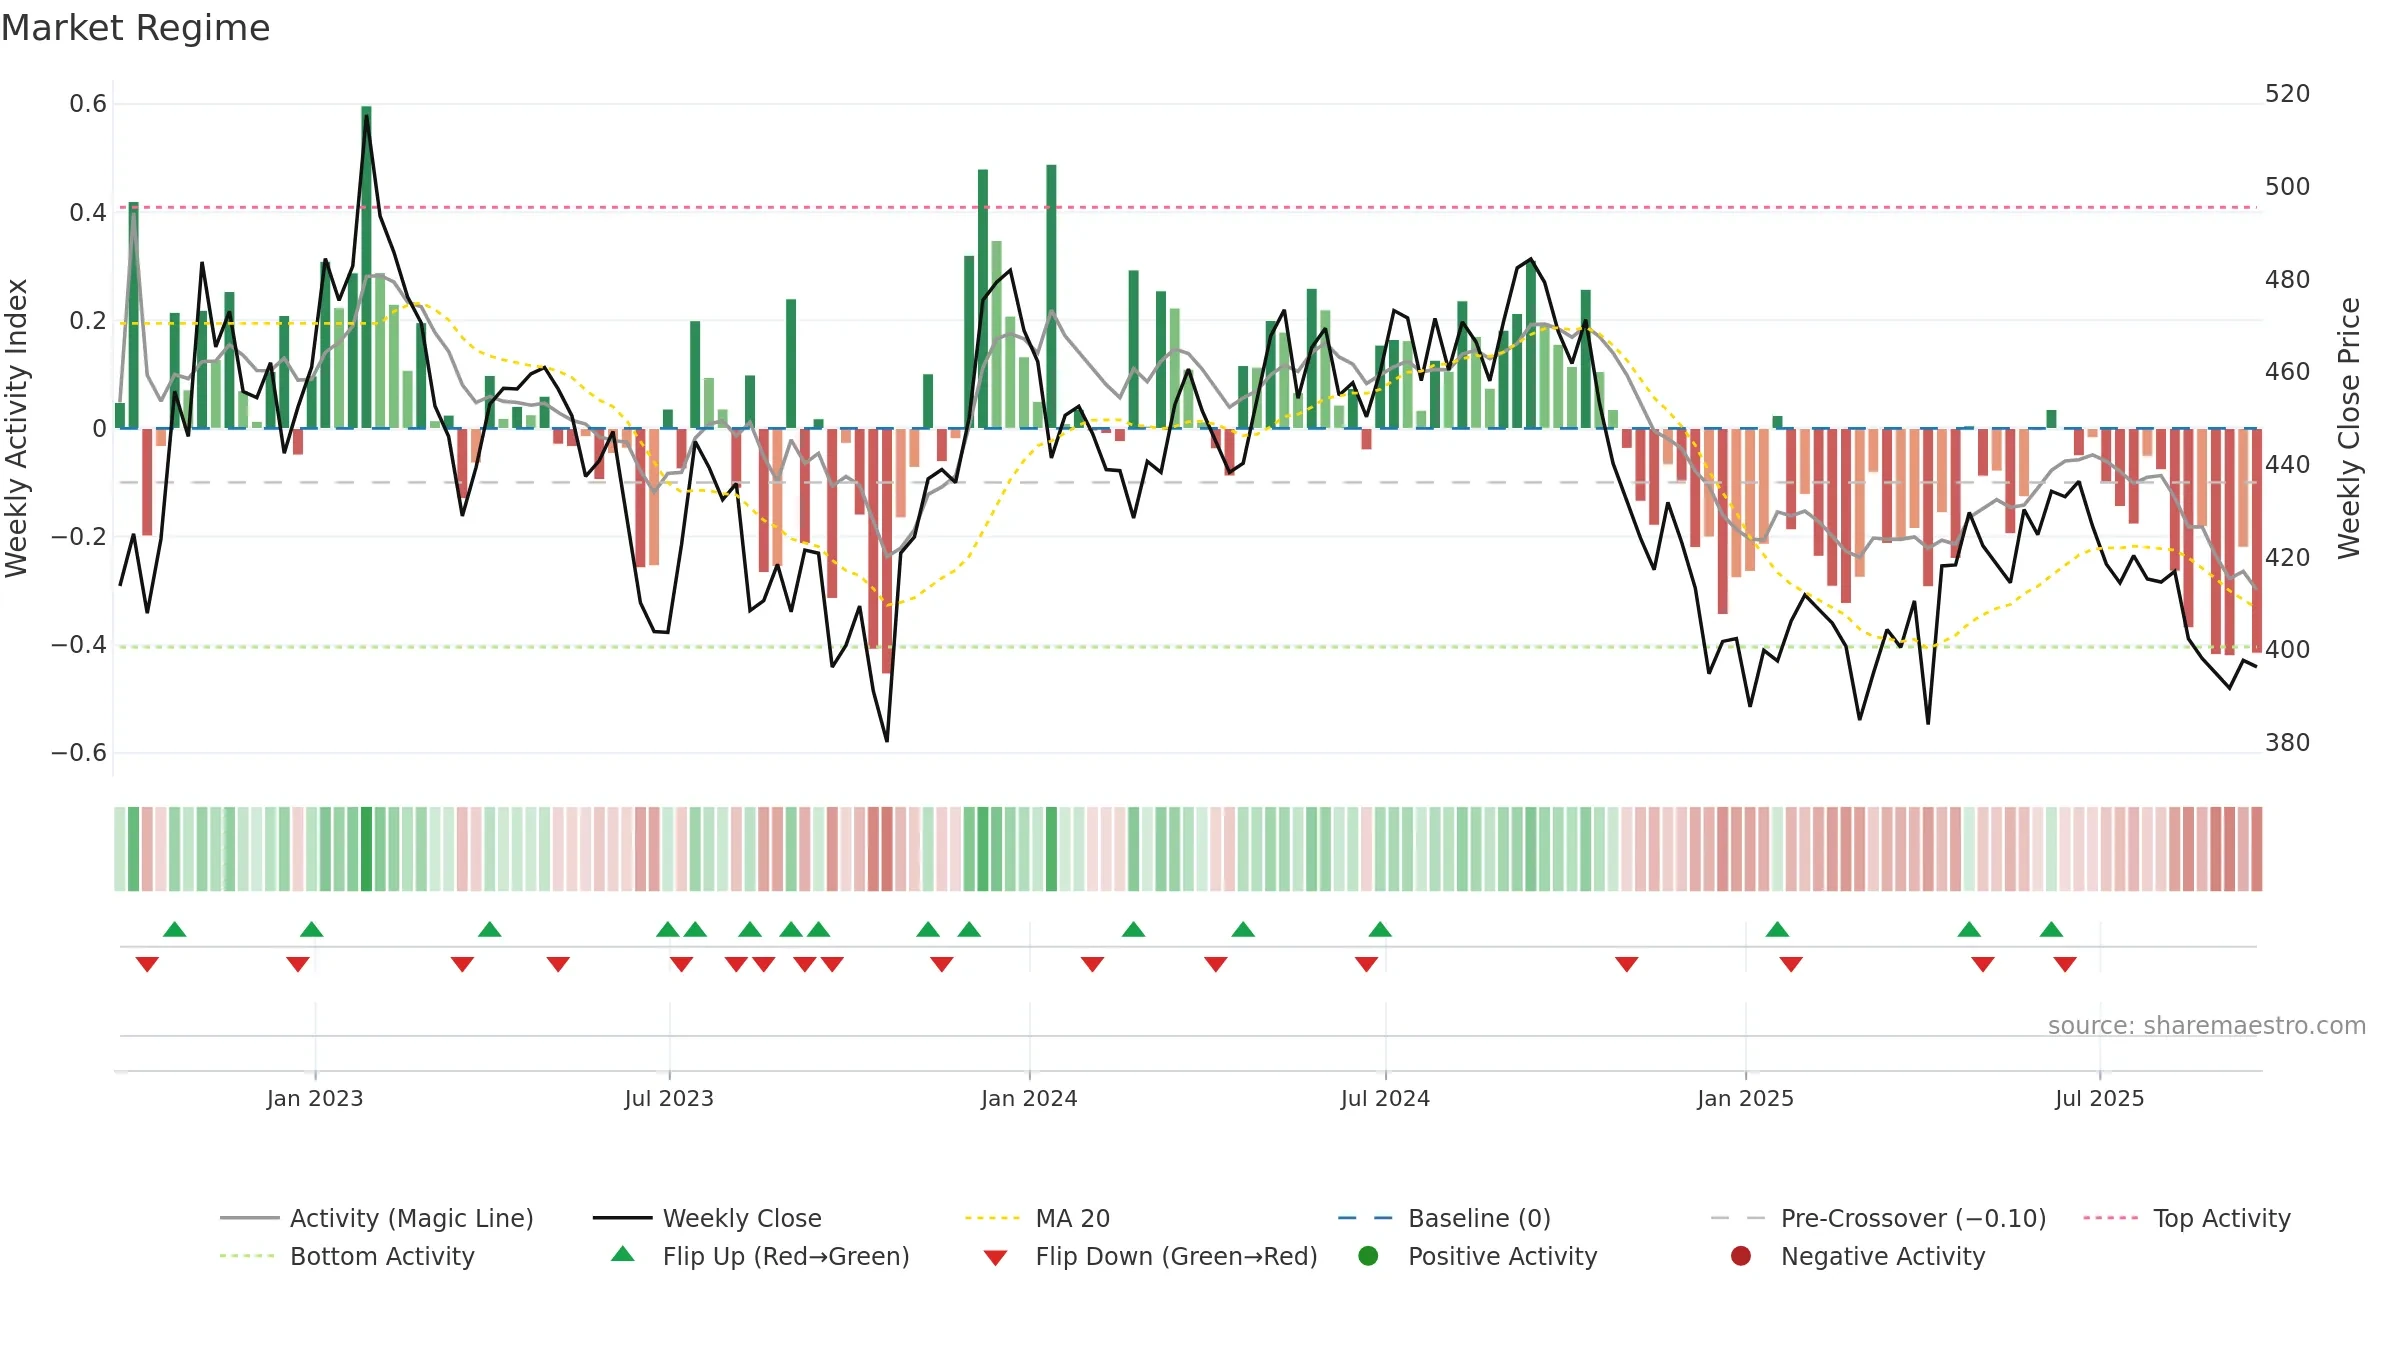
How to read this — Price slope is downward, indicating persistent supply pressure. Low weekly volatility favours steadier follow-through. Volume and price are moving in the same direction — a constructive confirmation. Weak MA stack argues for caution; rallies can fail near the 8–13 week region. Price sits below key averages, keeping pressure on the tape.
Down-slope argues for patience; rallies can fade sooner unless participation improves.
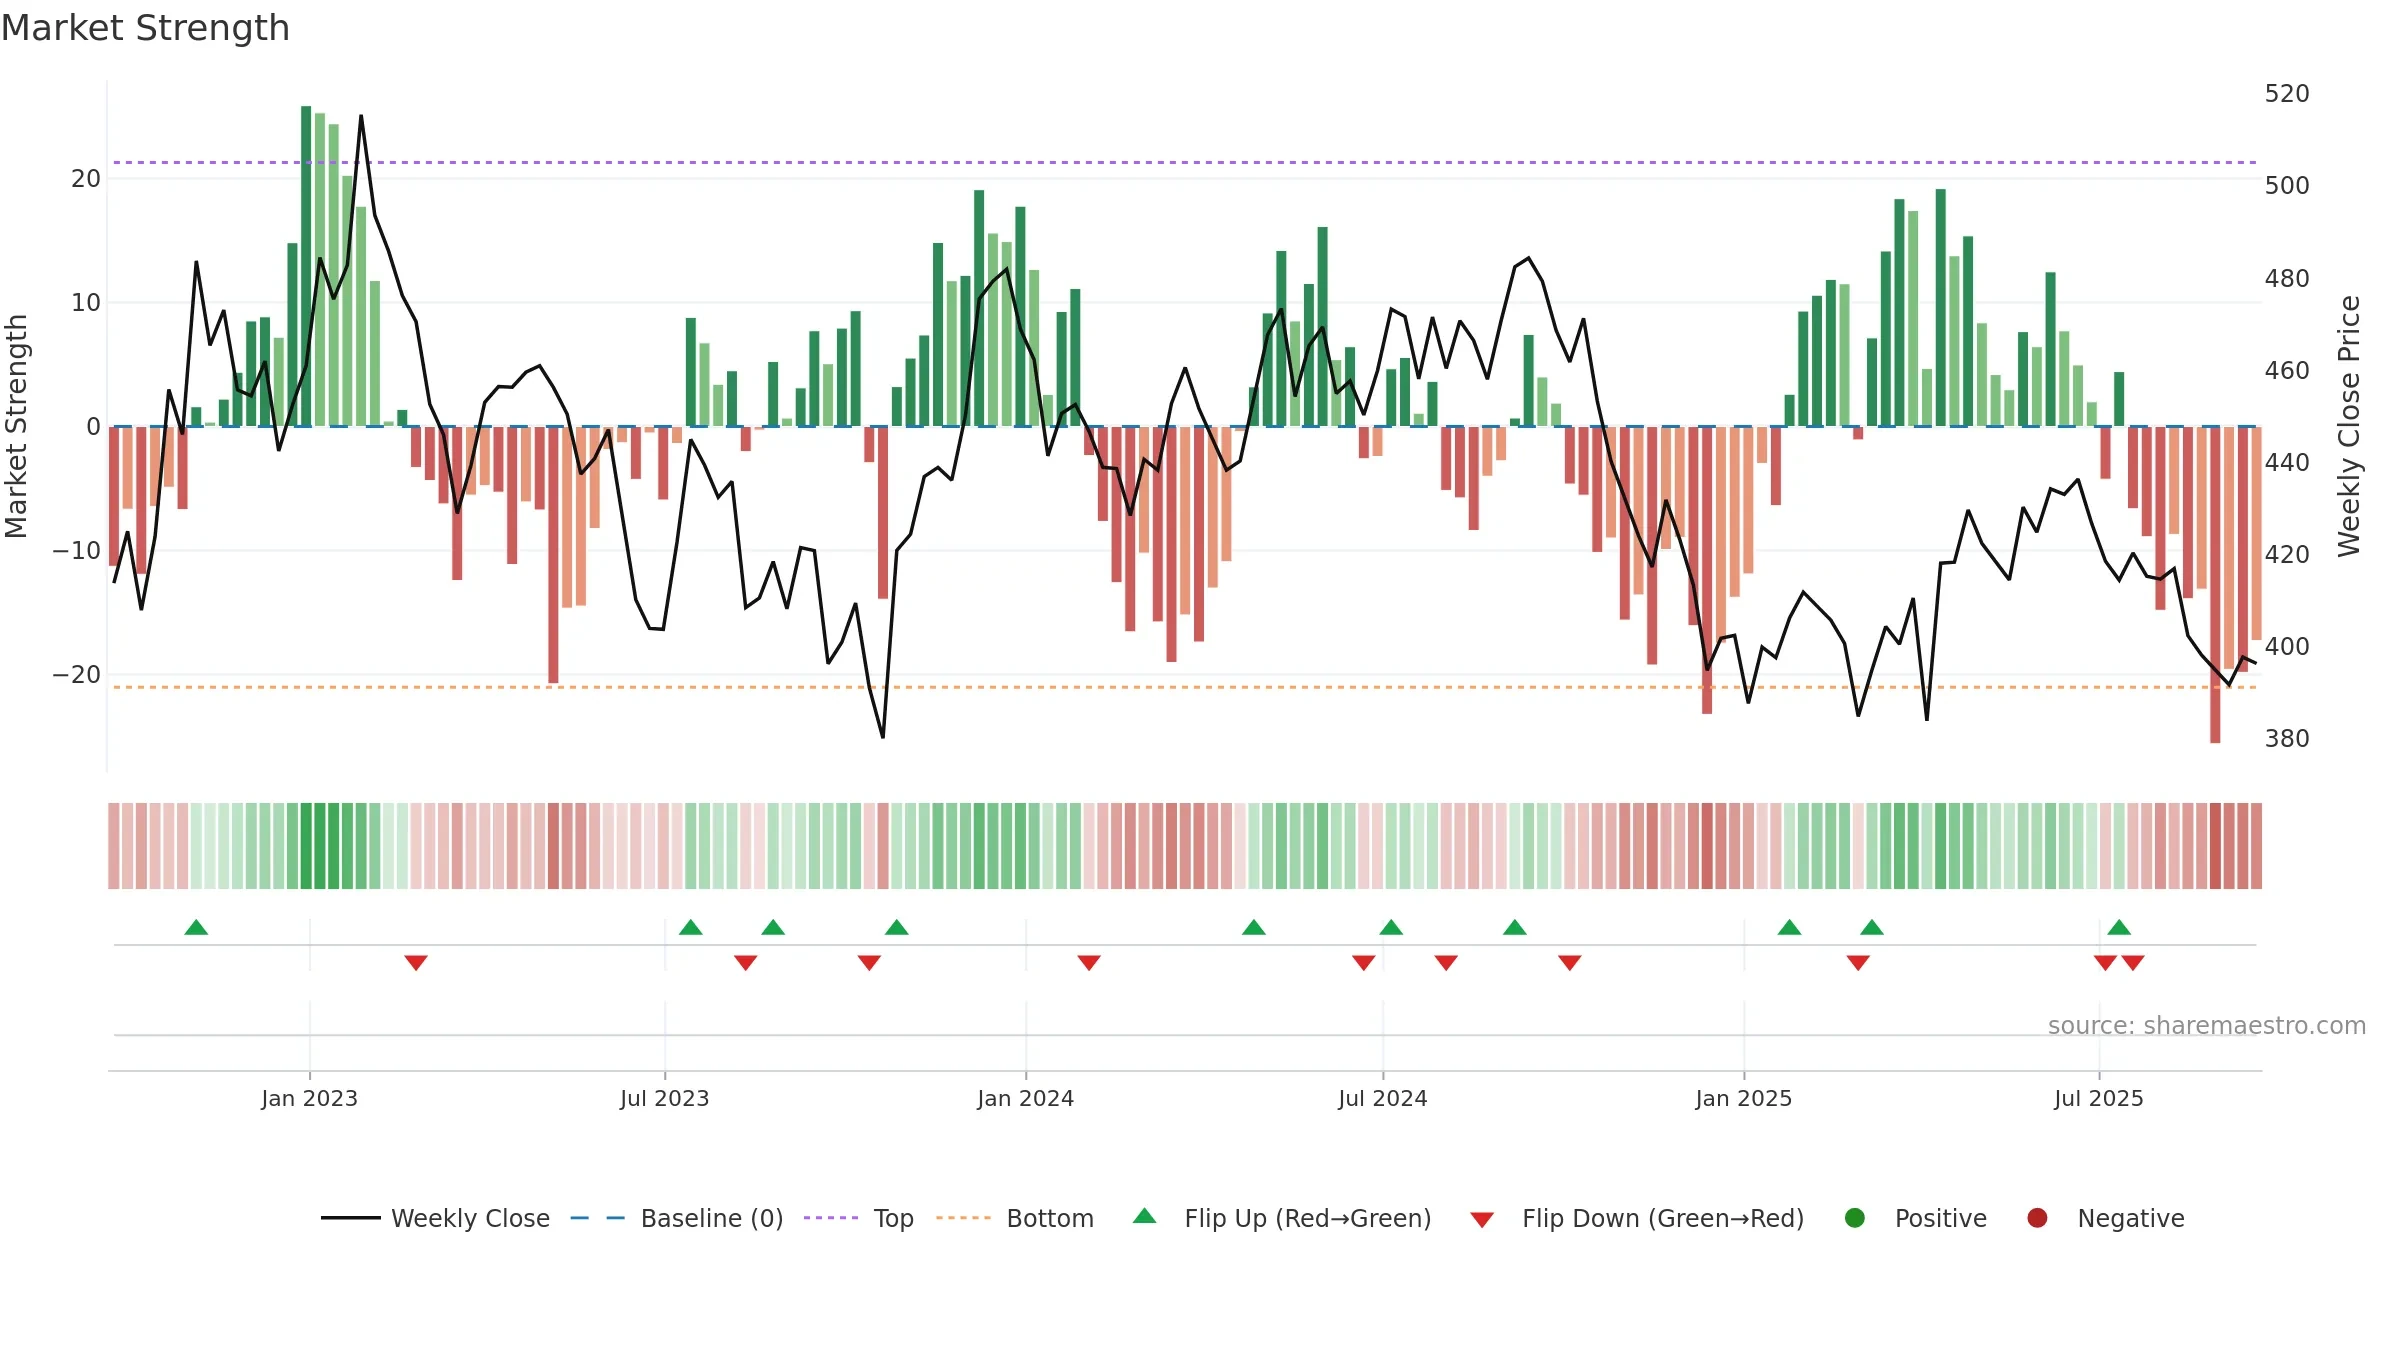
Gauge maps the trend signal to a 0–100 scale.
How to read this — Range-bound conditions; conviction is limited until a break or acceleration emerges. Loss of the ~0.50 midline after strength suggests regime shift.
Wait for a directional break or improving acceleration.
Conclusion
Neutral setup. ★★★☆☆ confidence. Price window: -4. Trend: Range / Neutral; gauge 40. In combination, liquidity confirms the move.
- Liquidity confirms the price trend
- Low return volatility supports durability
- Momentum is weak/falling
- Price is not above key averages
- Weak moving-average stack
- Negative multi-week performance
Why: Price window -4.41% over 8w. Close is -4.94% below the prior-window high. Return volatility 0.81%. Volume trend falling. Liquidity convergence with price. Trend state range / neutral. MA stack weak. Momentum neutral and falling.
Tip: Most metrics include a hover tooltip where they appear in the report.