No results found.

First Trust Cloud Computing ETF

SKYY ETF-US
Week Ending
Fri, 19 Sep 2025
Open
137.1800
Close
137.3700
High
137.6800
Low
136.3200
Trend
0.71956
Sharemaestro [Charts]
SKYY weekly Smart Money chart, closing 2025-09-19.
SKYY weekly Market Snapshot chart, closing 2025-09-19.
SKYY weekly Market Cycle chart, closing 2025-09-19.
SKYY weekly Market Demand chart, closing 2025-09-19.
SKYY weekly Market Strength chart, closing 2025-09-19.
SKYY weekly Market Dynamics chart, closing 2025-09-19.
SKYY weekly Market Threshold chart, closing 2025-09-19.

Weekly Report

First Trust Cloud Computing ETF (SKYY) Week Ending: Fri, 19 Sep 2025 ★★★☆☆
Price
Weekly Close

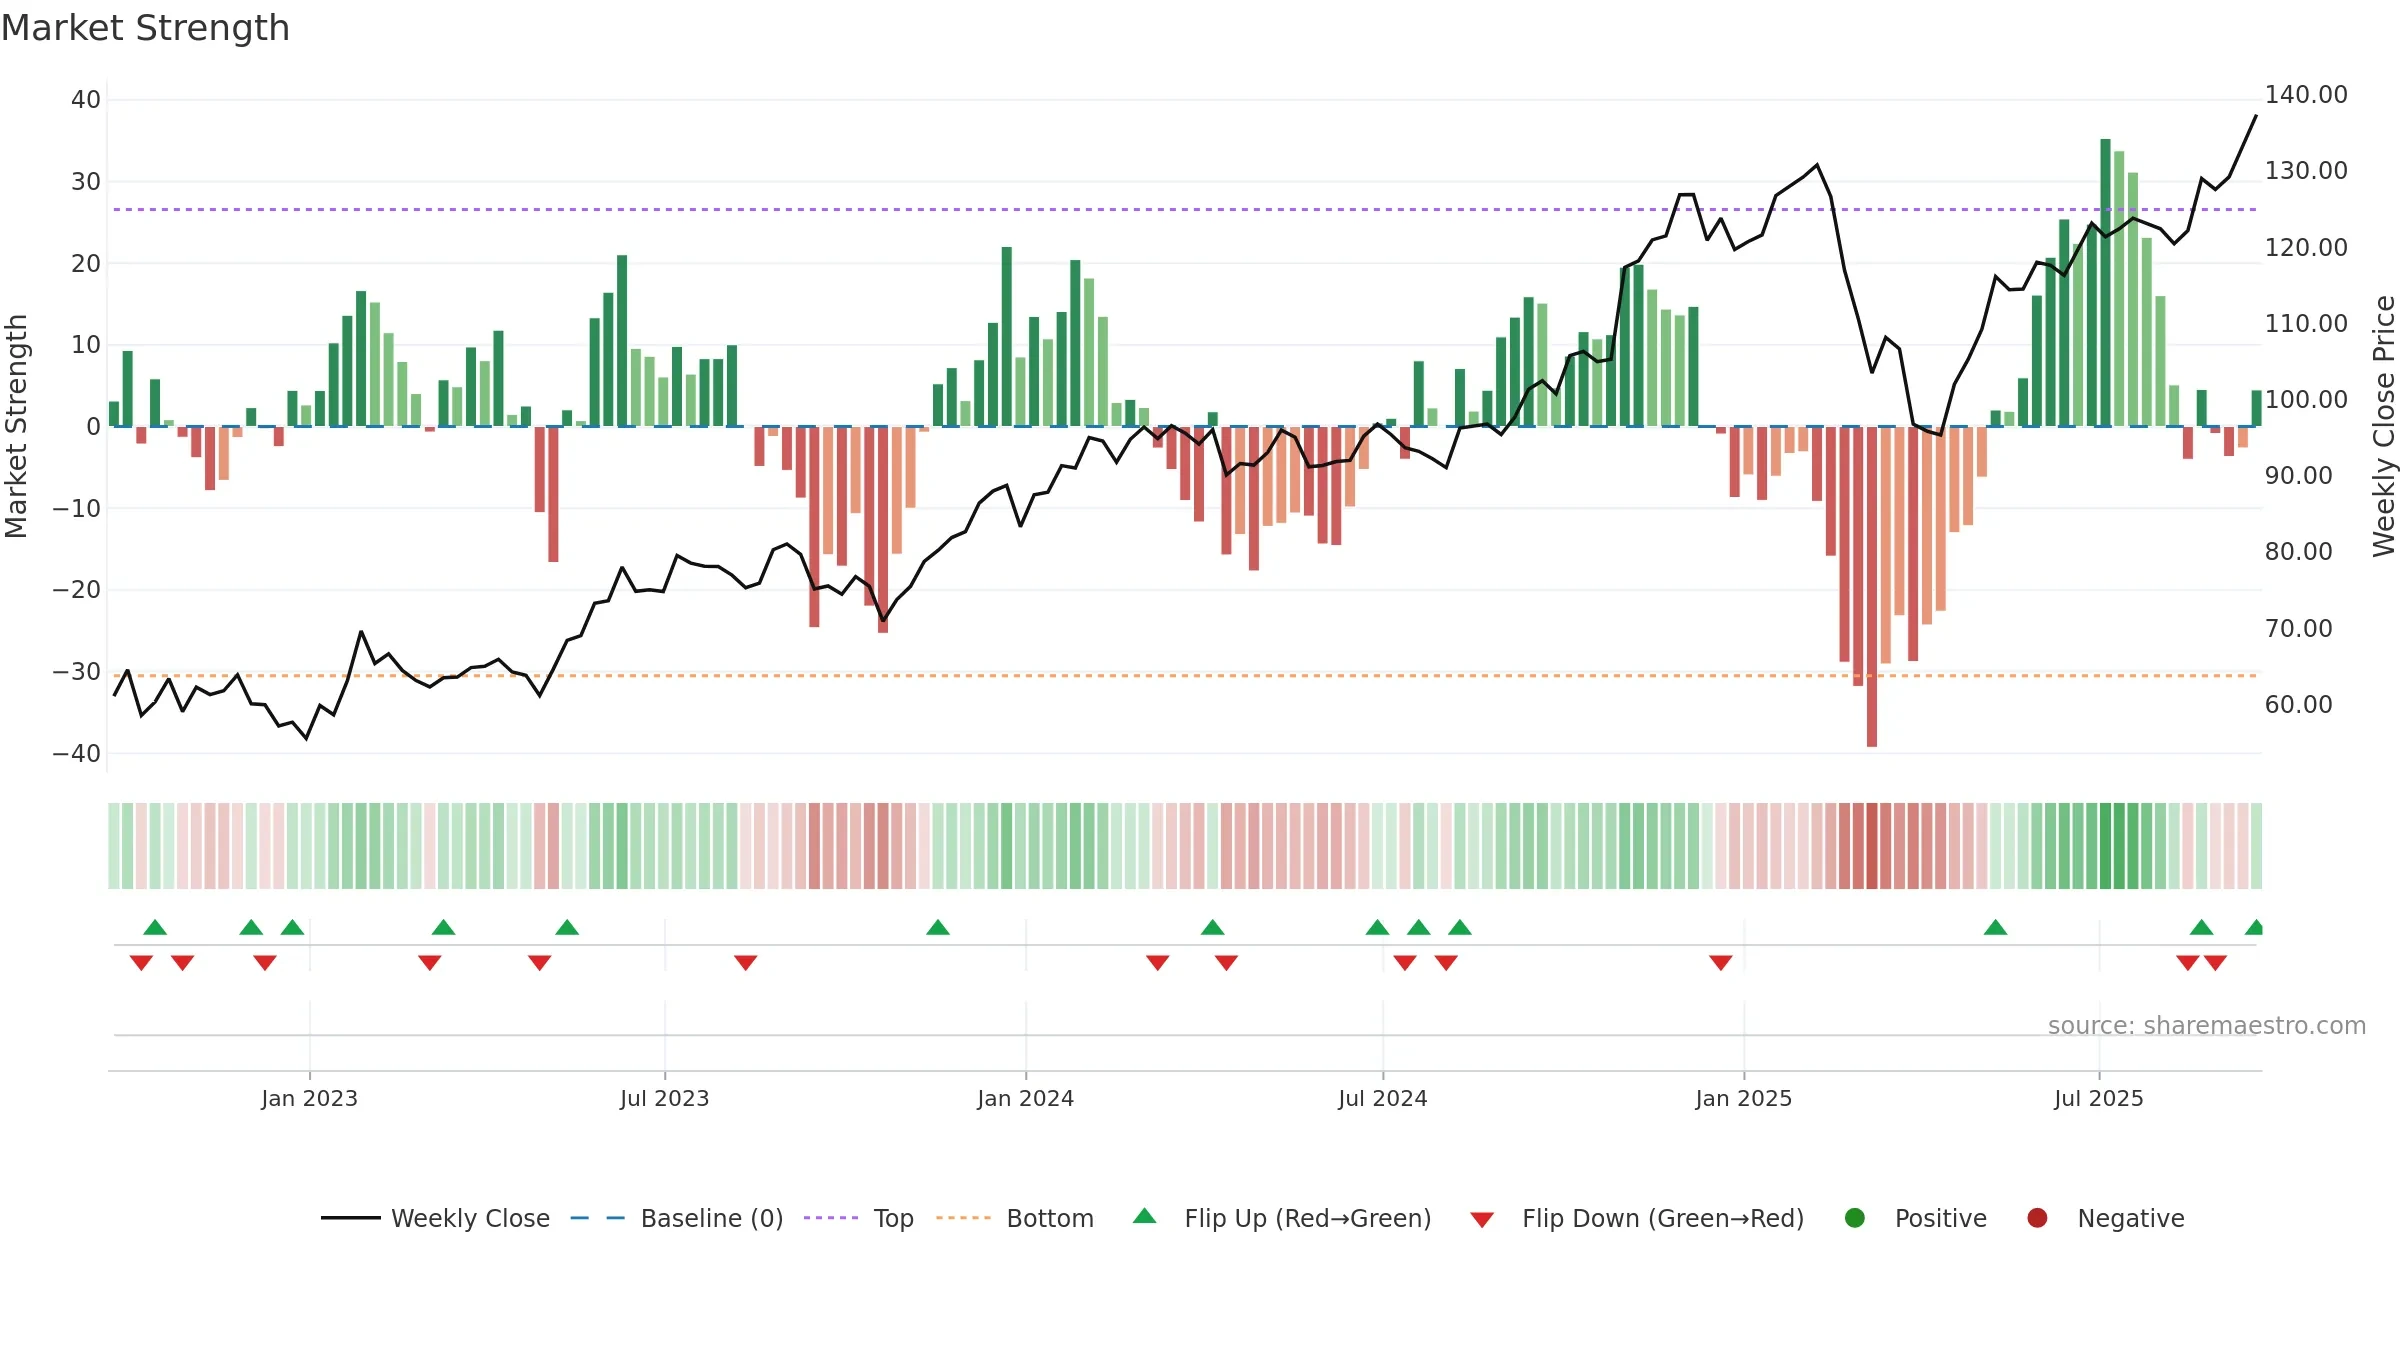
First Trust Cloud Computing ETF closed at 137.3700 (0.14% WoW) . Data window ends Fri, 19 Sep 2025.

Price Window12.23% over 8w
Volume TrendFalling
Vs 8w High3.09%
MA StackConstructive
Price vs MAsAbove
What stands out

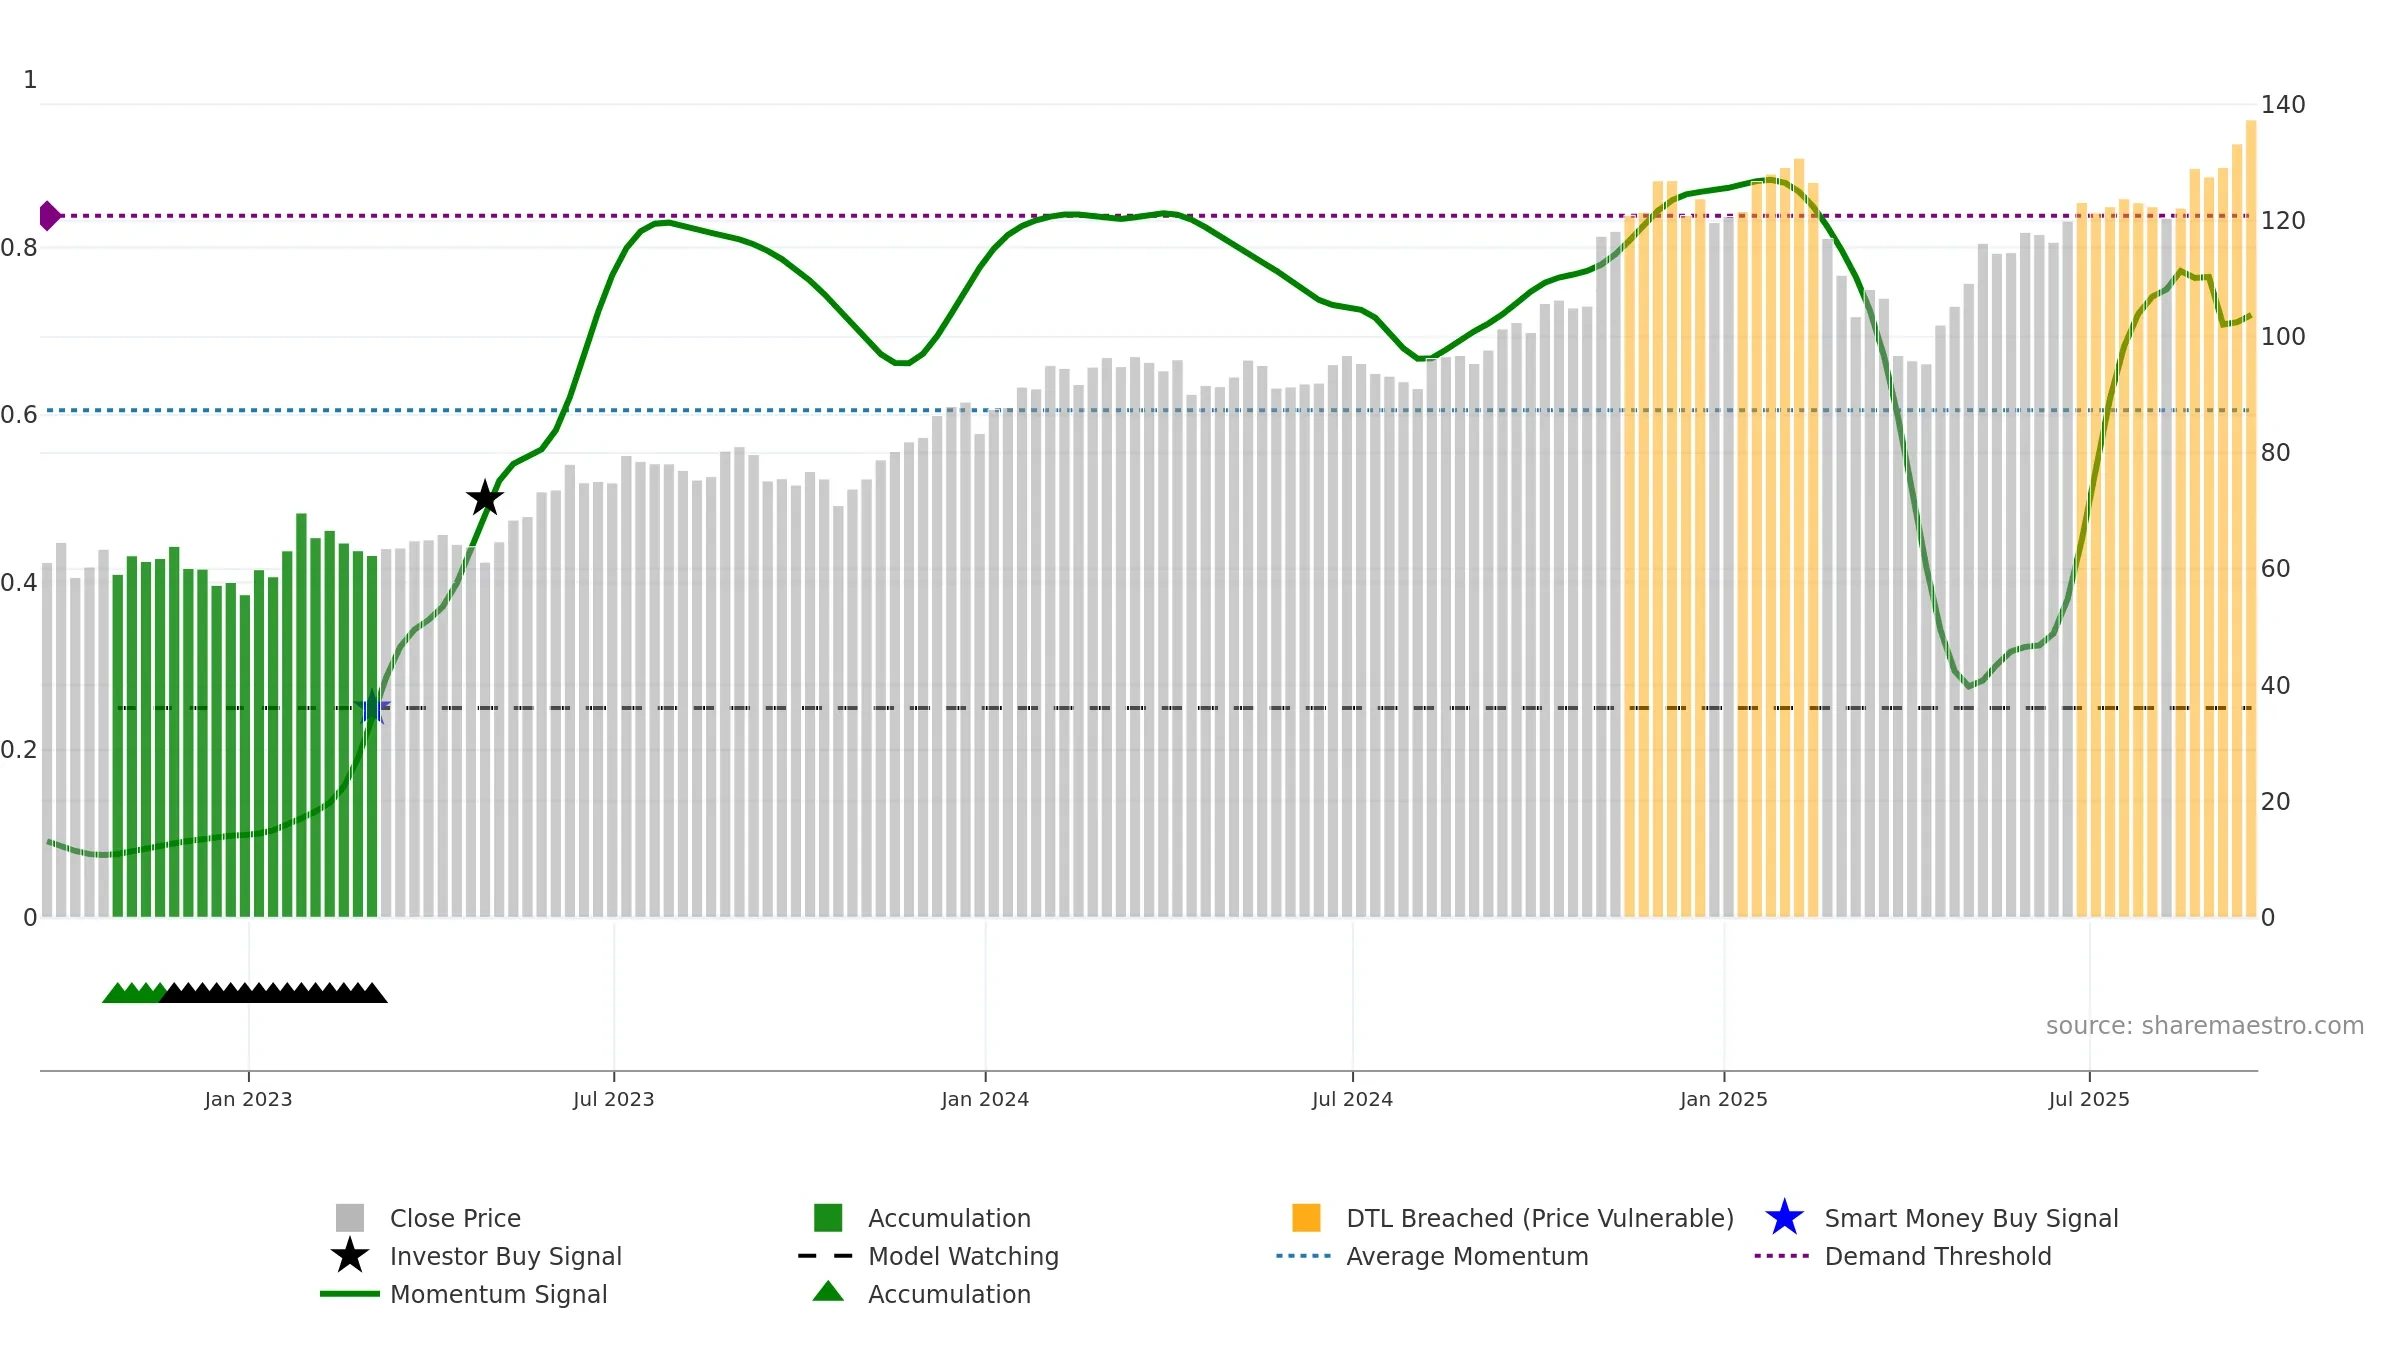
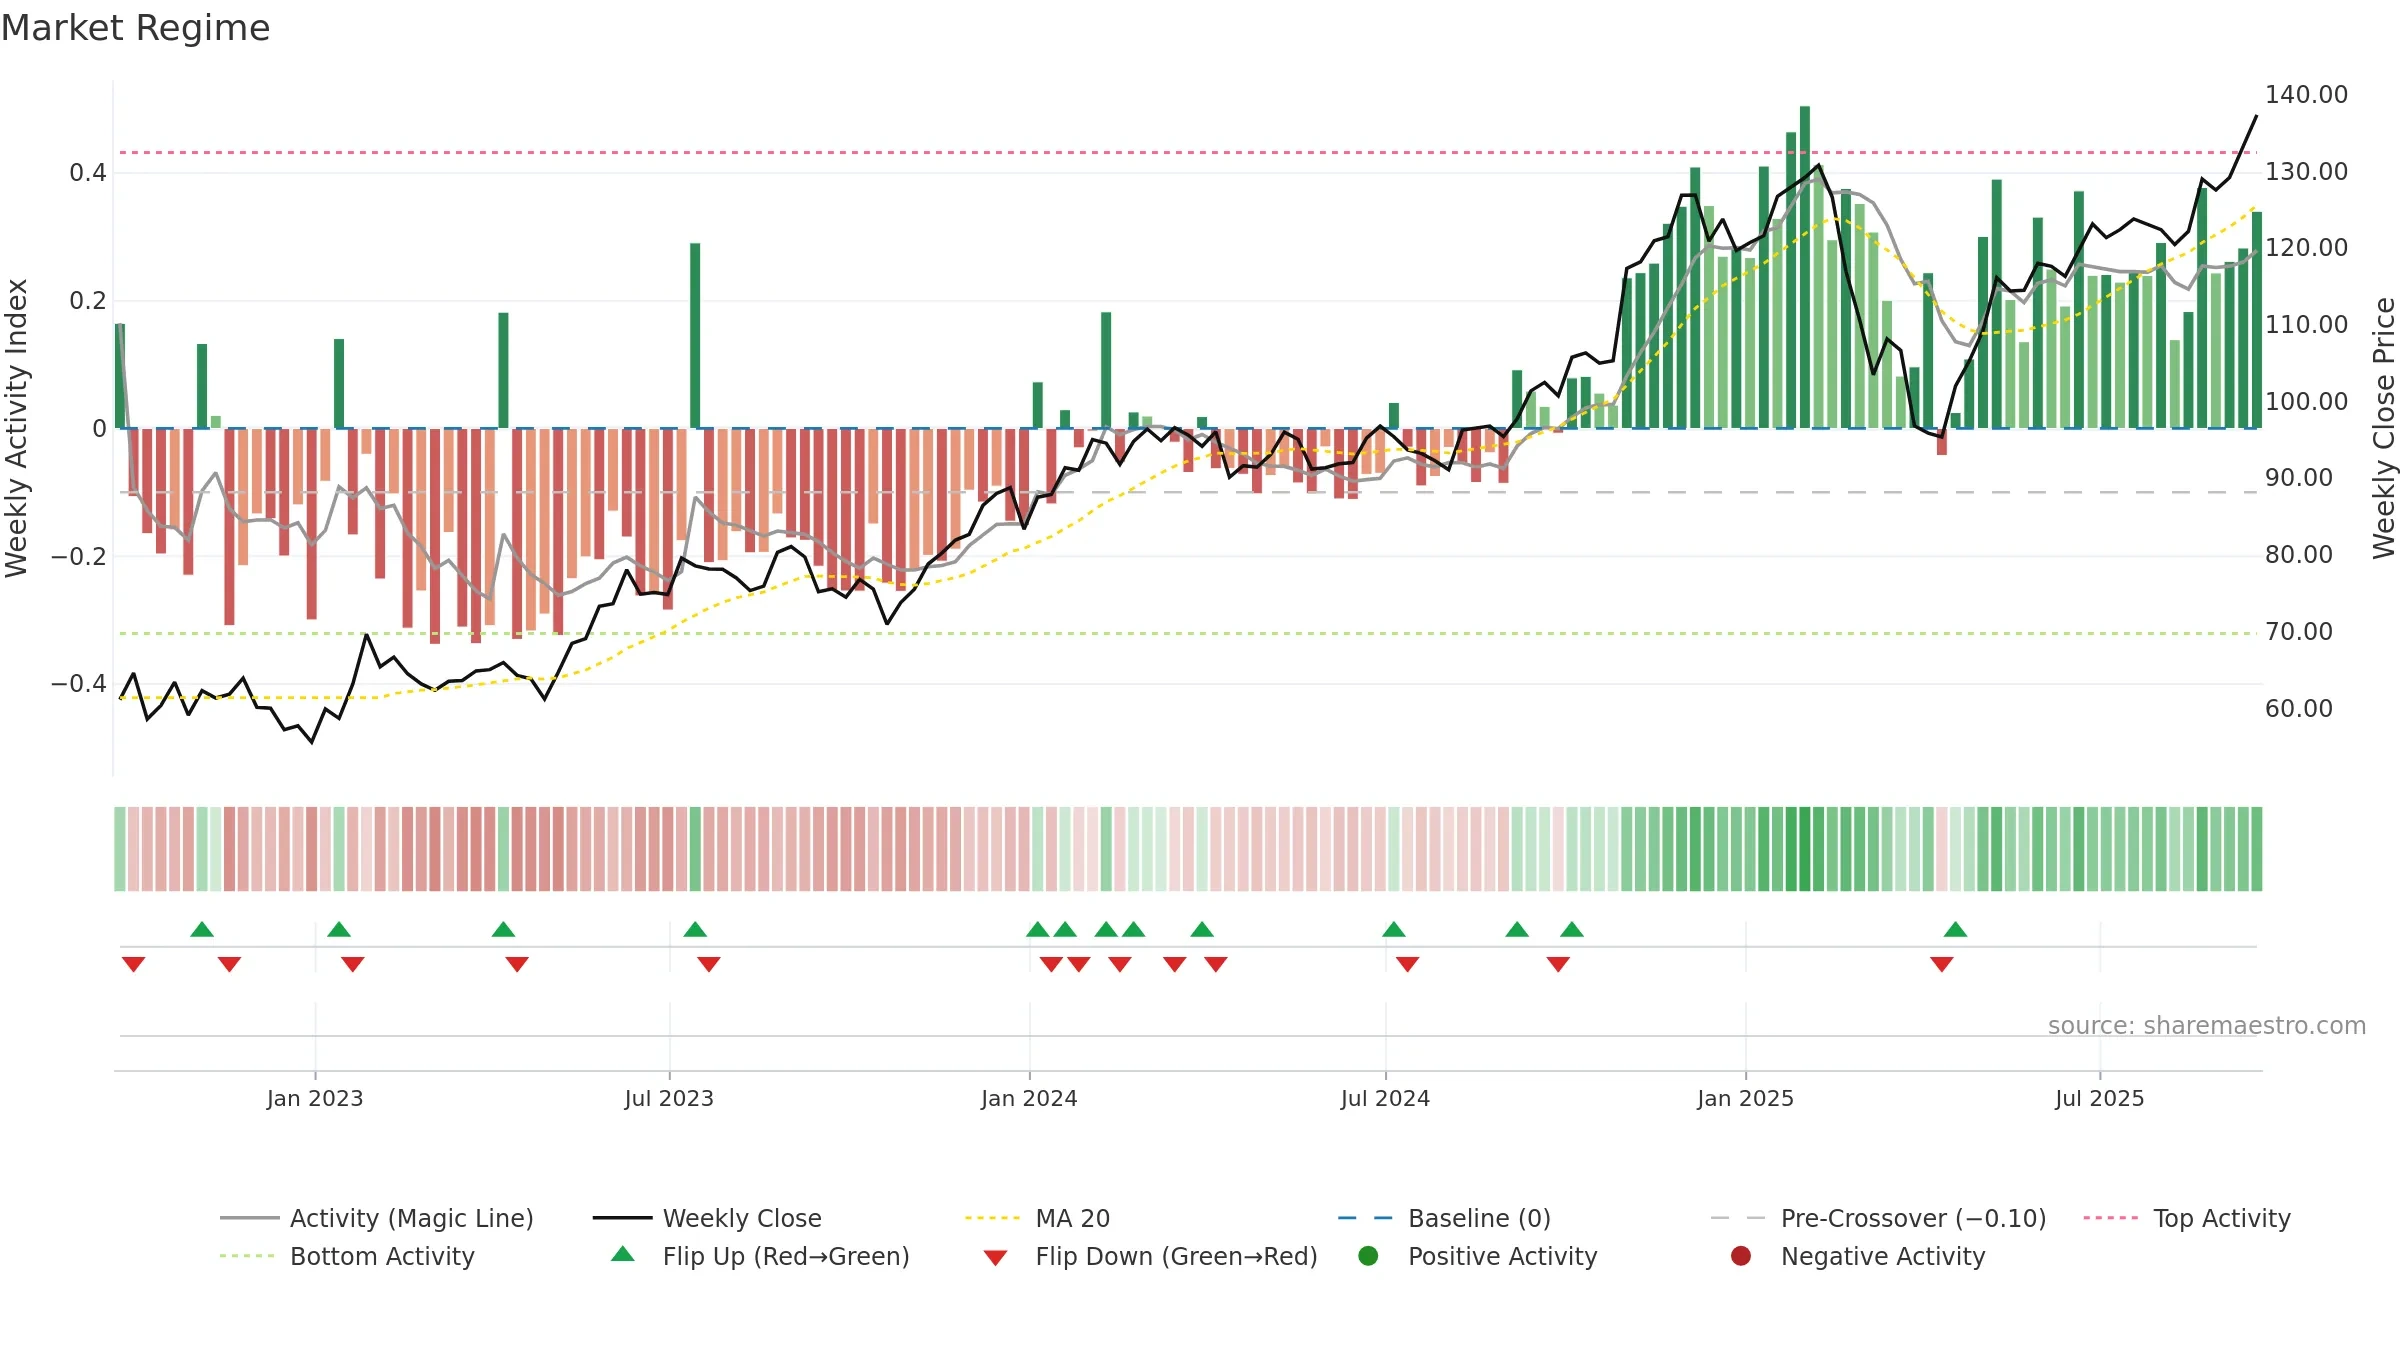
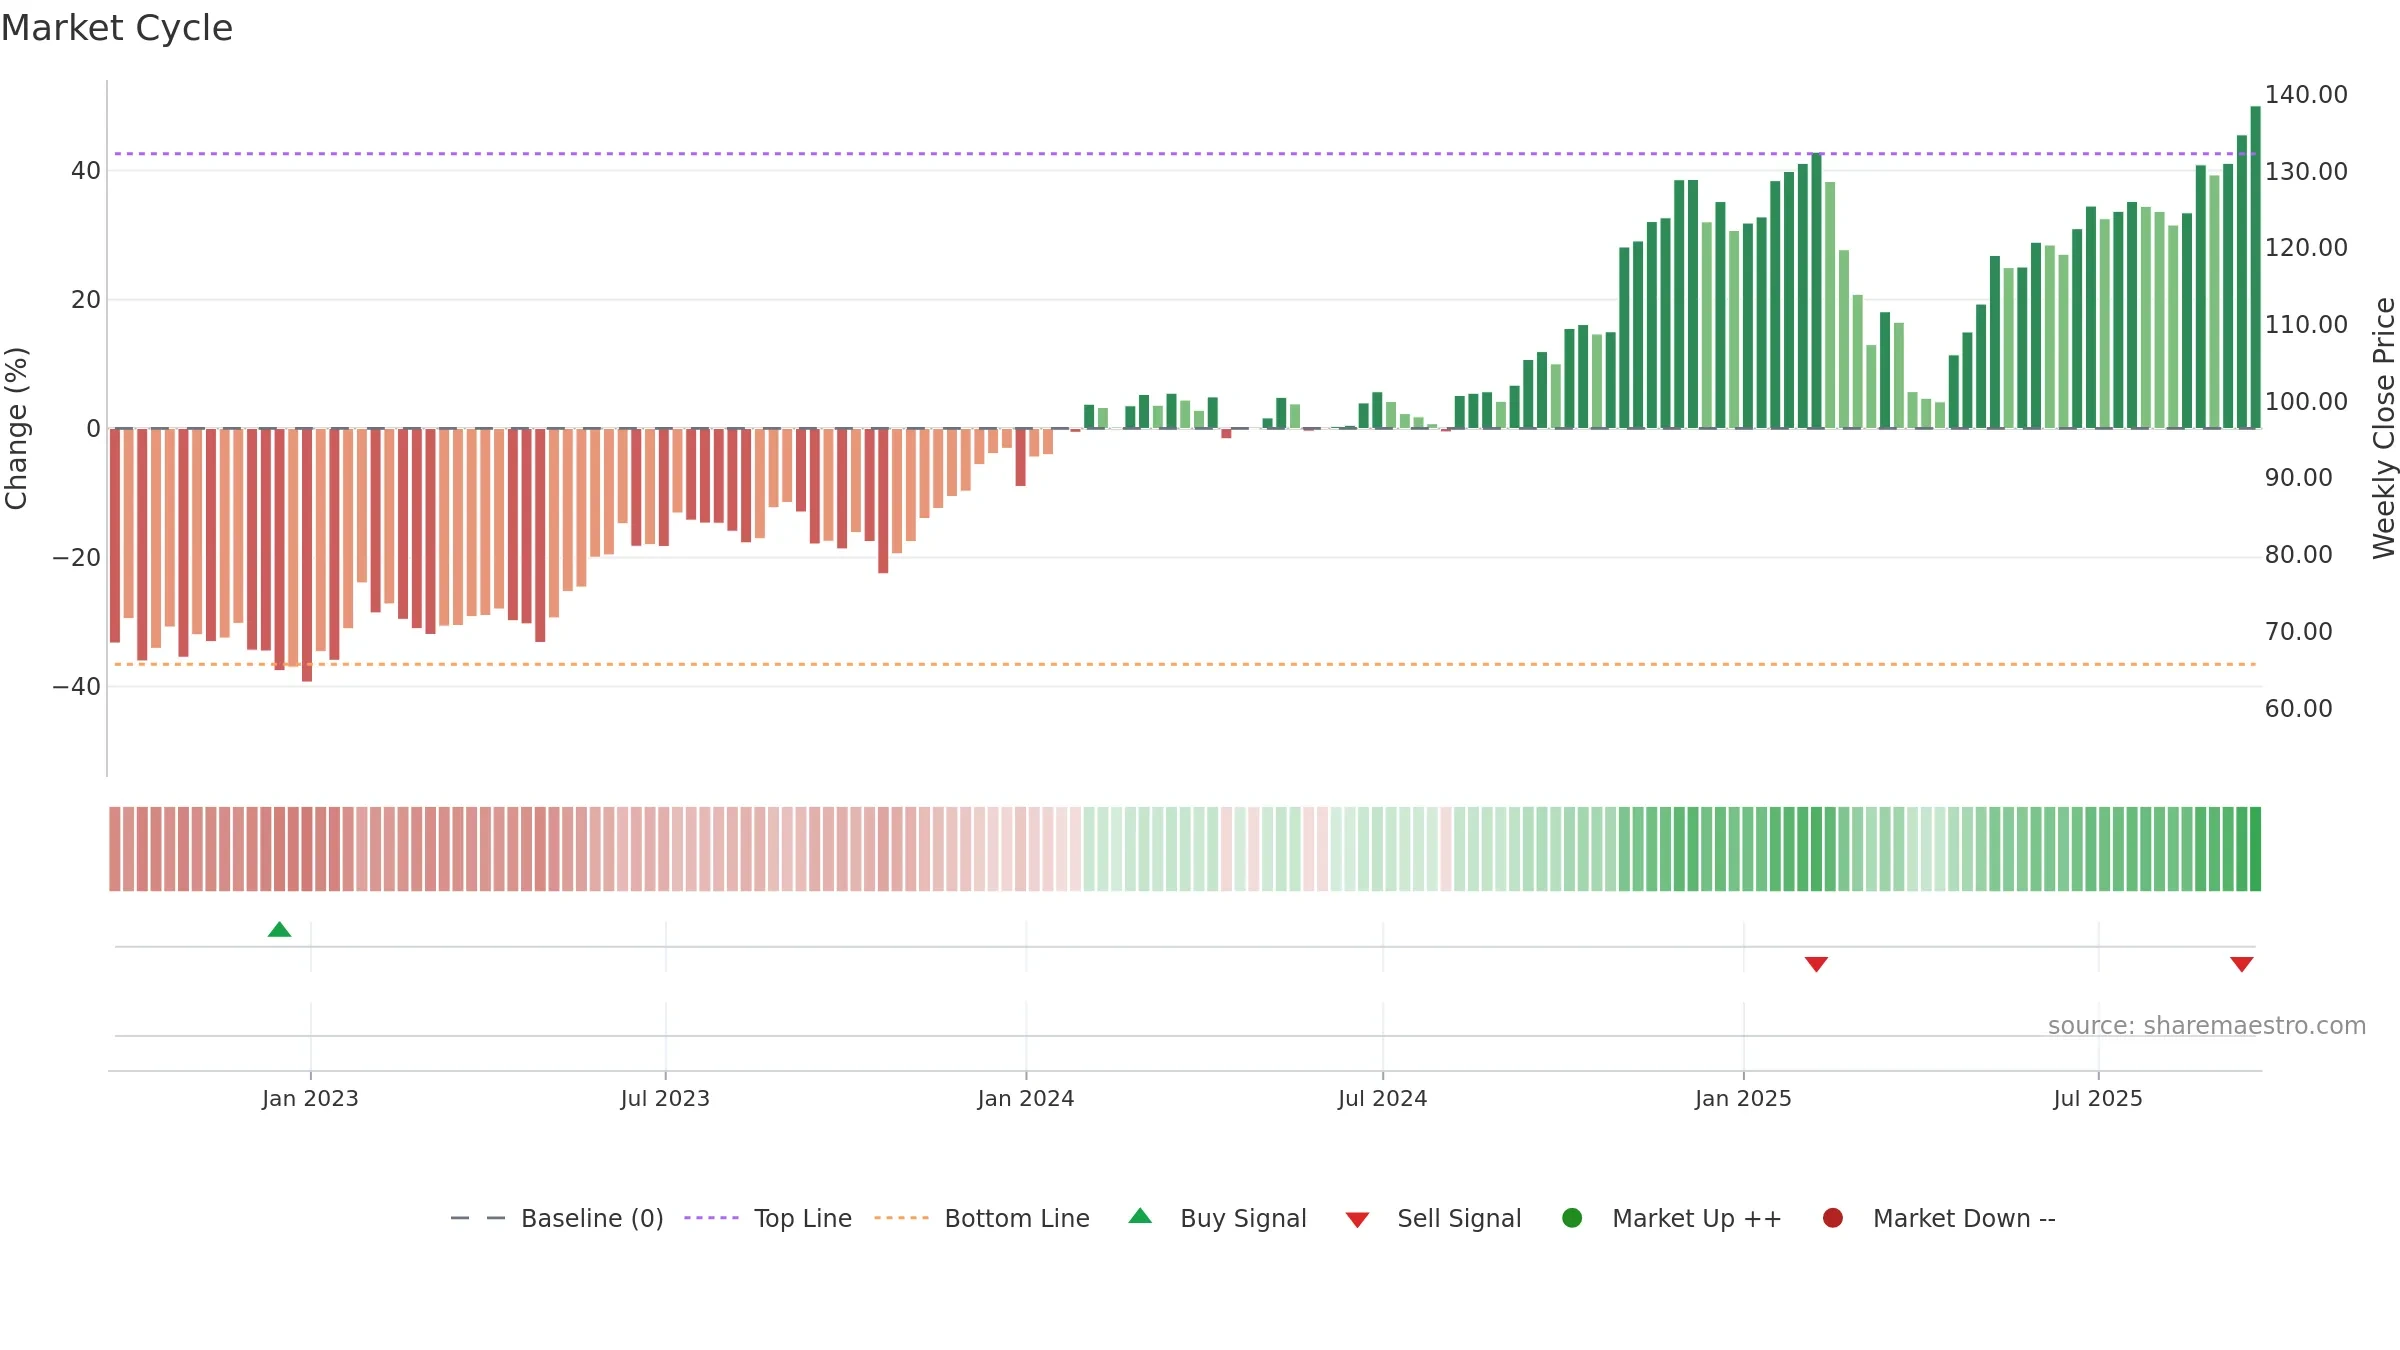
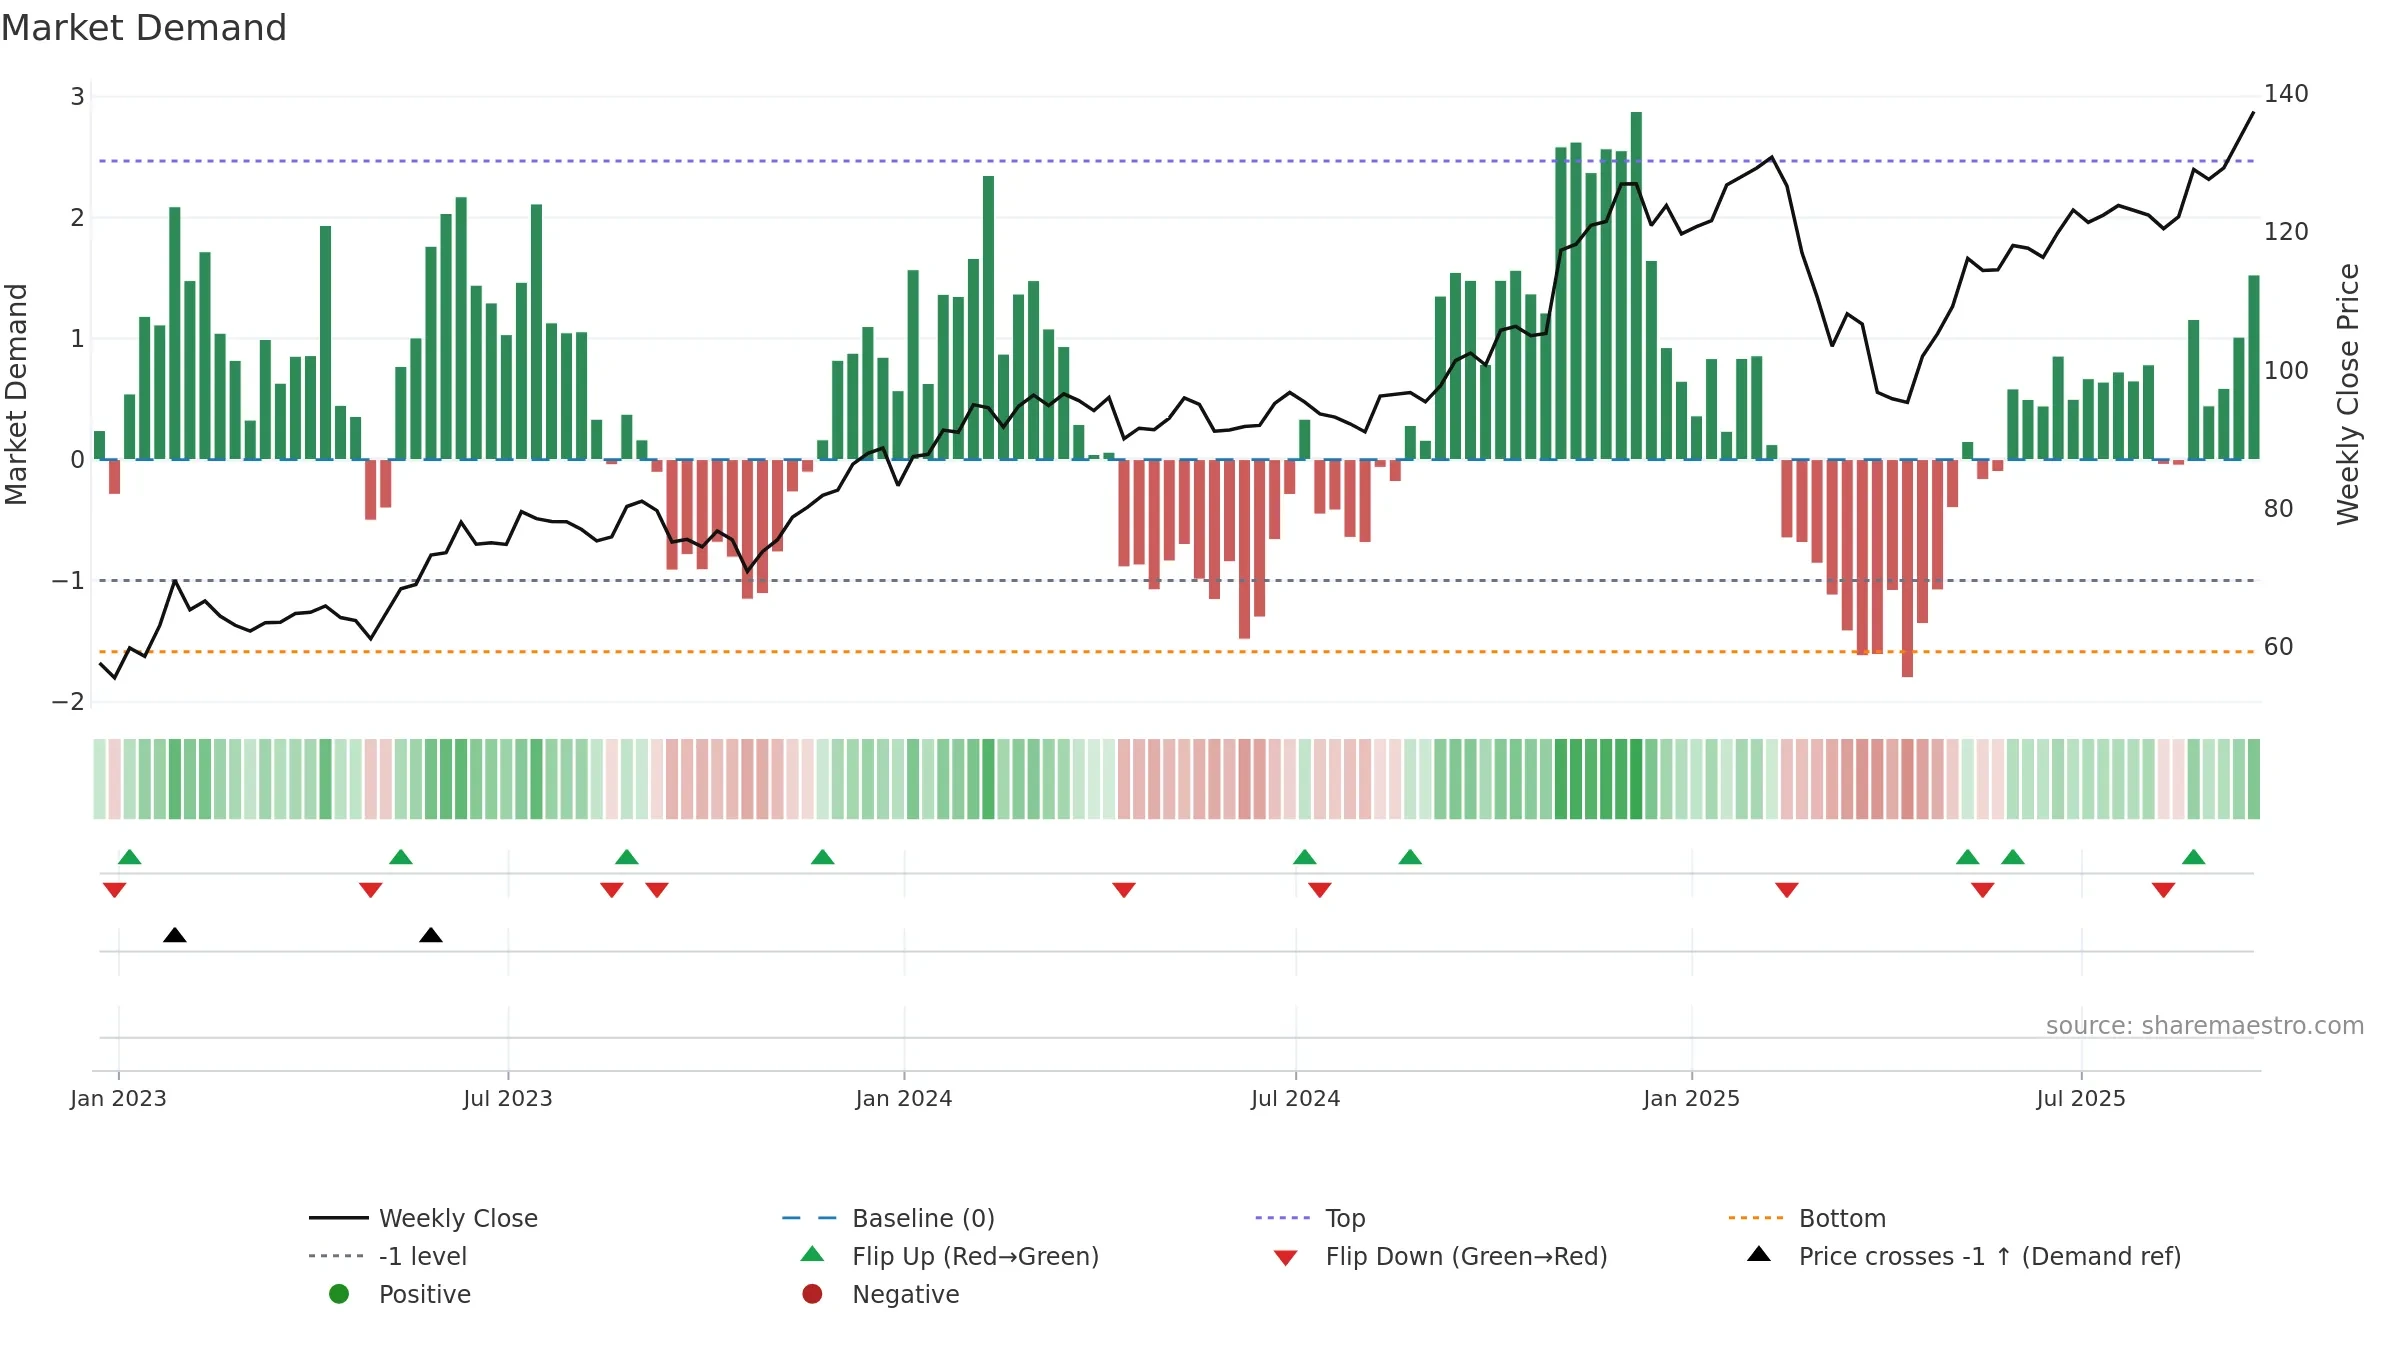
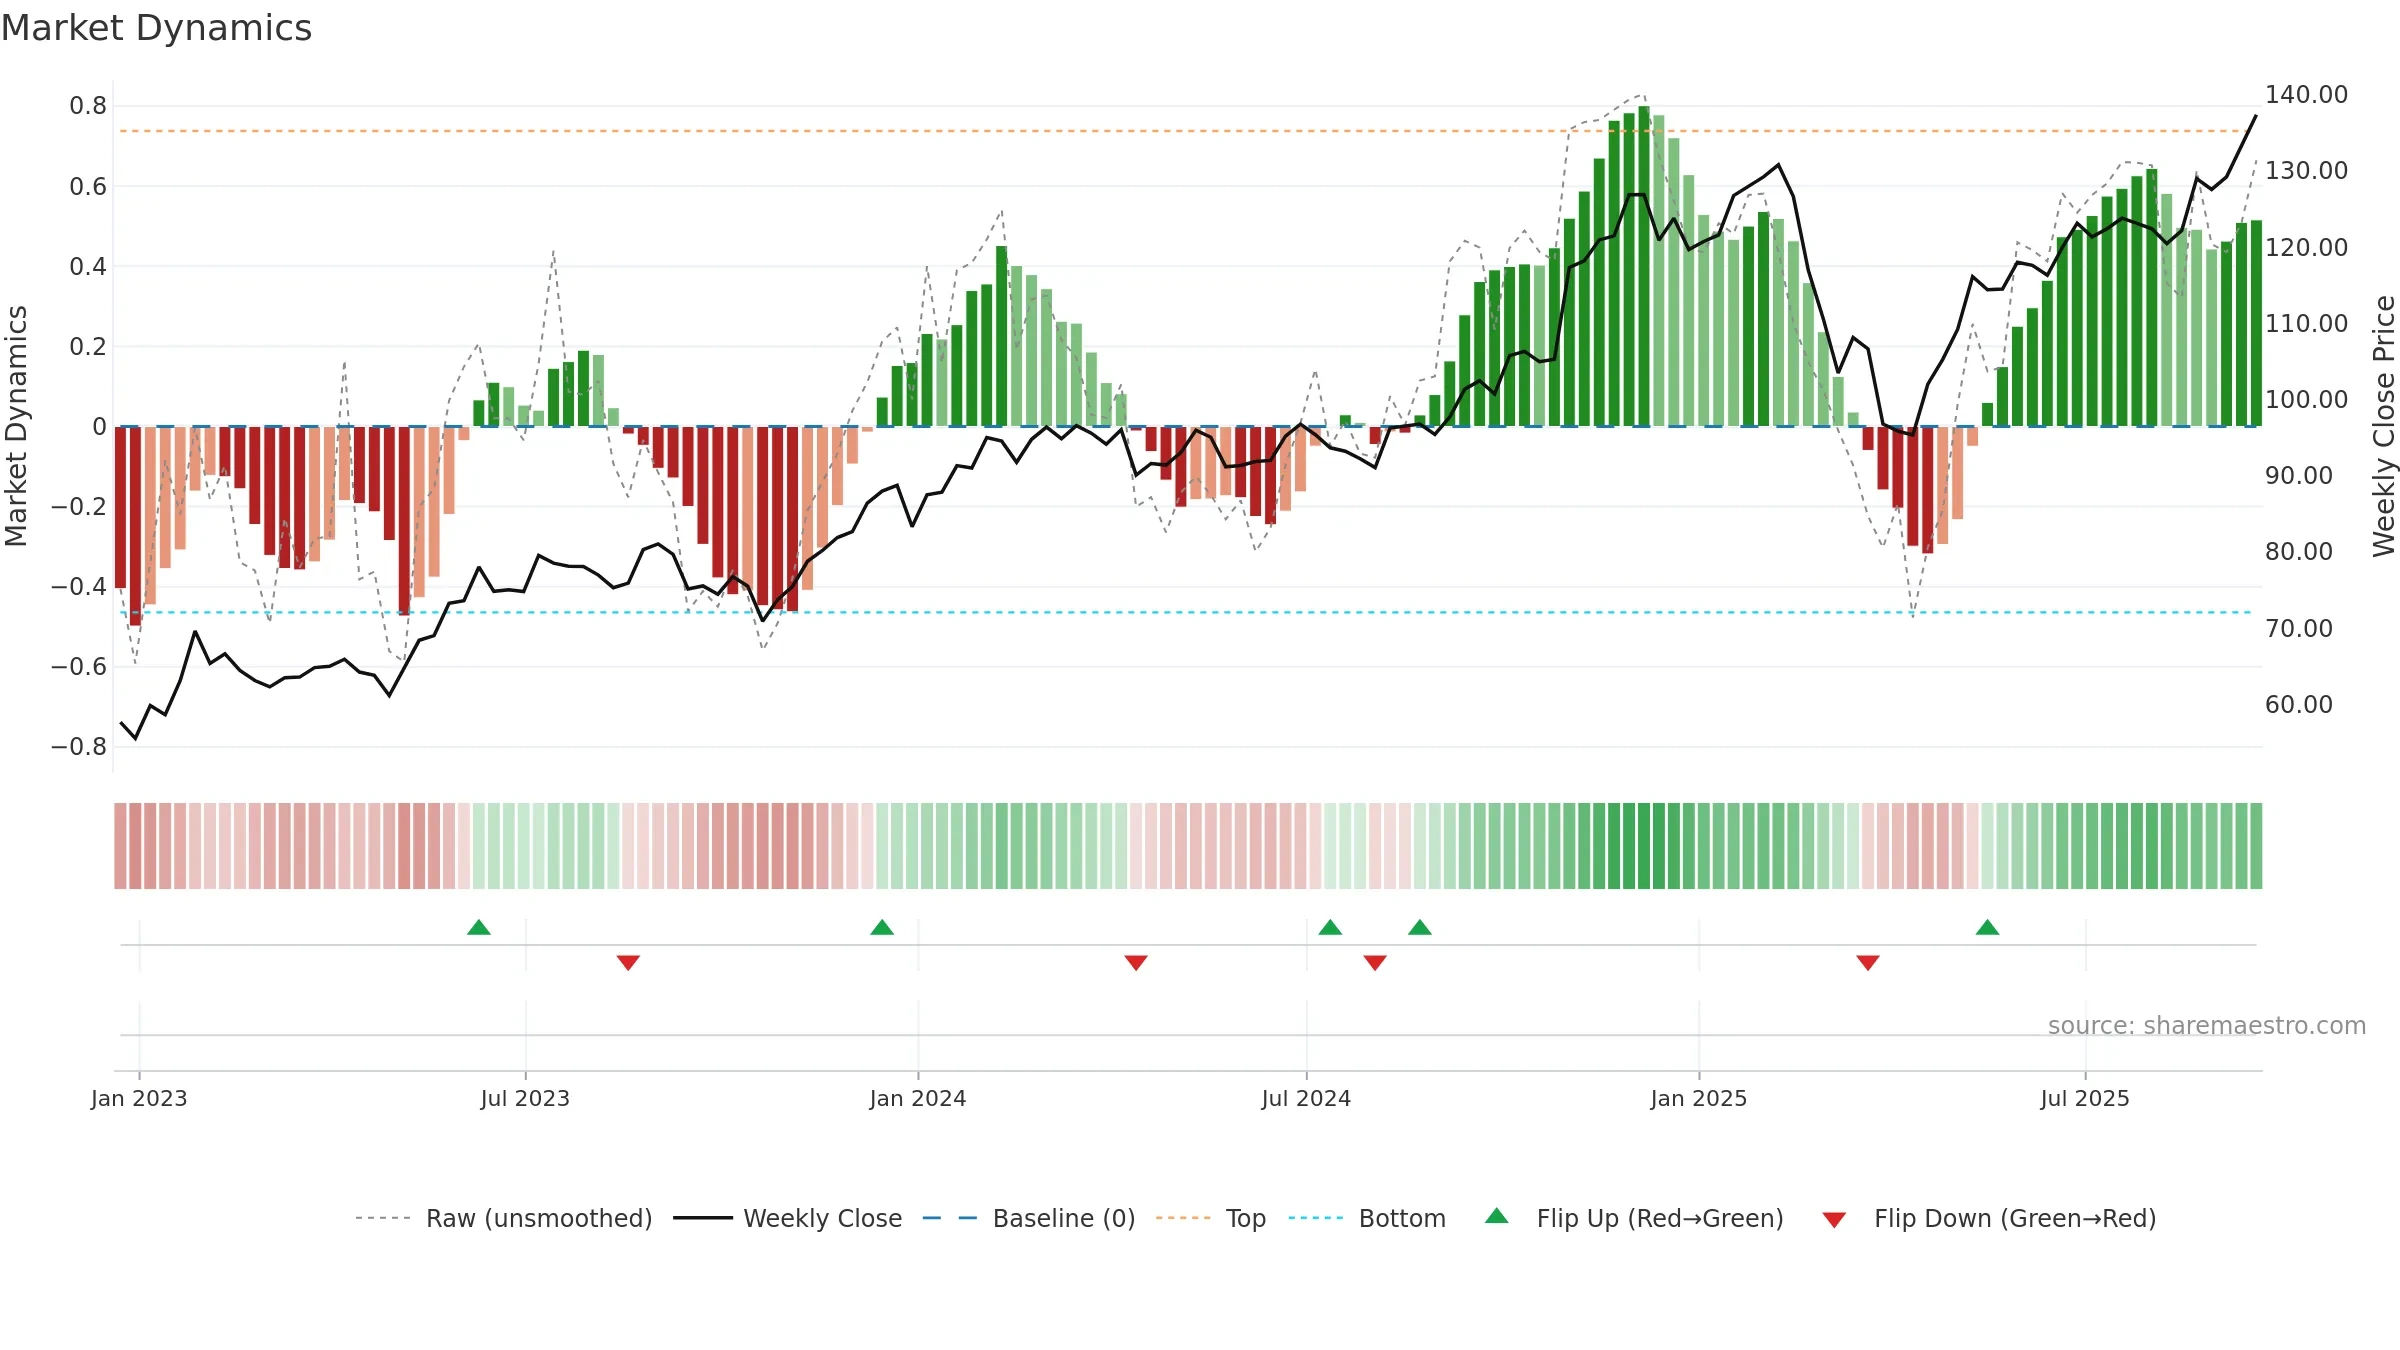
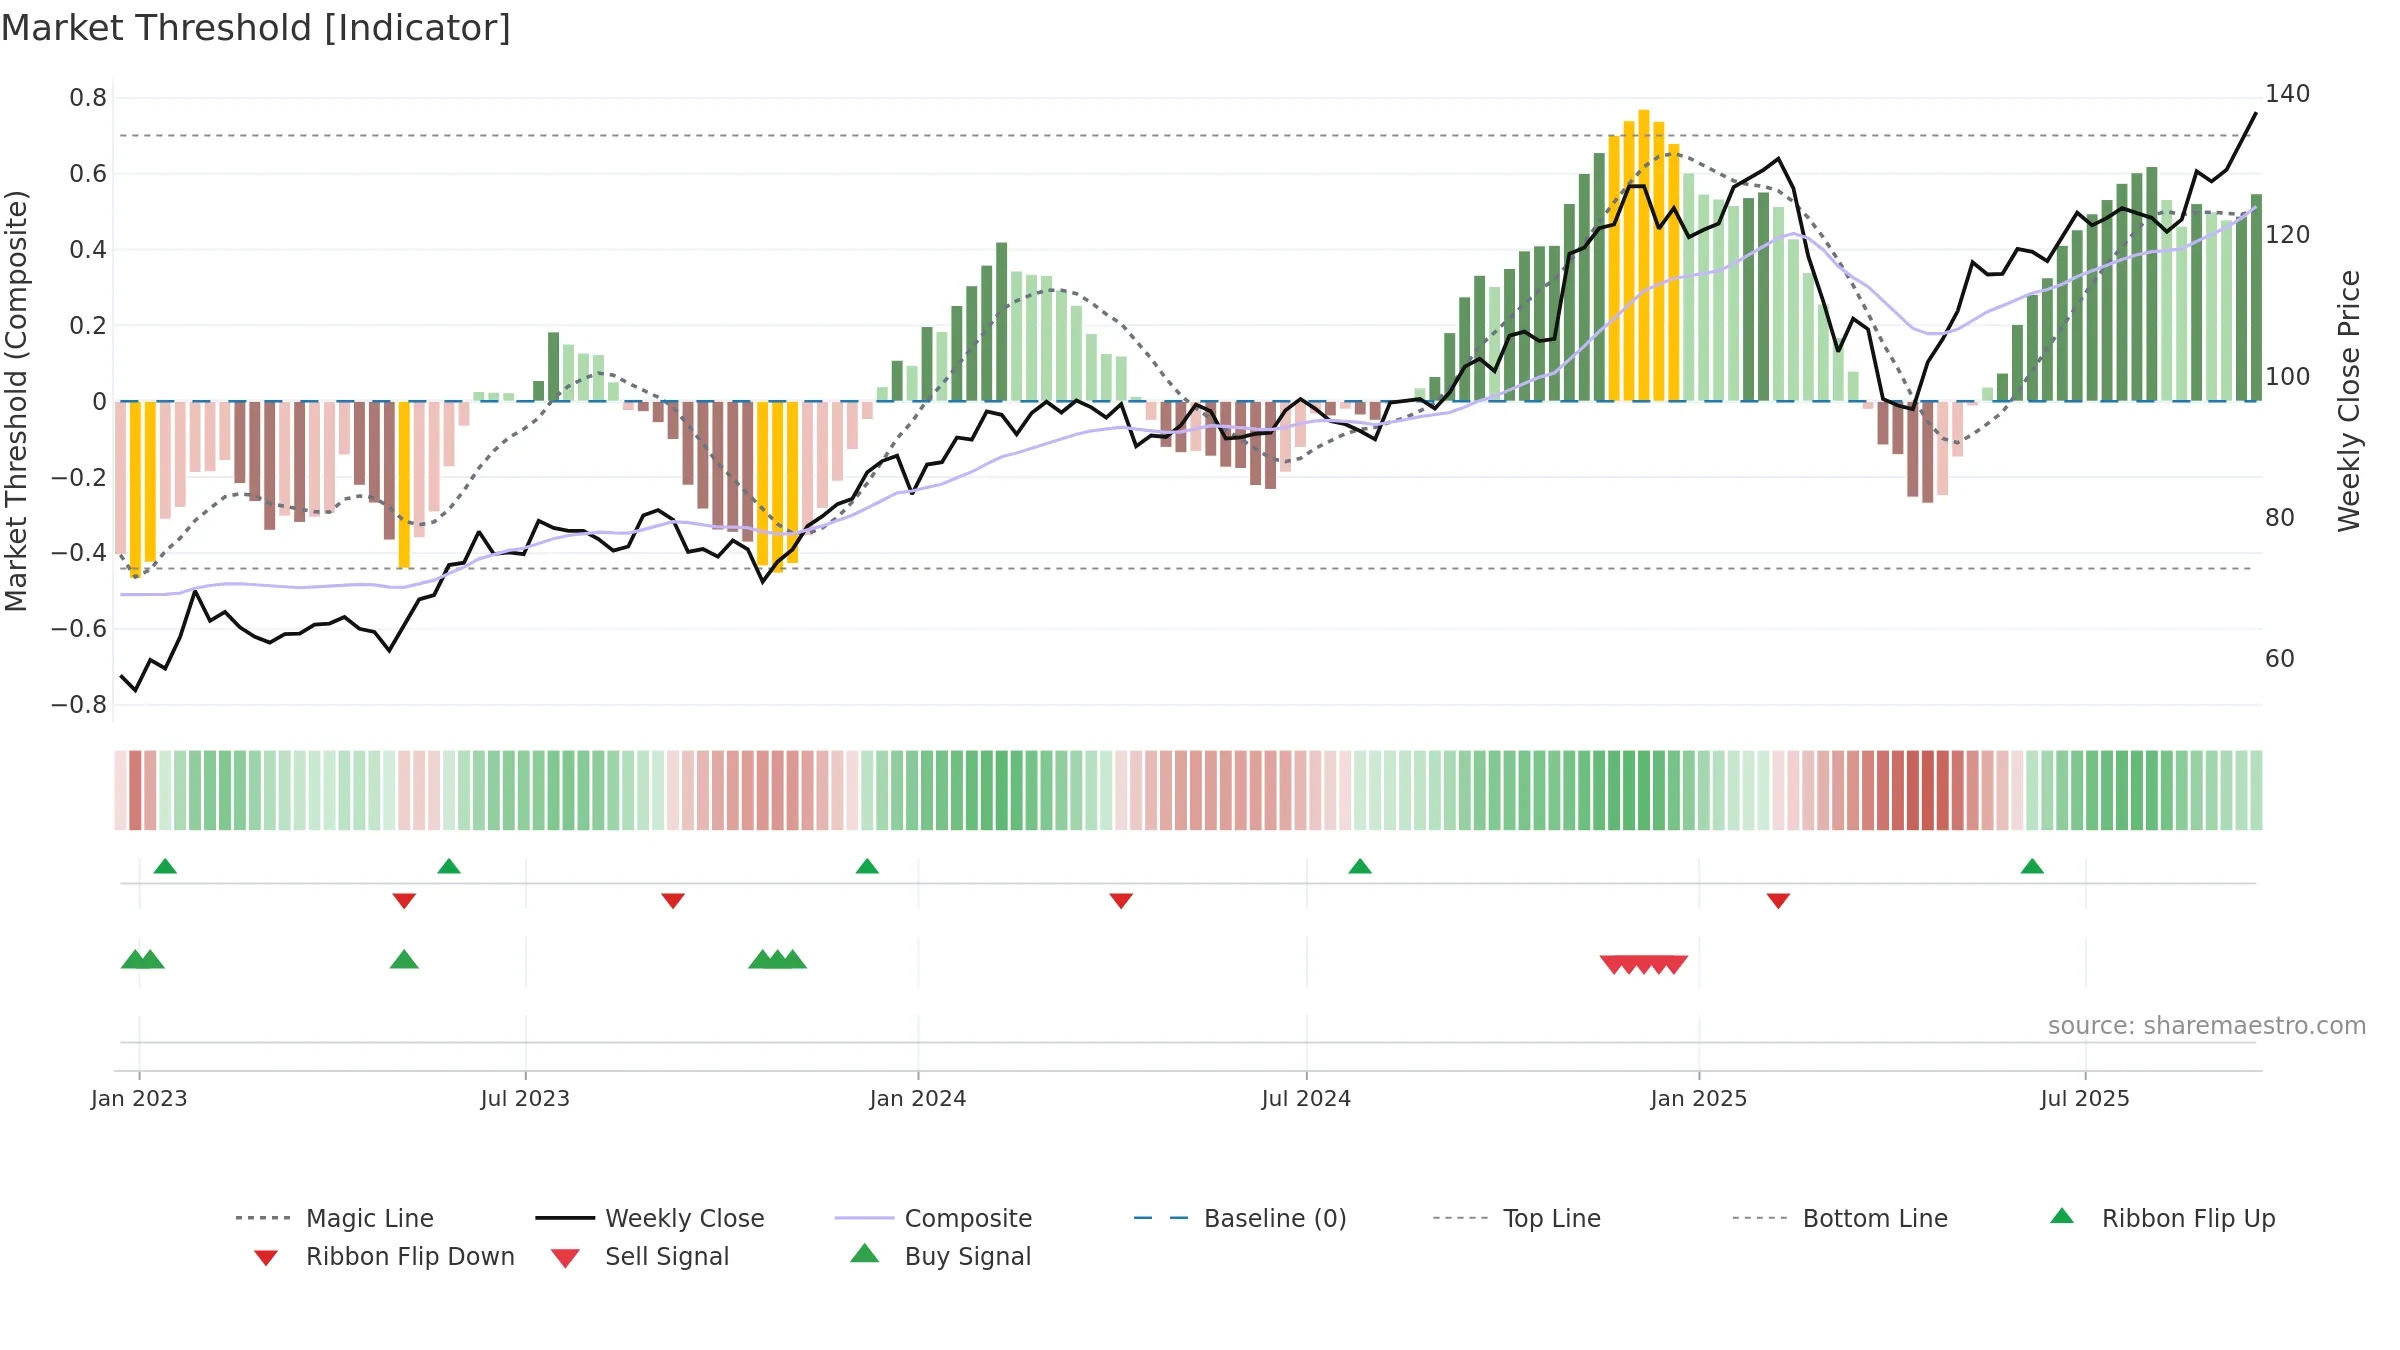
How to read this — Price slope is upward, indicating persistent buying over the window. Volume trend diverges from price — watch for fatigue or rotation. Returns are positively correlated with volume — strength tends to arrive on higher activity. Price is stretched above its baseline; consolidation risk rises if activity fades. Constructive MA stack supports the up-drift; pullbacks may find support at the 8–13 week region. Price holds above key averages, indicating constructive participation.

What to watch

Up-slope supports buying interest; pullbacks may be contained if activity stays firm. Because liquidity isn’t confirming, prefer evidence of fresh demand before chasing moves.

Trend
Sharemaestro Trend Line

Gauge maps the trend signal to a 0–100 scale.

Gauge Reading72.0/100
DirectionFalling
Accelerationdecelerating
Gauge VolatilityLow
Trend ClassificationBullish
What stands out

How to read this — Bullish gauge levels imply persistent upside pressure.

Conclusion

Neutral ★★★☆☆

Neutral setup. ★★★☆☆ confidence. Price window: 12. Trend: Bullish @ 72. In combination, liquidity diverges from price.

Strengths
  • Price holds above 8w & 26w averages
  • Constructive moving-average stack
  • Solid multi-week performance
Watch-outs
  • Momentum is weak/falling
  • Liquidity diverges from price

Why: Price window 12.23% over 8w. Close is 3.09% above the prior-window high. Volume trend falling. Liquidity divergence with price. MA stack constructive. Momentum bullish and falling .

Price Window Endpoint return over the last N weeks using weekly closes: (Closelast − Closefirst)/Closefirst × 100.
Return Volatility Std-dev of weekly returns (%). Higher = choppier.
Volume Trend Slope of weekly volume across the window (rising / falling / flat).
Vs N-week High % distance of latest close from the highest close in the window.
Accumulation Weeks Weeks price rose on higher volume than the prior week.
Distribution Weeks Weeks price fell on higher volume than the prior week.
MA Stack Relative order of short / intermediate / long MAs. Short > long is constructive.
4–8 Crossover Latest cross of 4-week vs 8-week MA (bullish / bearish / none).
Price vs MAs Whether the close is above/below key averages (8w & 26w).
Baseline Deviation % distance from the market-cycle baseline (fair-value track).
Gauge Reading Smoothed trend signal mapped to 0–100.
Direction Slope sign of the gauge across the window (rising / falling).
Acceleration Change in the slope of the gauge (accelerating / decelerating).
Gauge Volatility Variability of the gauge (low / normal / high).
Zone Label Classification by level (Bullish / Neutral / Bearish).
Target Price (Flag) If flagged: Positive/Negative stance. Otherwise: numeric fair value.
Composite Score Overall model score (0–10).
Hybrid Efficiency Efficiency of growth × quality (0–10).
Rating Model’s verdict for the snapshot.
Weekly Close Sparkline of the last 52 weekly closing prices.
Trend Line Sparkline of the smoothed trend signal over the last 52 weeks.

Tip: Most metrics also include a hover tooltip where they appear in the report.

Download JSON Download CSV JSON-LD Snapshots: 2025-09-19