No results found.

Grayscale Bitcoin Trust ETF

GBTC ETF-US
Week Ending
Fri, 19 Sep 2025
Open
91.2400
Close
90.3400
High
91.4850
Low
90.3100
Trend
0.81635
Sharemaestro [Charts]
GBTC weekly Smart Money chart, closing 2025-09-19.
GBTC weekly Market Snapshot chart, closing 2025-09-19.
GBTC weekly Market Cycle chart, closing 2025-09-19.
GBTC weekly Market Demand chart, closing 2025-09-19.
GBTC weekly Market Strength chart, closing 2025-09-19.
GBTC weekly Market Dynamics chart, closing 2025-09-19.
GBTC weekly Market Threshold chart, closing 2025-09-19.

Weekly Report

Grayscale Bitcoin Trust ETF (GBTC) Week Ending: Fri, 19 Sep 2025 ★★★☆☆
Price
Weekly Close

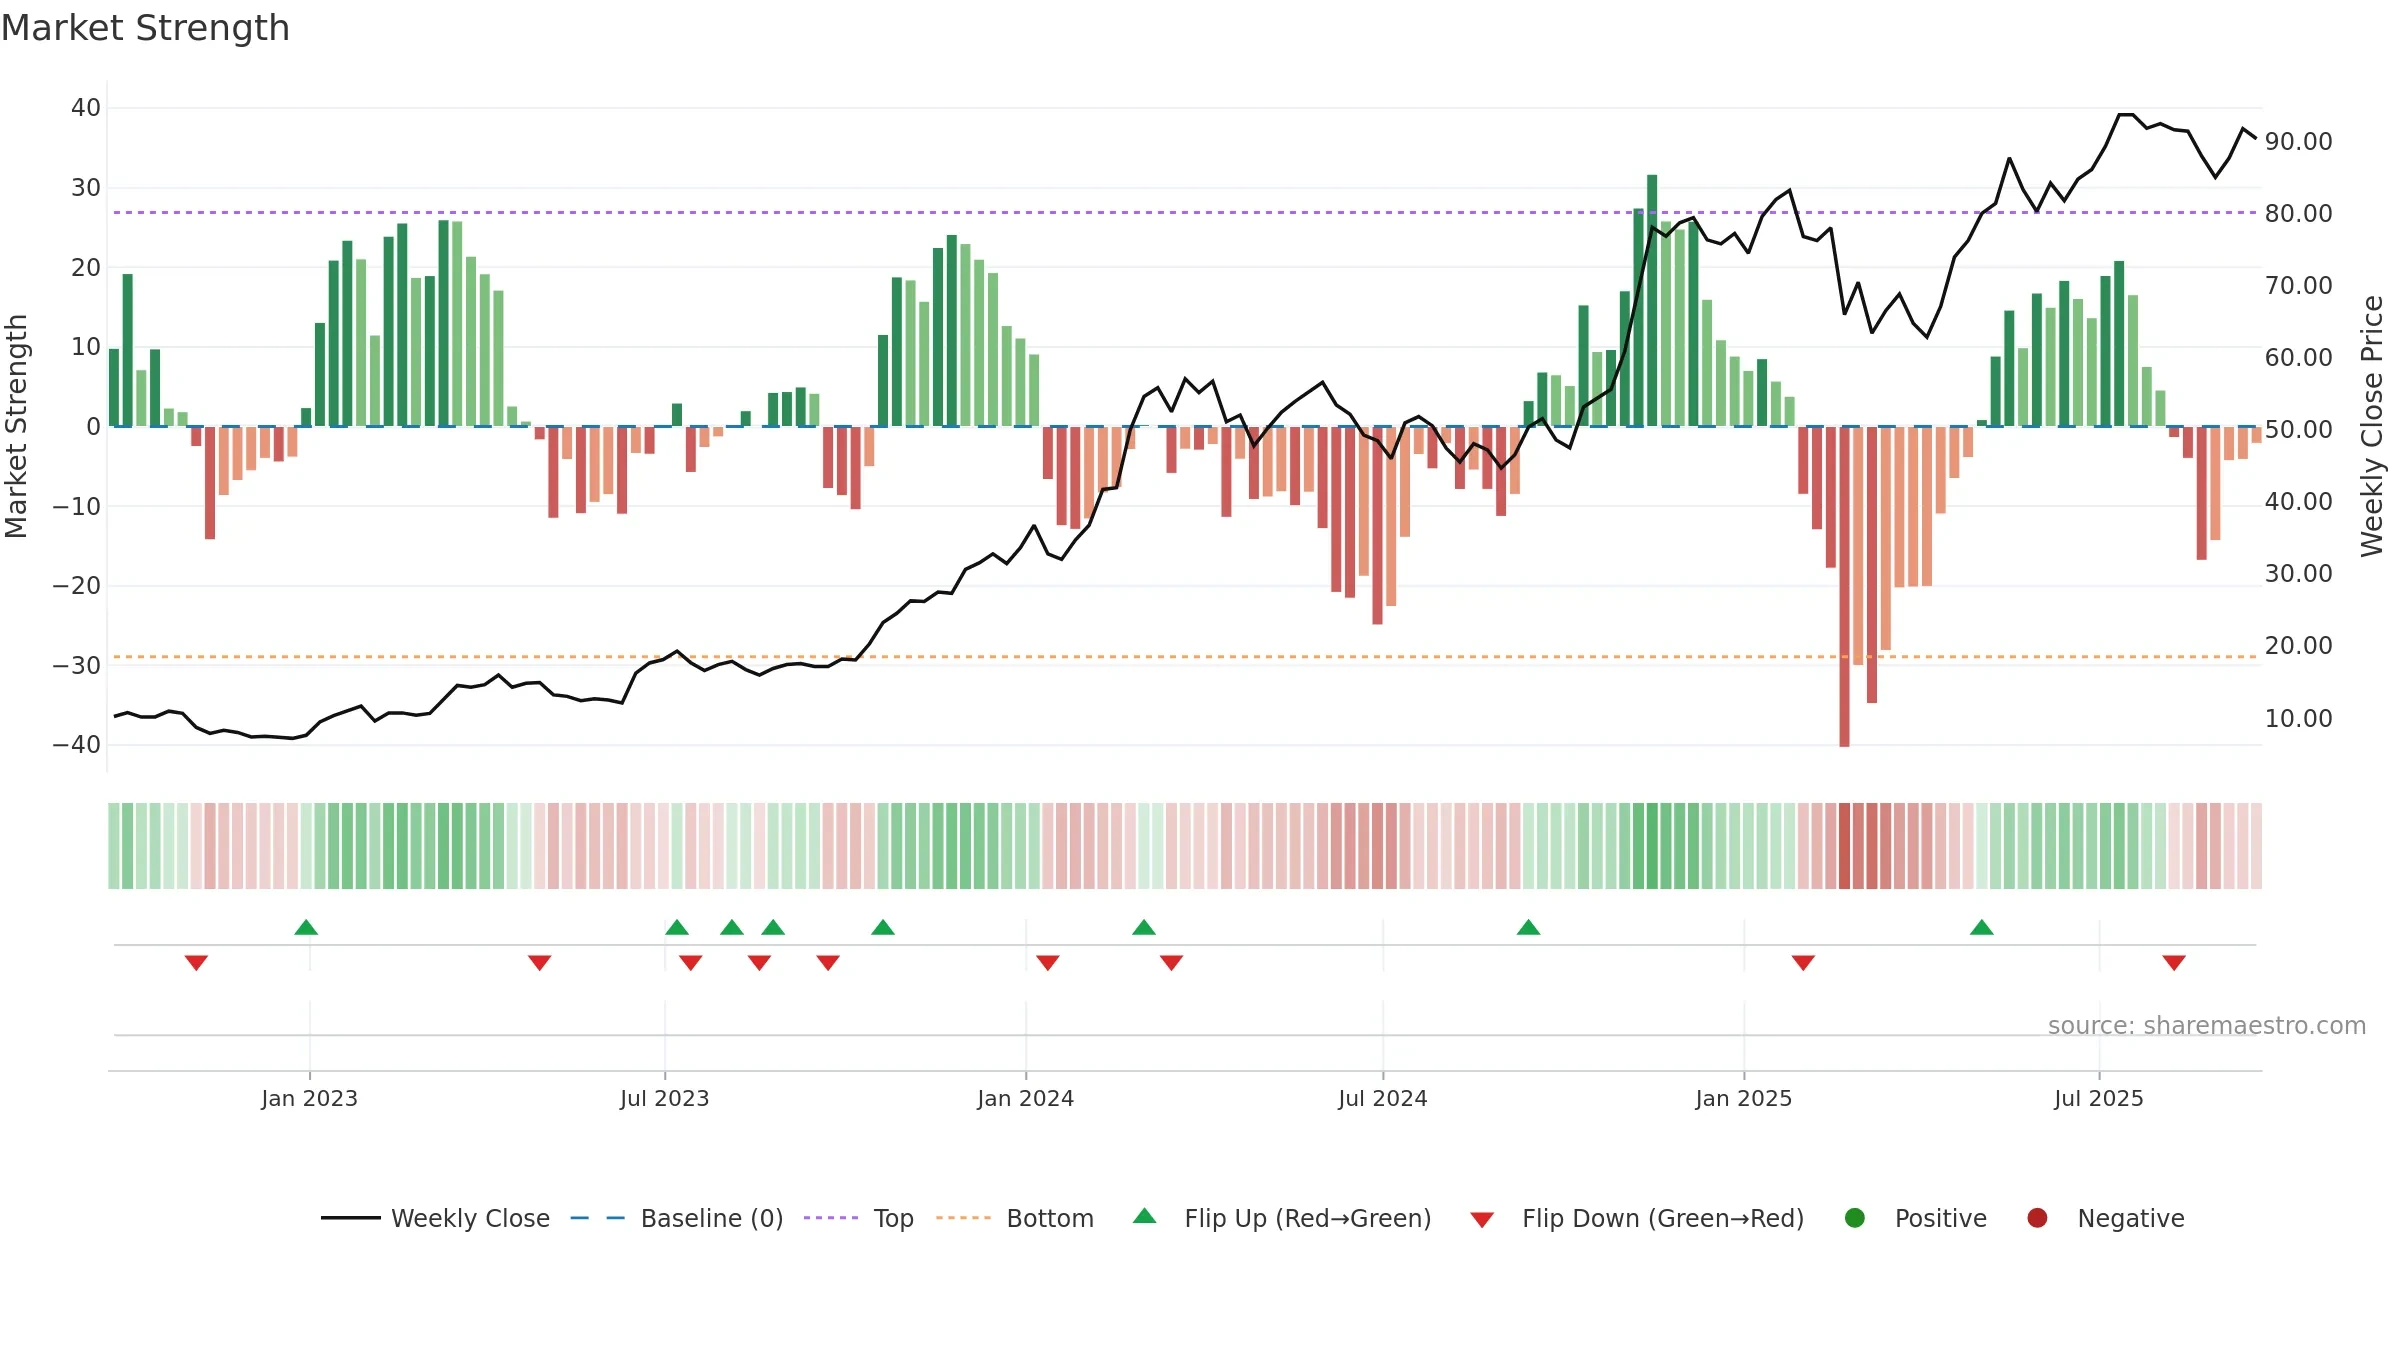
Grayscale Bitcoin Trust ETF closed at 90.3400 (-0.99% WoW) . Data window ends Fri, 19 Sep 2025.

Price Window-2.27% over 8w
Return Volatility1.36%
Volume TrendFalling
Vs 8-week High-2.27%
Accumulation Weeks0
Distribution Weeks2
MA StackMixed
4–8 CrossoverNone
Price vs MAsAbove
Baseline Deviation1.04% (narrowing)
Interpretation

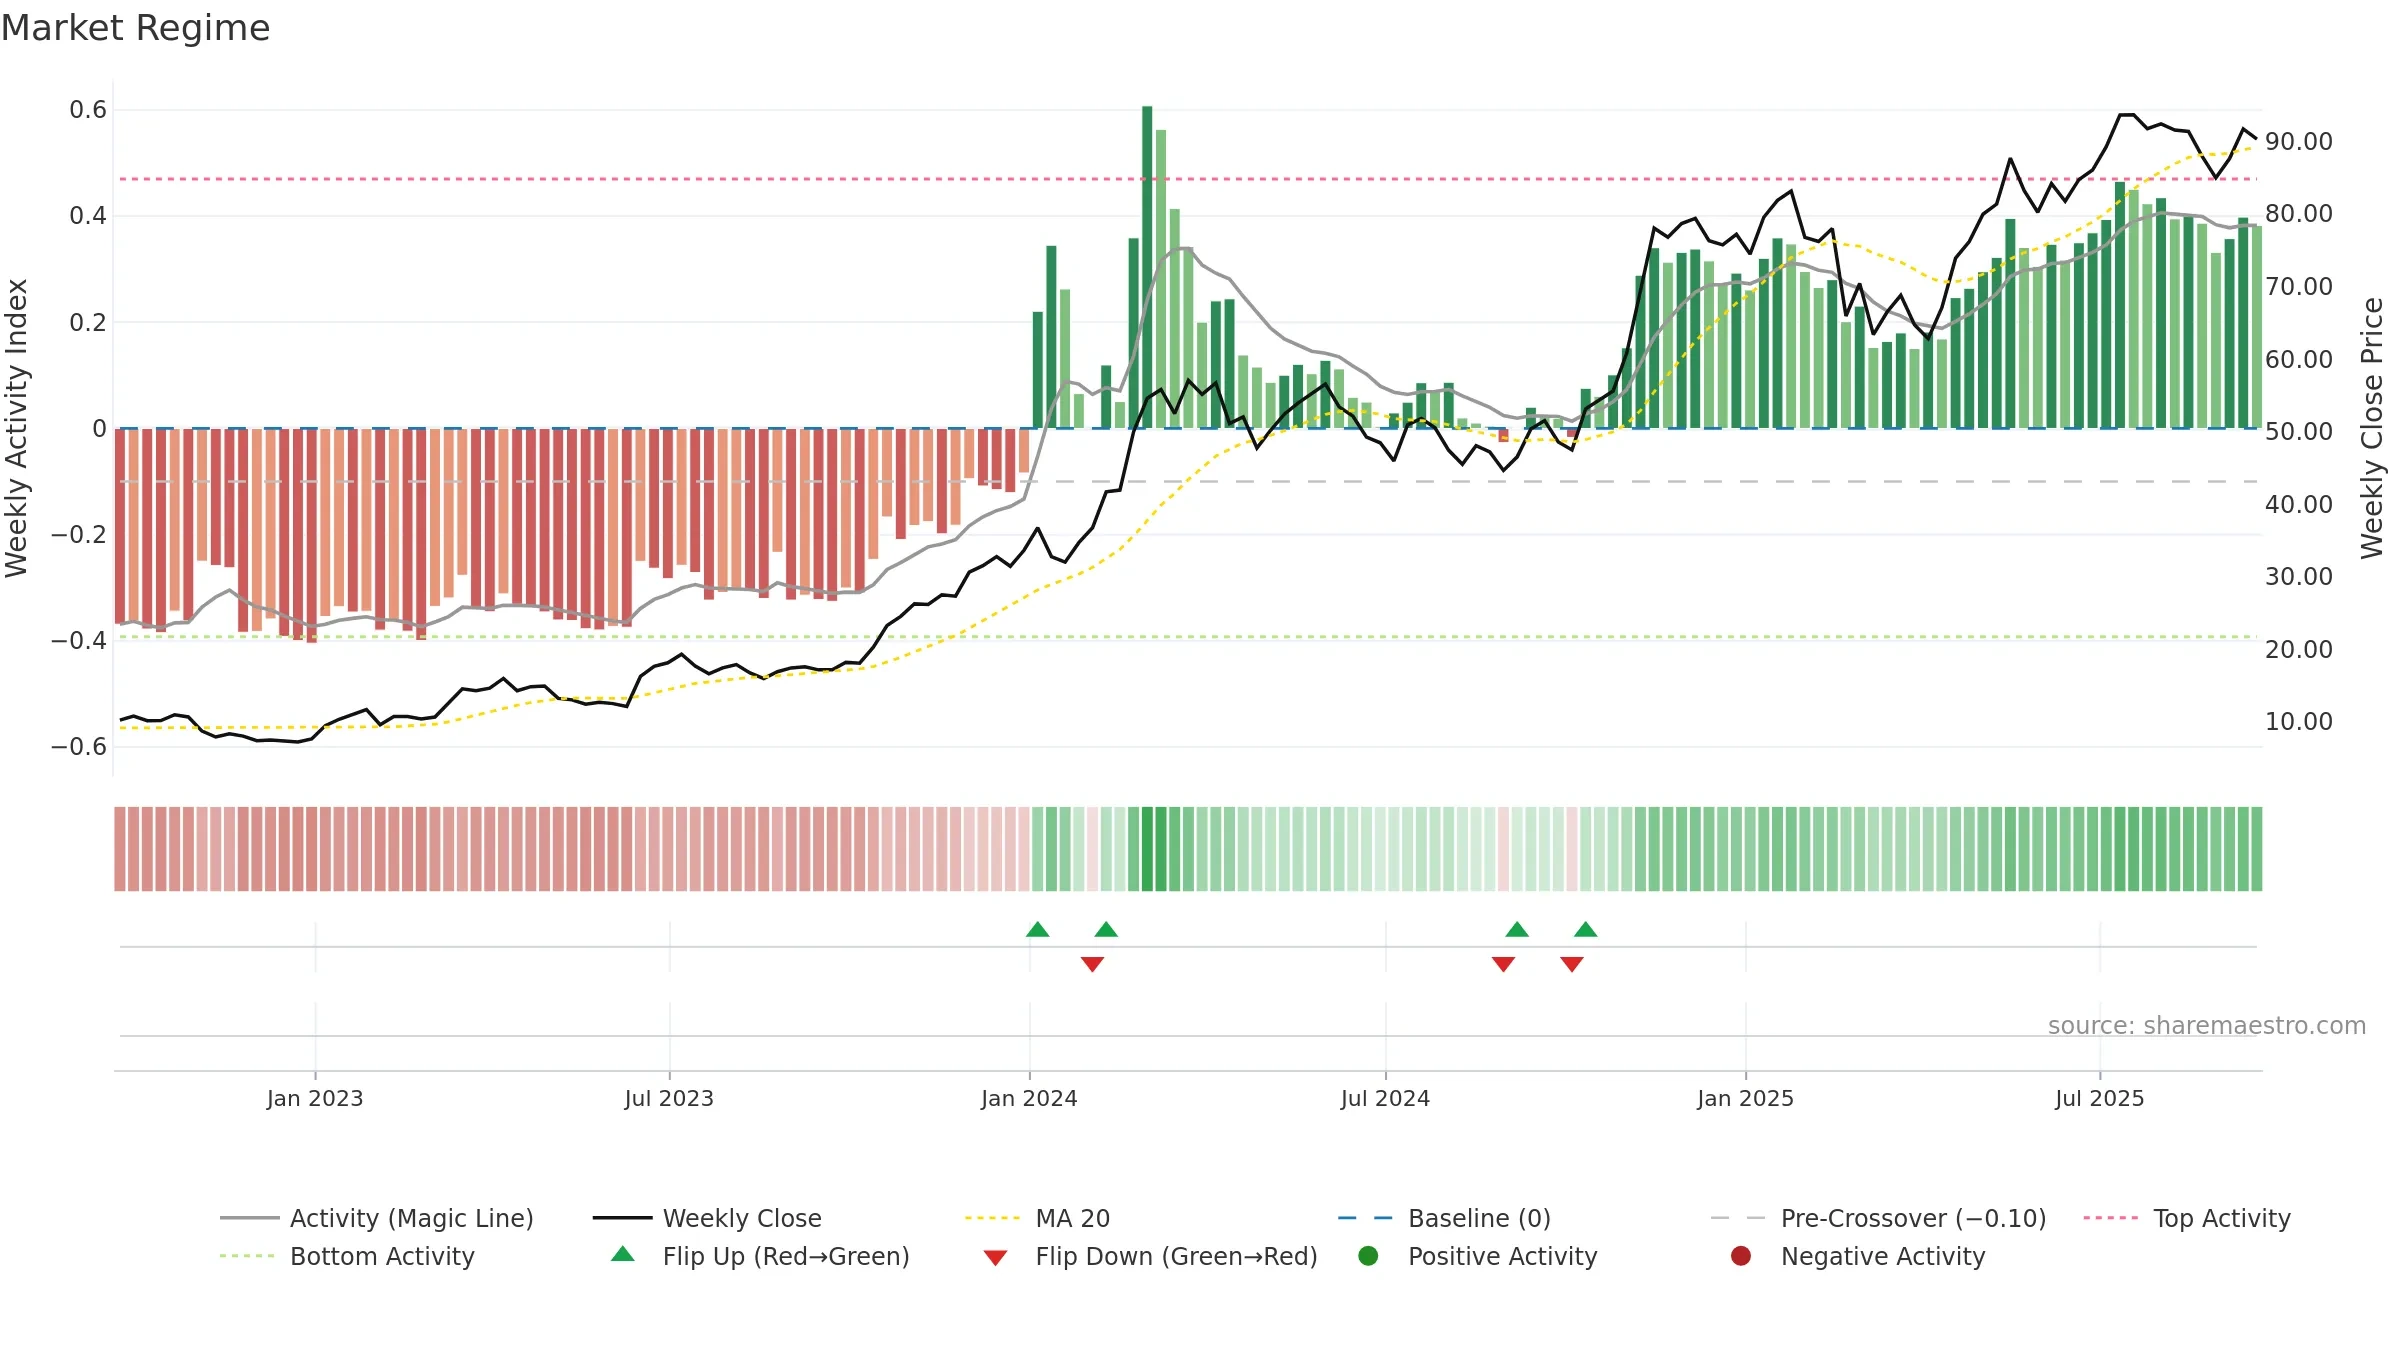
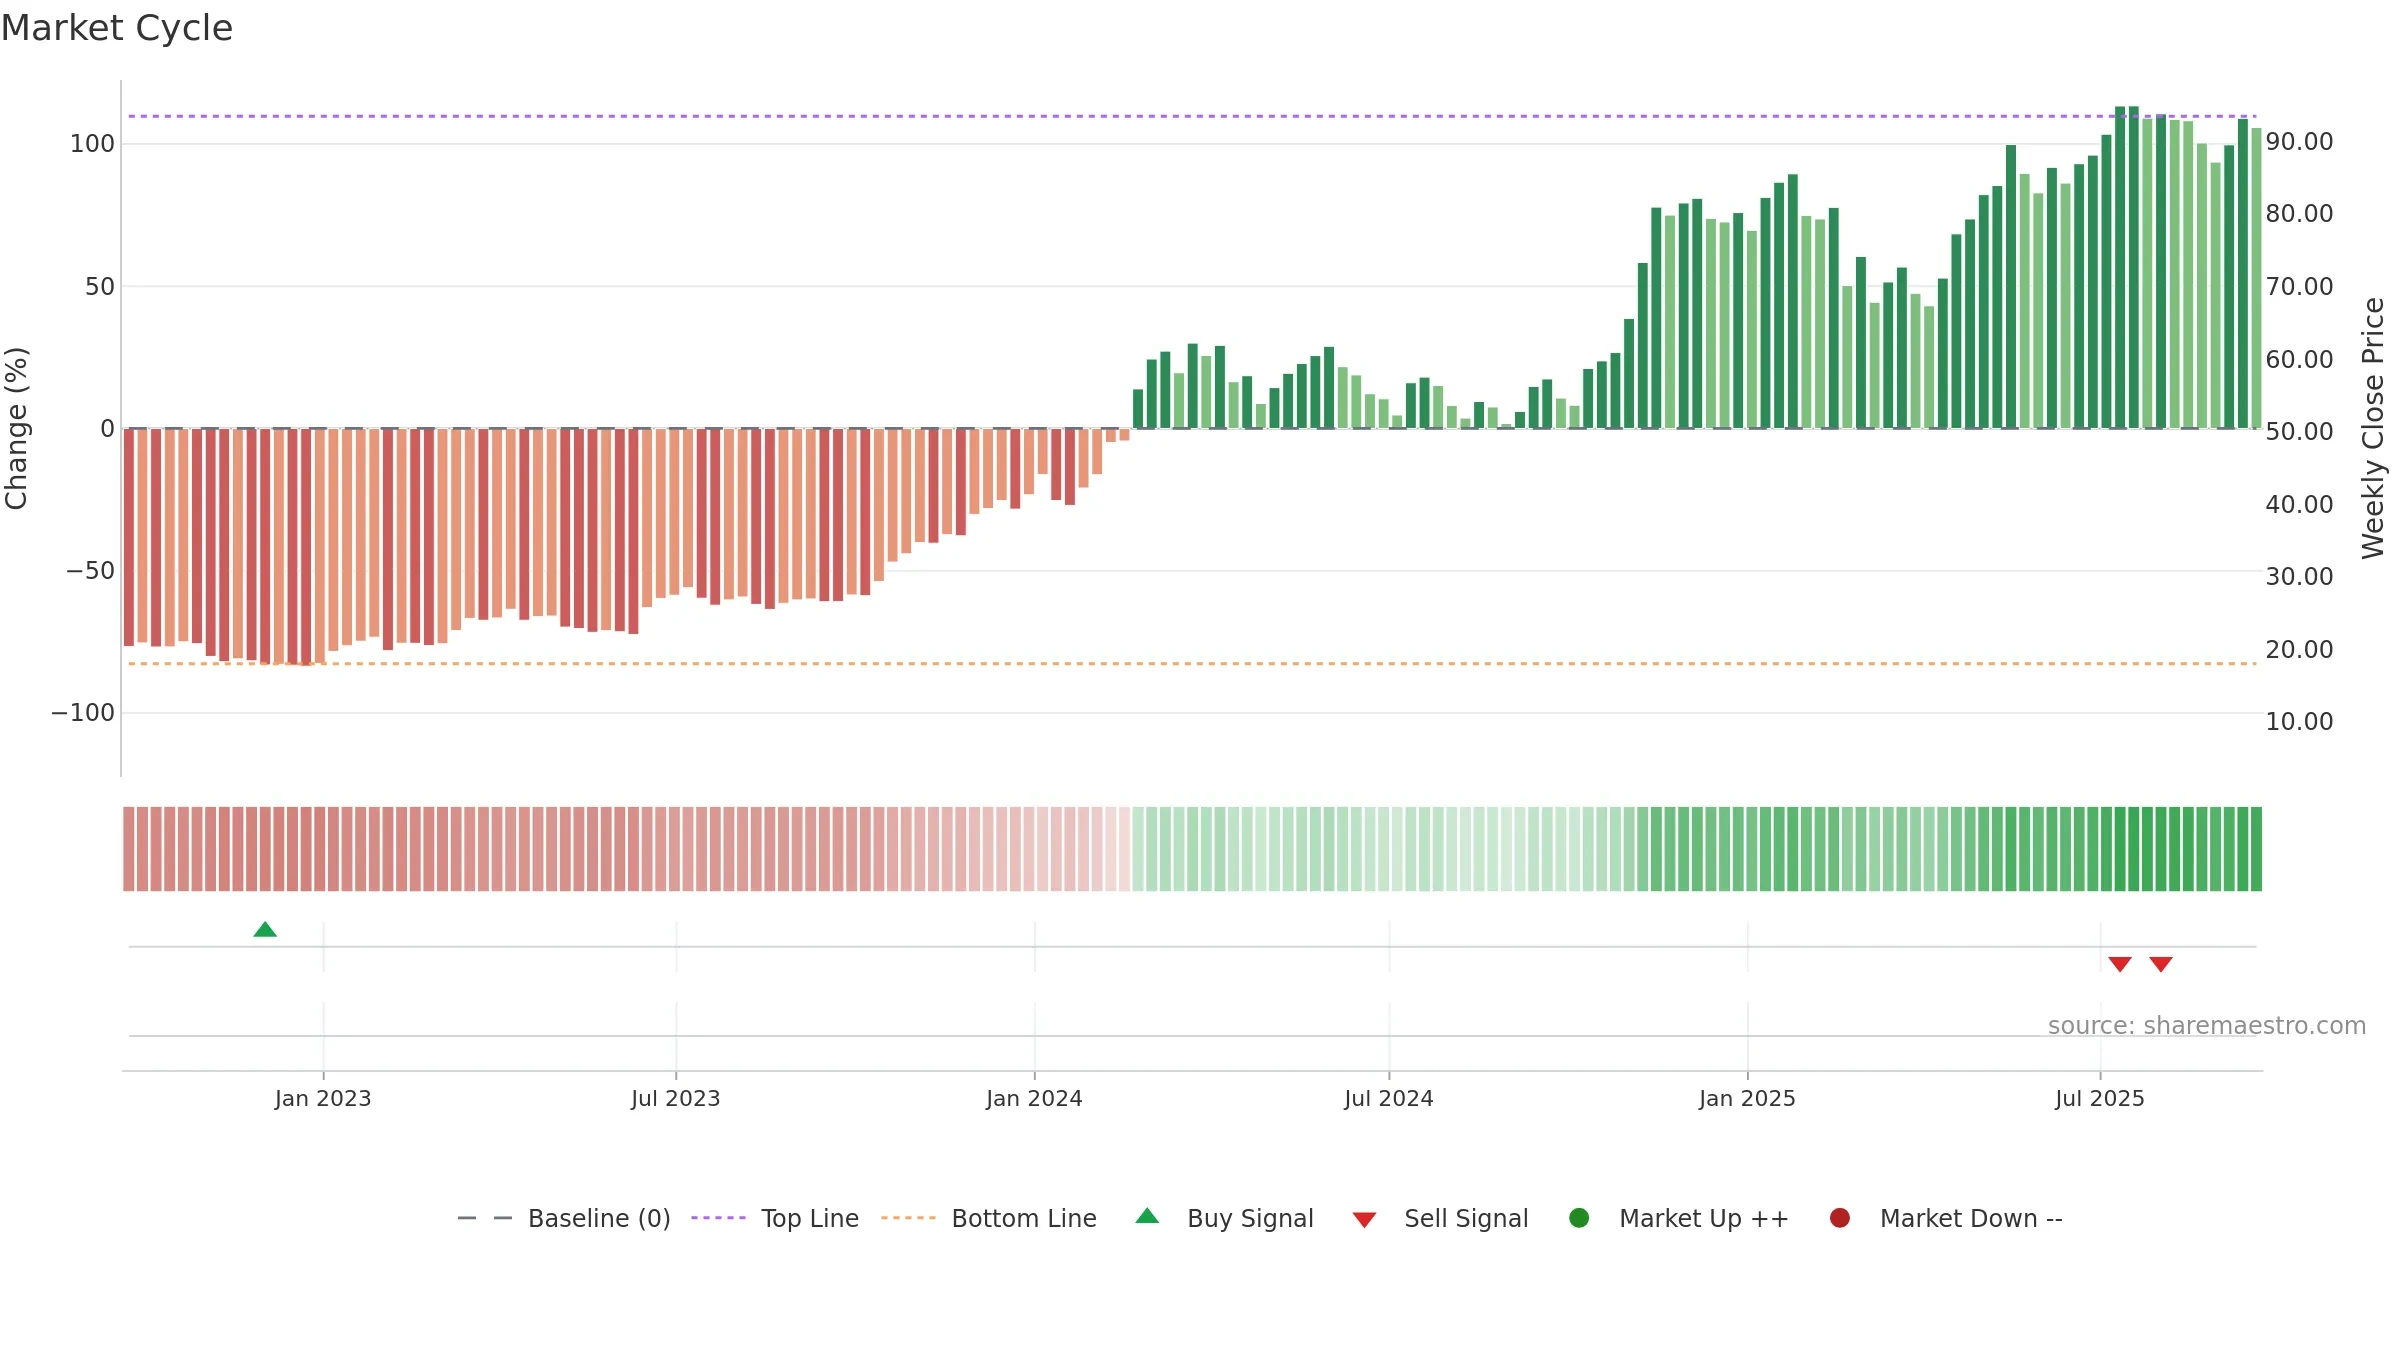
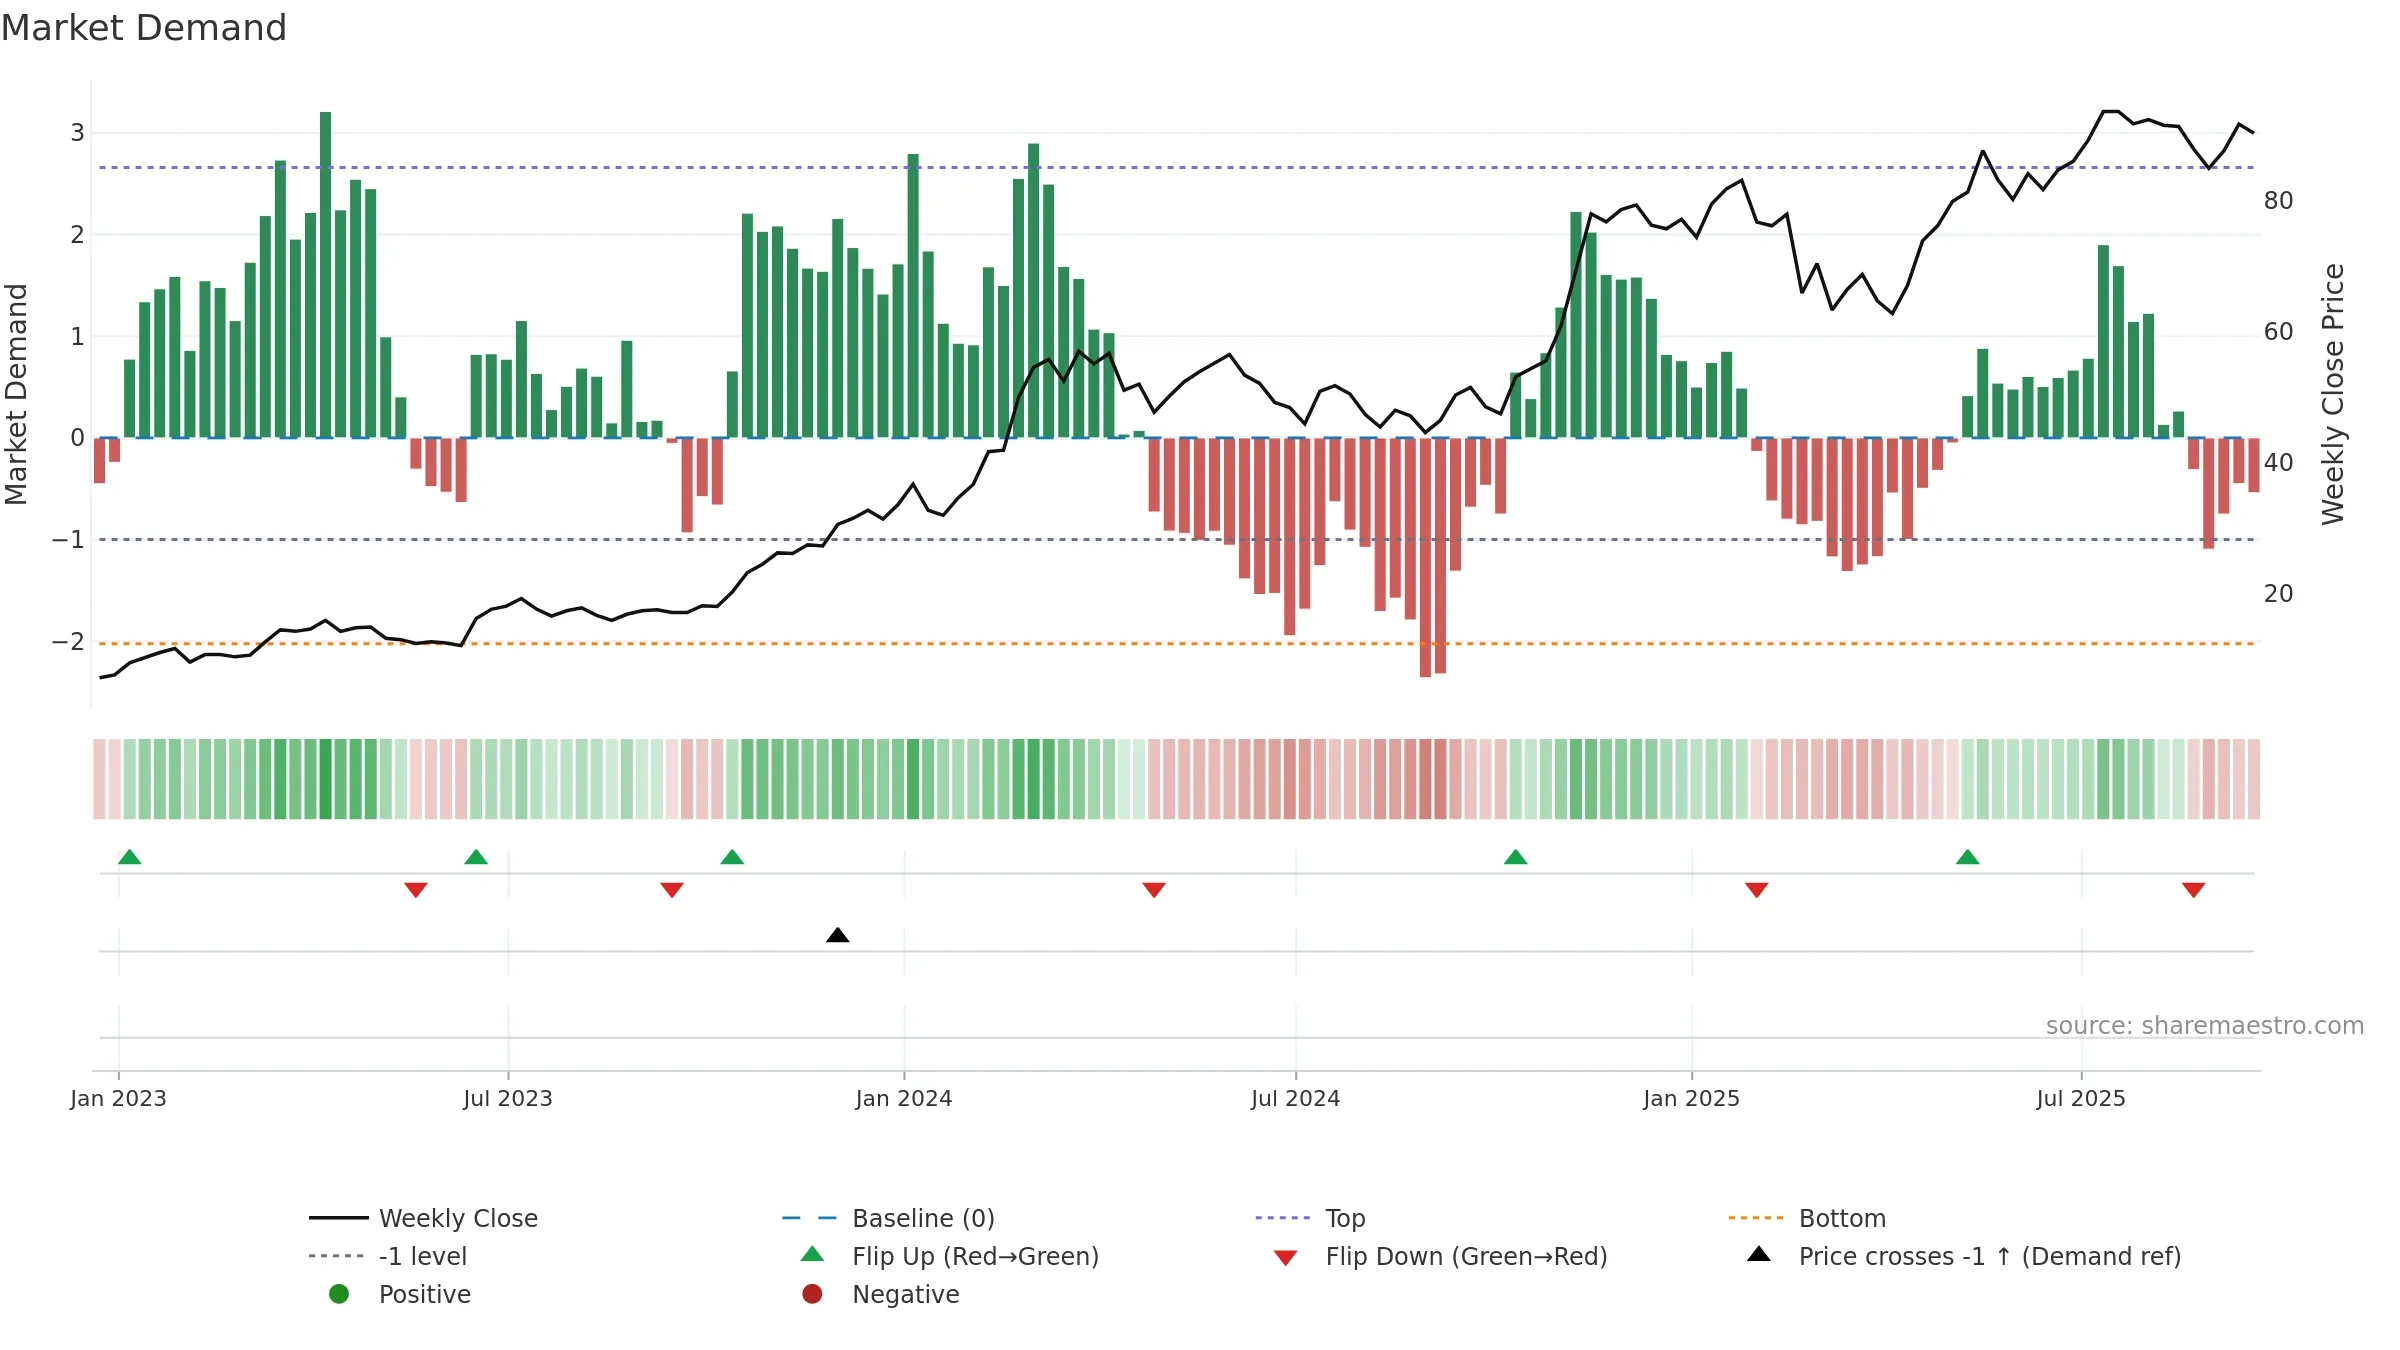
How to read this — Price slope is downward, indicating persistent supply pressure. Low weekly volatility favours steadier follow-through. Volume and price are moving in the same direction — a constructive confirmation. Returns are positively correlated with volume — strength tends to arrive on higher activity. Accumulation weeks: 0; distribution weeks: 2. Distance to baseline is narrowing — reverting closer to its fair-value track. Price holds above key averages, indicating constructive participation.

What this means for you

Down-slope argues for patience; rallies can fade sooner unless participation improves.

Trend
Sharemaestro Trend Line

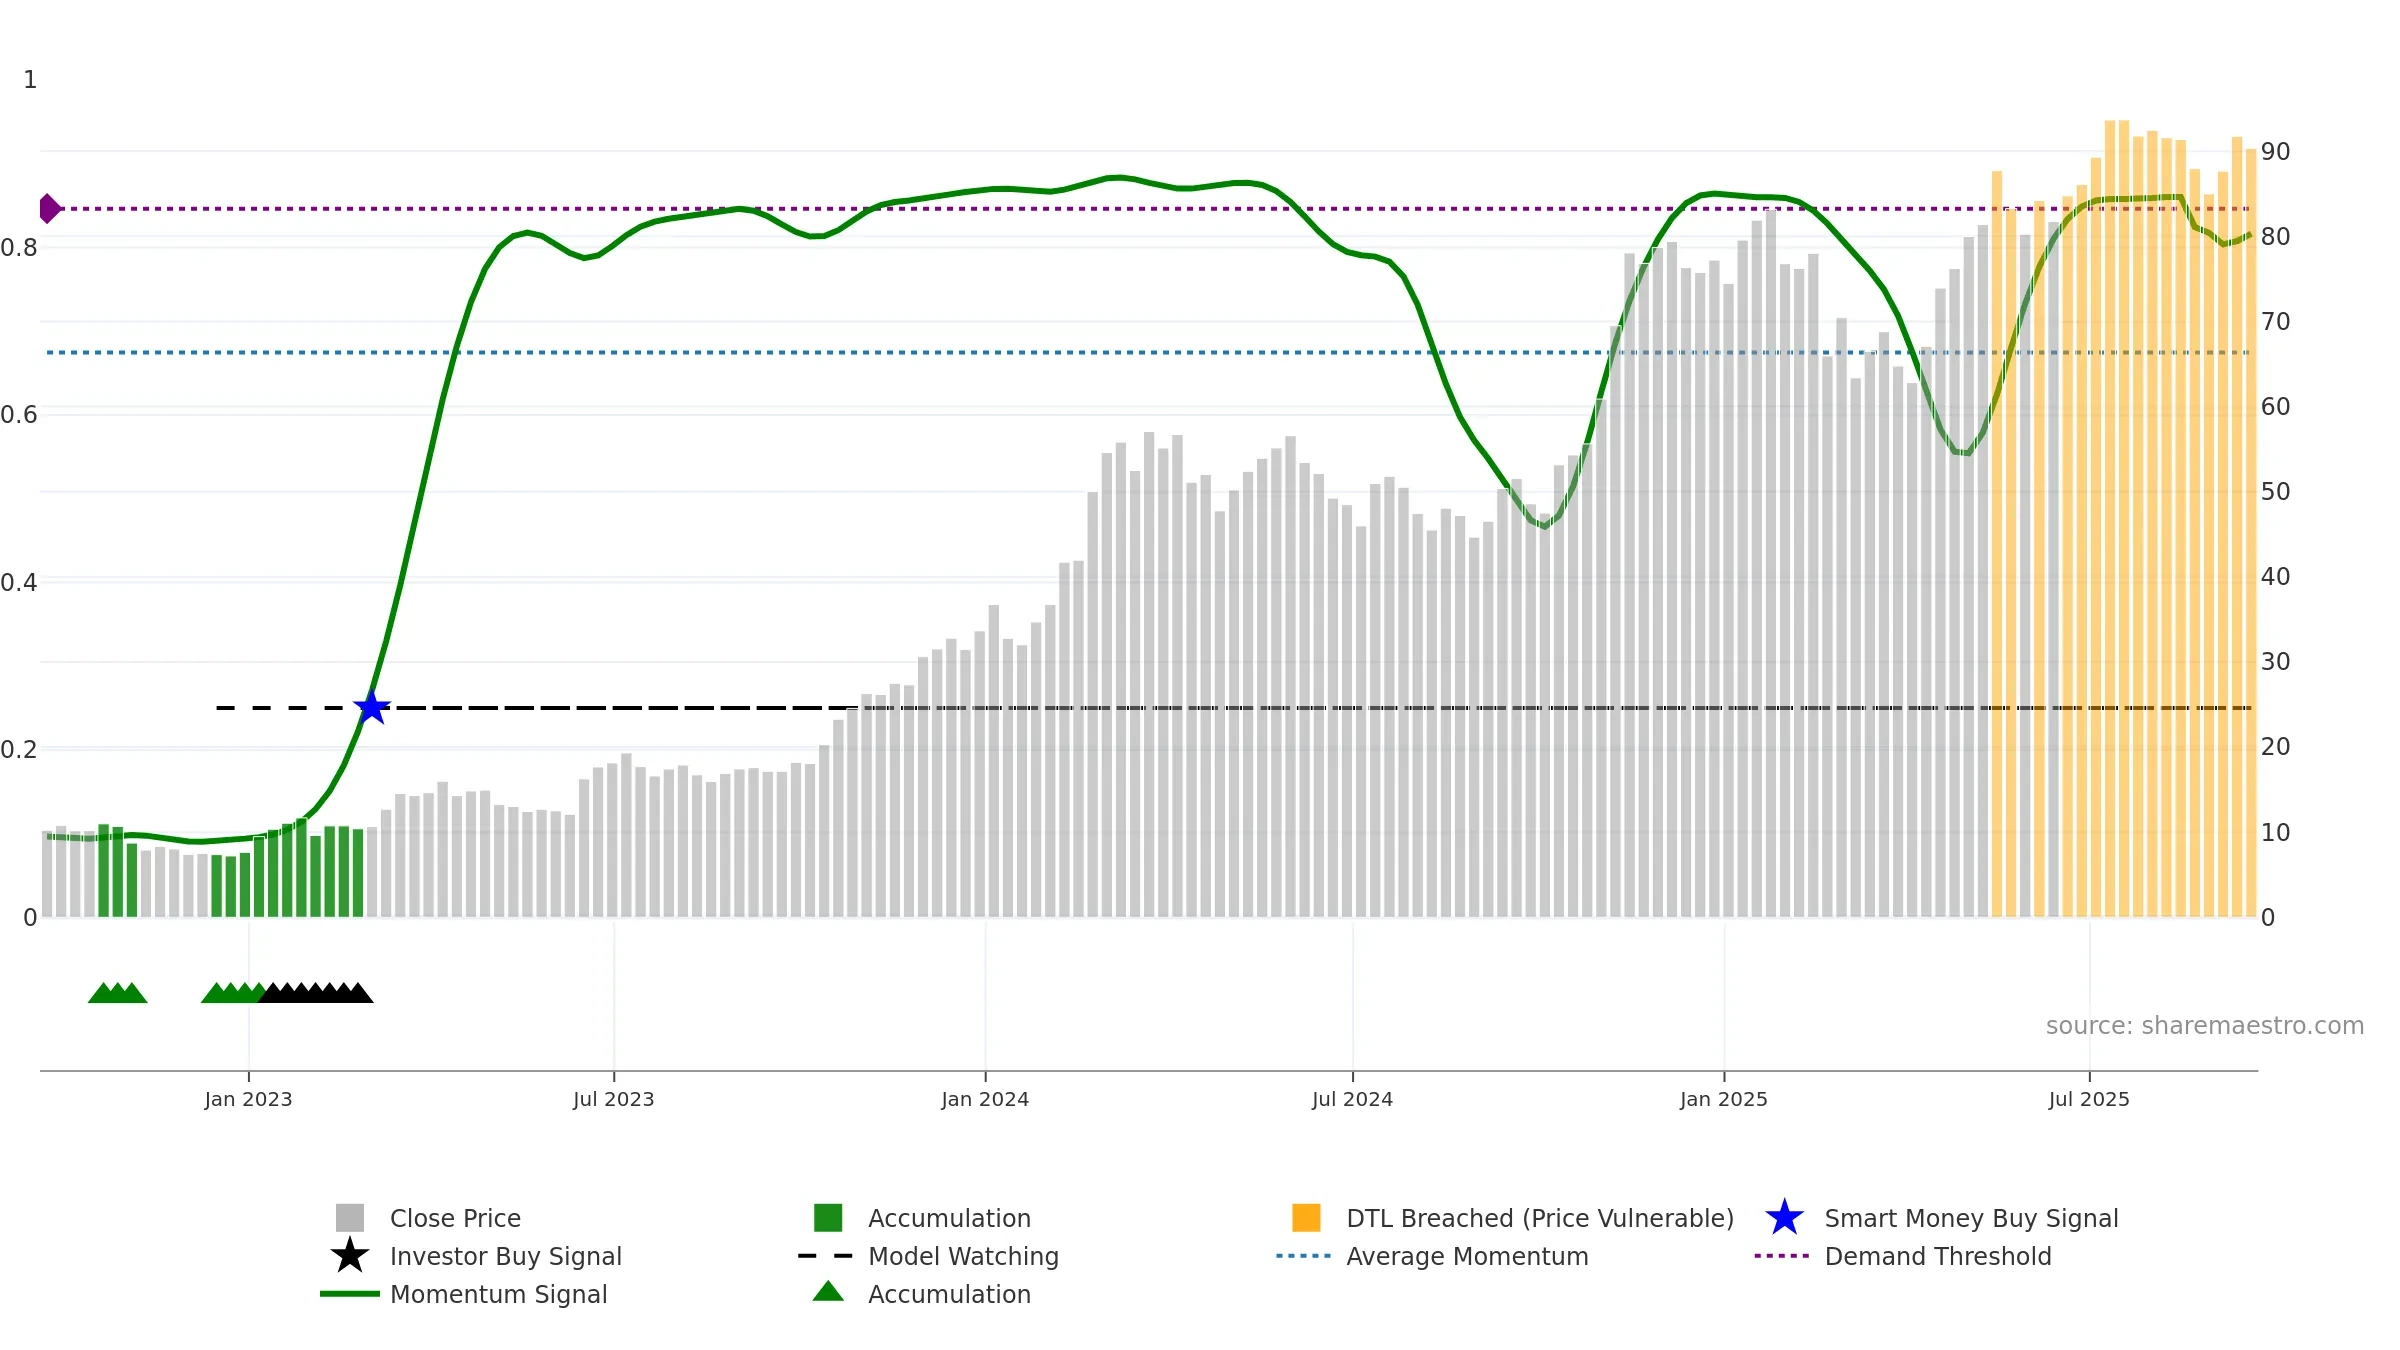
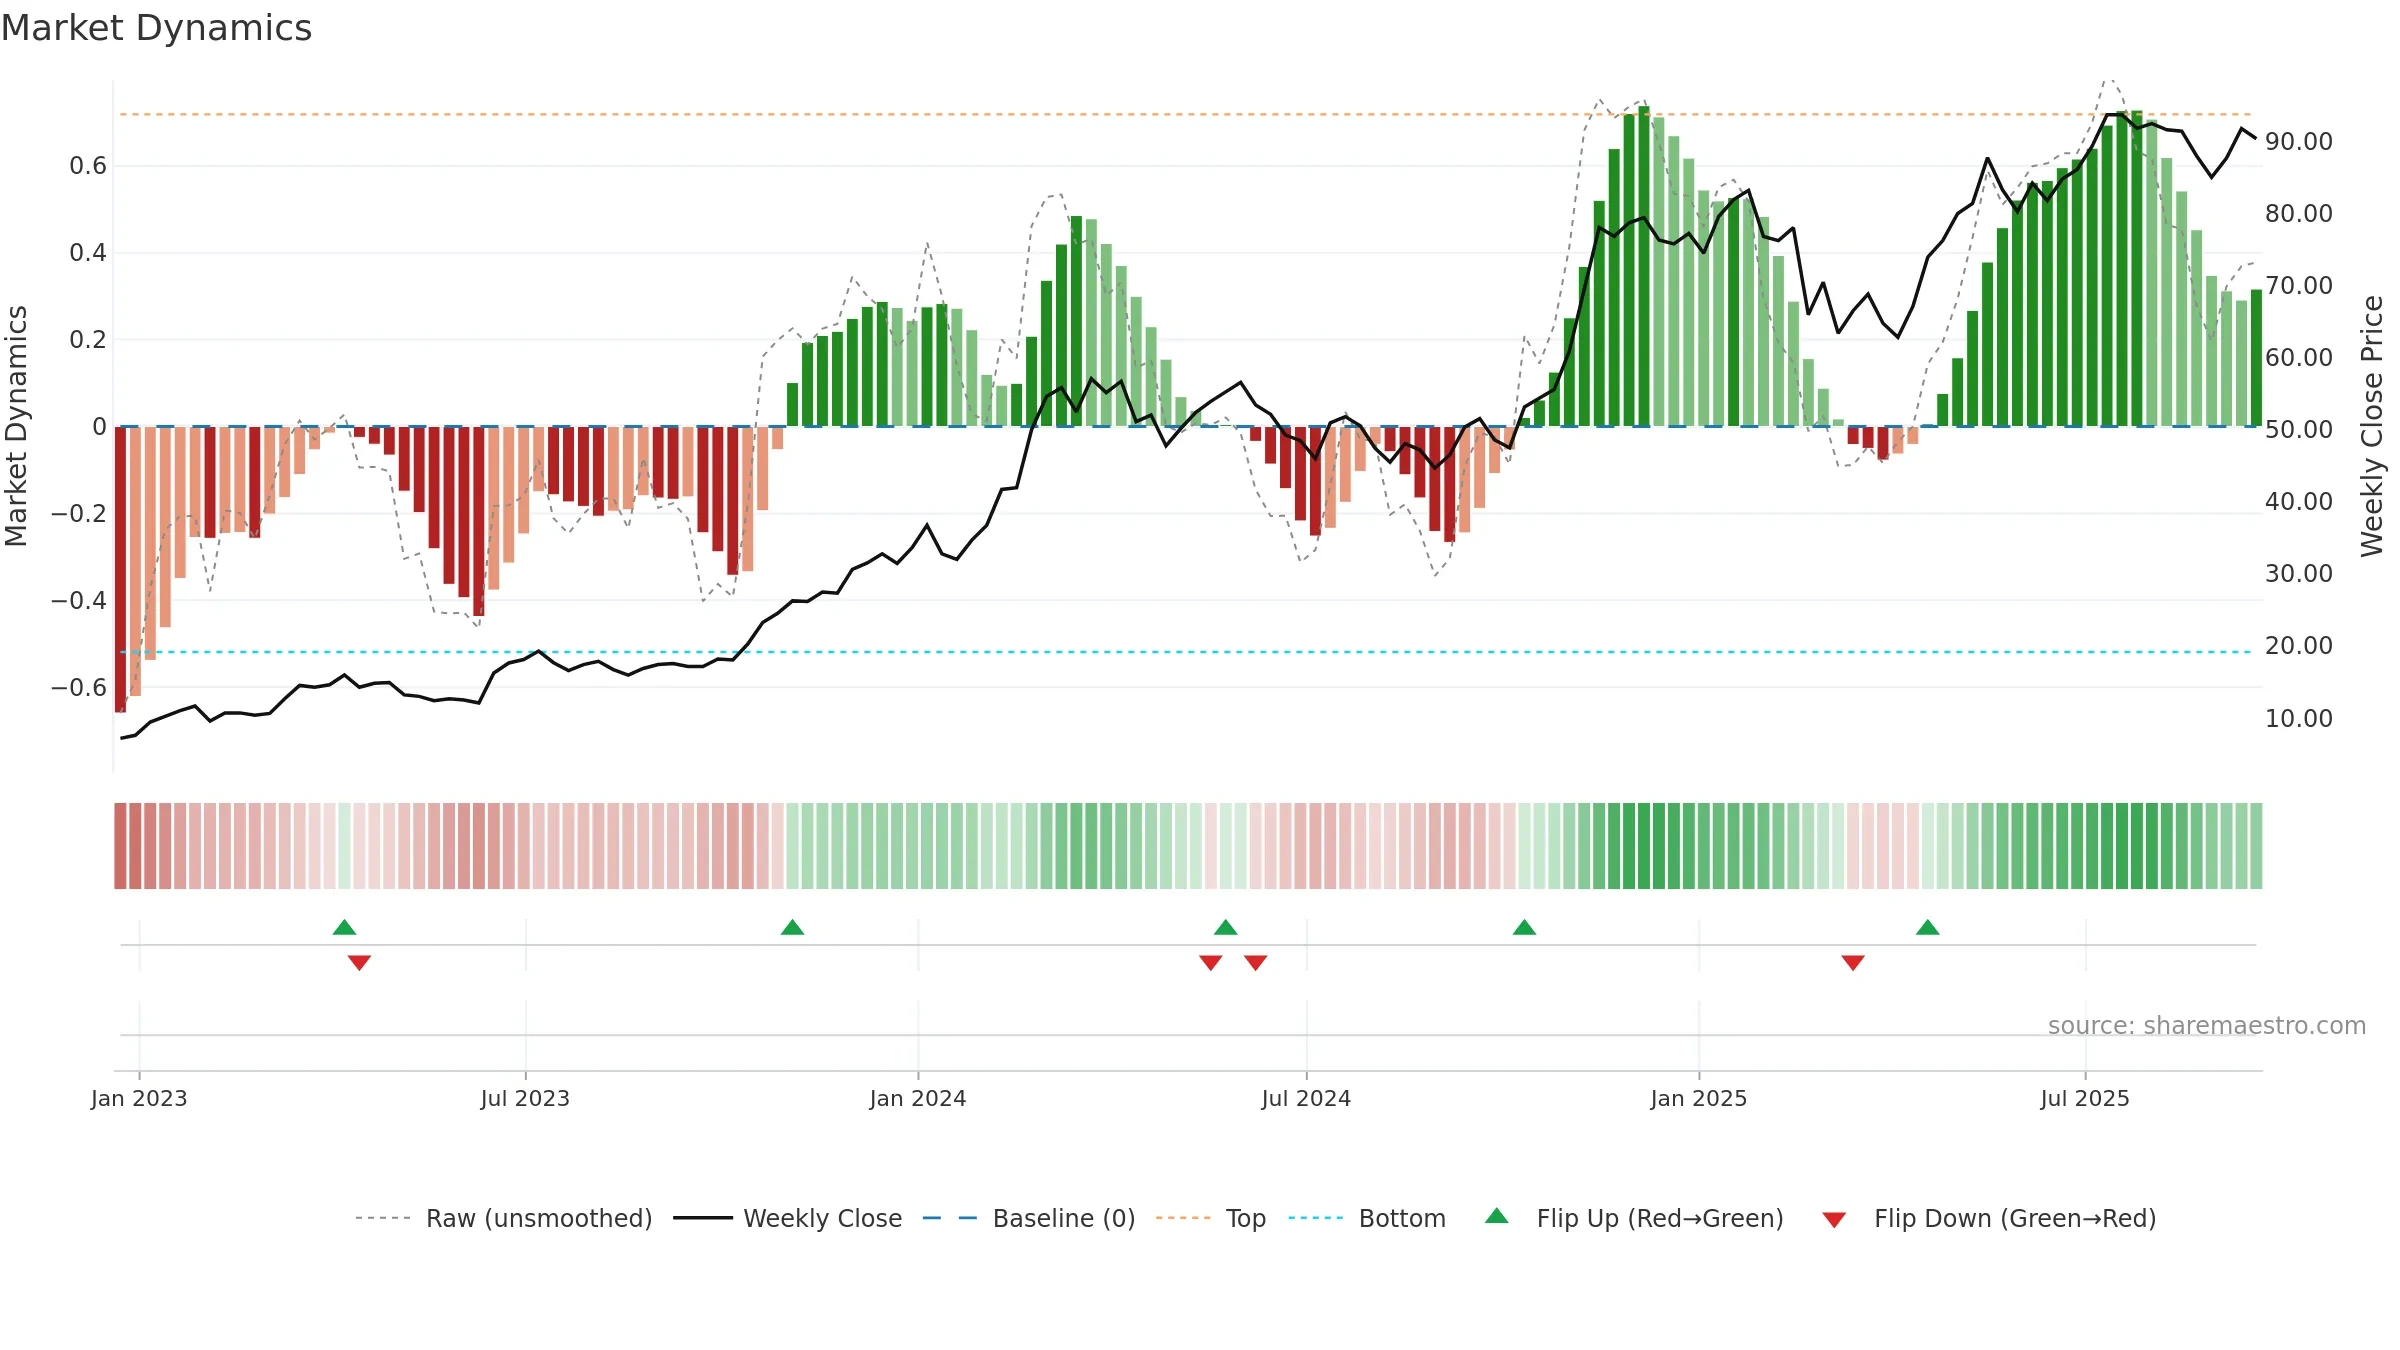
Gauge maps the trend signal to a 0–100 scale.

Gauge Reading81.6/100
DirectionFalling
Accelerationaccelerating
Gauge VolatilityLow
Zone LabelBullish
Bullish Weeks8
Neutral Weeks0
Bearish Weeks0
Interpretation

How to read this — Bullish gauge levels imply persistent upside pressure. A falling gauge warns of momentum fatigue. Acceleration increases the odds of follow-through from week to week.

What this means for you

Constructive backdrop; dips are more likely to find support while the gauge stays high and rising.
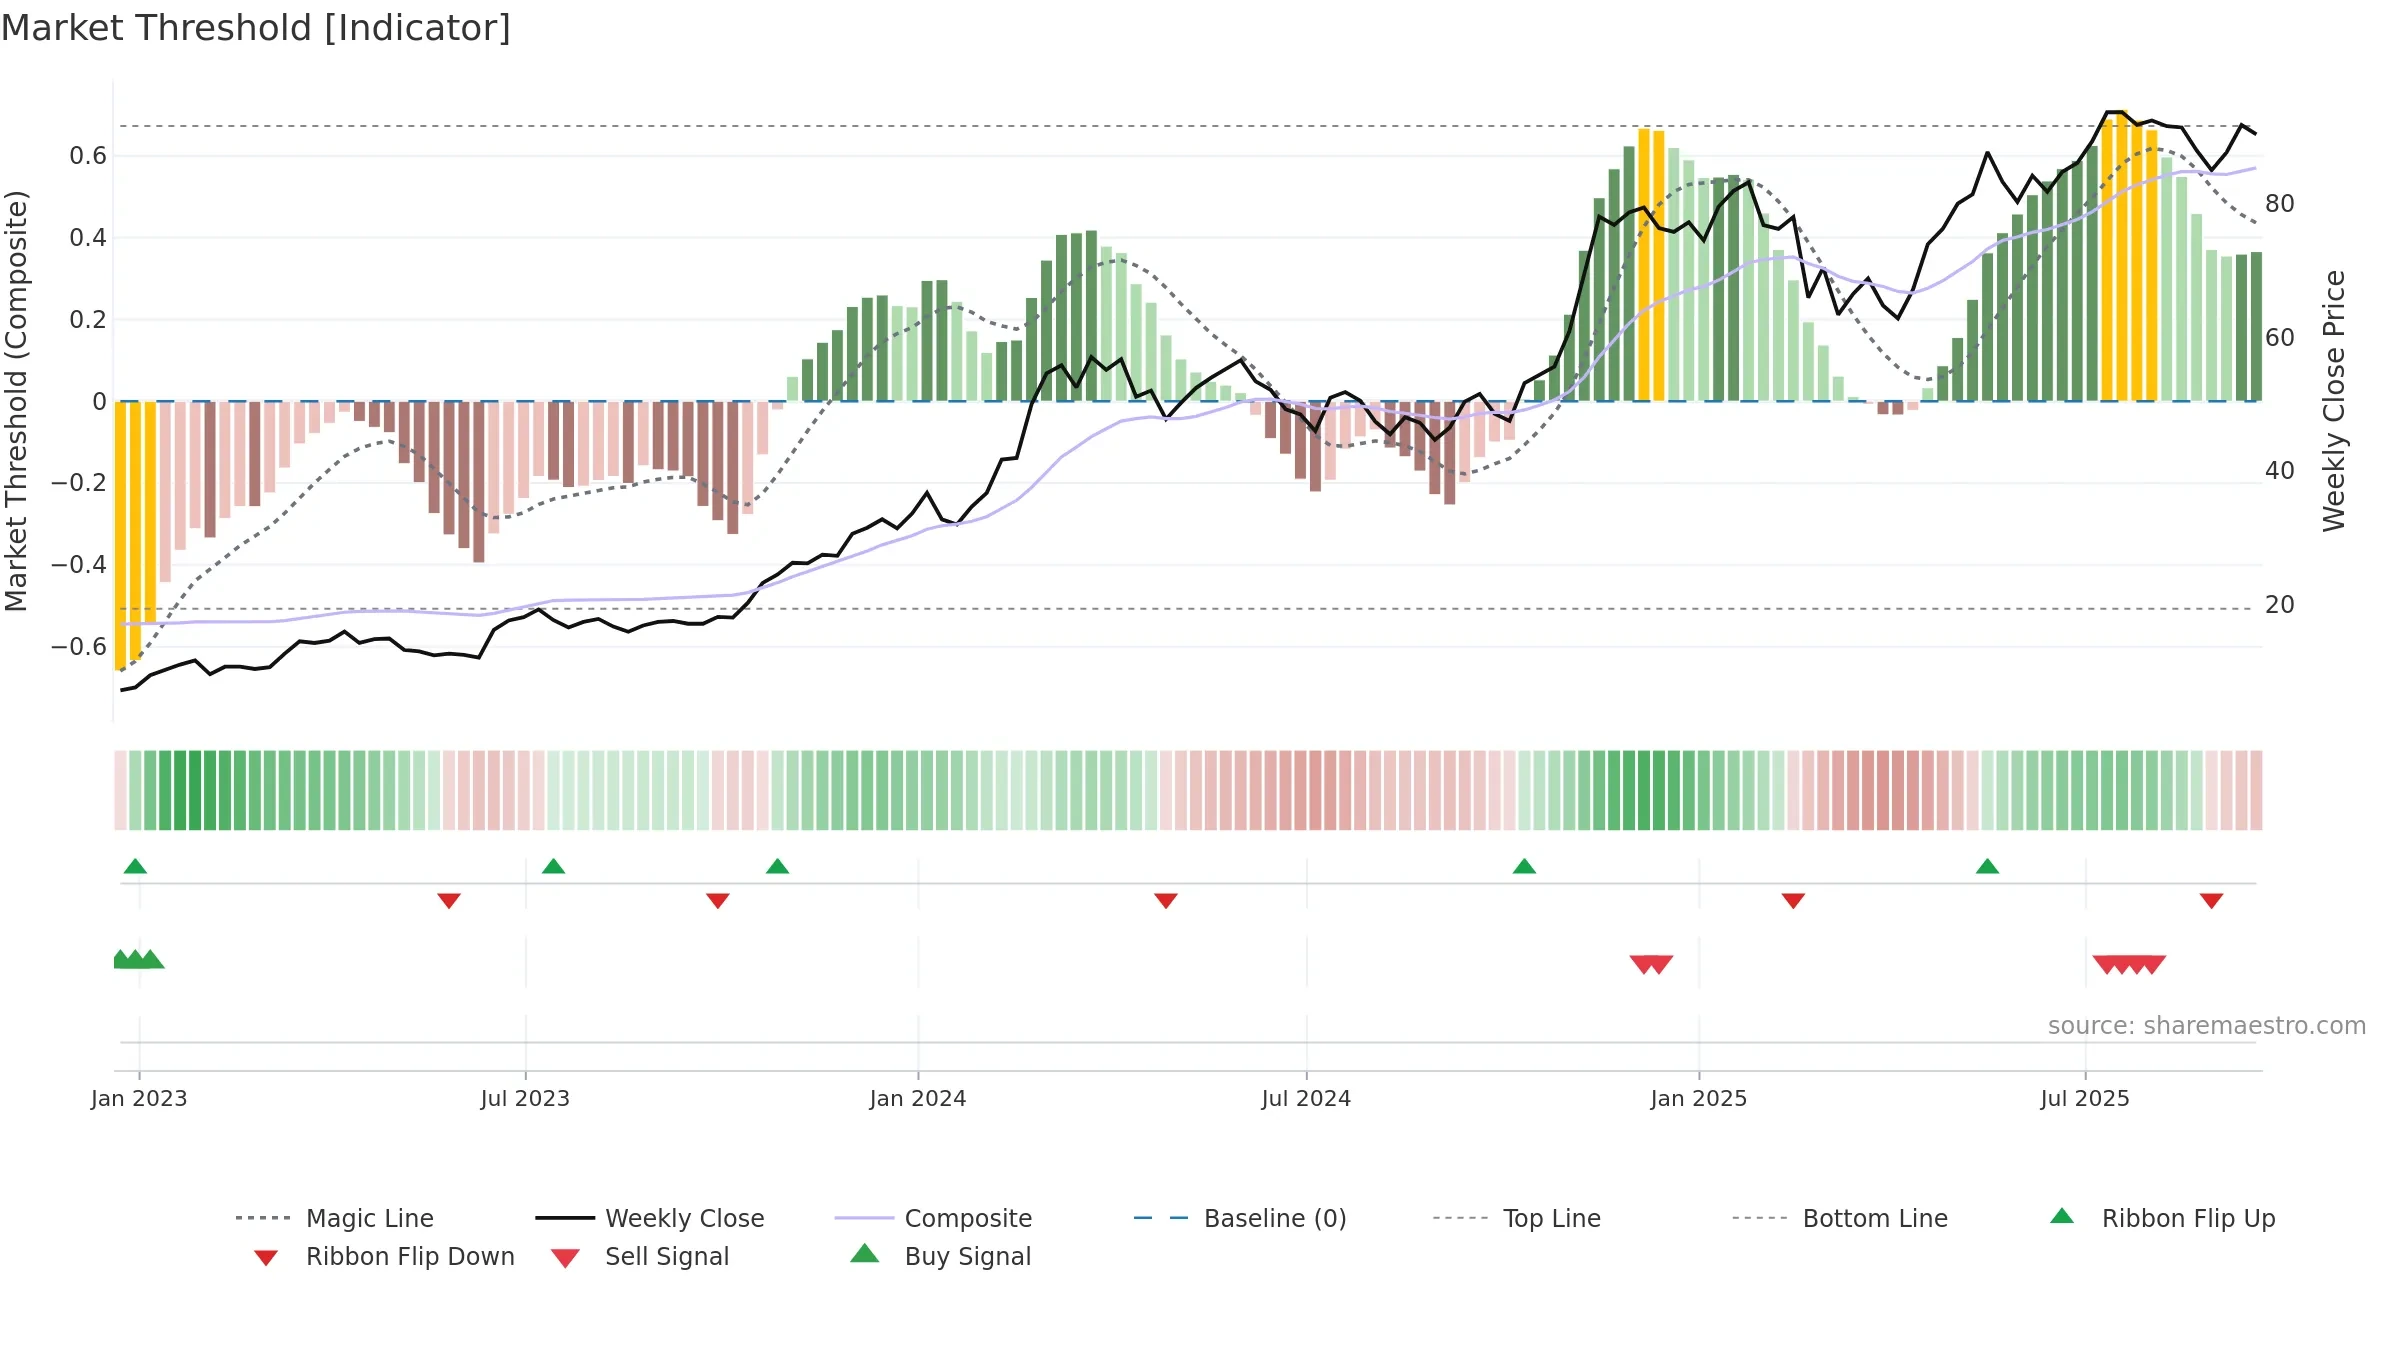
Conclusion

Neutral ★★★☆☆

Neutral setup. ★★★☆☆ confidence. Price window: -2. Trend: Bullish @ 81. In combination, liquidity confirms the move.

Why: Price window -2.27% over 8w. Close is -2.27% below the window high. Return volatility 1.36%. Volume trend falling. Liquidity convergence with price. Accumulation 0; distribution 2. MA stack mixed. Baseline deviation 1.04% (narrowing). Momentum bullish and falling. Acceleration accelerating. Gauge volatility low.

Price Window Endpoint return over the last N weeks using weekly closes: (Closelast − Closefirst)/Closefirst × 100.
Return Volatility Std-dev of weekly returns (%). Higher = choppier.
Volume Trend Slope of weekly volume across the window (rising / falling / flat).
Vs N-week High % distance of latest close from the highest close in the window.
Accumulation Weeks Weeks price rose on higher volume than the prior week.
Distribution Weeks Weeks price fell on higher volume than the prior week.
MA Stack Relative order of short / intermediate / long MAs. Short > long is constructive.
4–8 Crossover Latest cross of 4-week vs 8-week MA (bullish / bearish / none).
Price vs MAs Whether the close is above/below key averages (8w & 26w).
Baseline Deviation % distance from the market-cycle baseline (fair-value track).
Gauge Reading Smoothed trend signal mapped to 0–100.
Direction Slope sign of the gauge across the window (rising / falling).
Acceleration Change in the slope of the gauge (accelerating / decelerating).
Gauge Volatility Variability of the gauge (low / normal / high).
Zone Label Classification by level (Bullish / Neutral / Bearish).
Target Price (Flag) If flagged: Positive/Negative stance. Otherwise: numeric fair value.
Composite Score Overall model score (0–10).
Hybrid Efficiency Efficiency of growth × quality (0–10).
Rating Model’s verdict for the snapshot.
Weekly Close Sparkline of the last 52 weekly closing prices.
Trend Line Sparkline of the smoothed trend signal over the last 52 weeks.

Tip: Most metrics also include a hover tooltip where they appear in the report.

Download JSON Download CSV JSON-LD Snapshots: 2025-09-19