Shanghai Holystar Information Technology Co., Ltd.
688330 SHA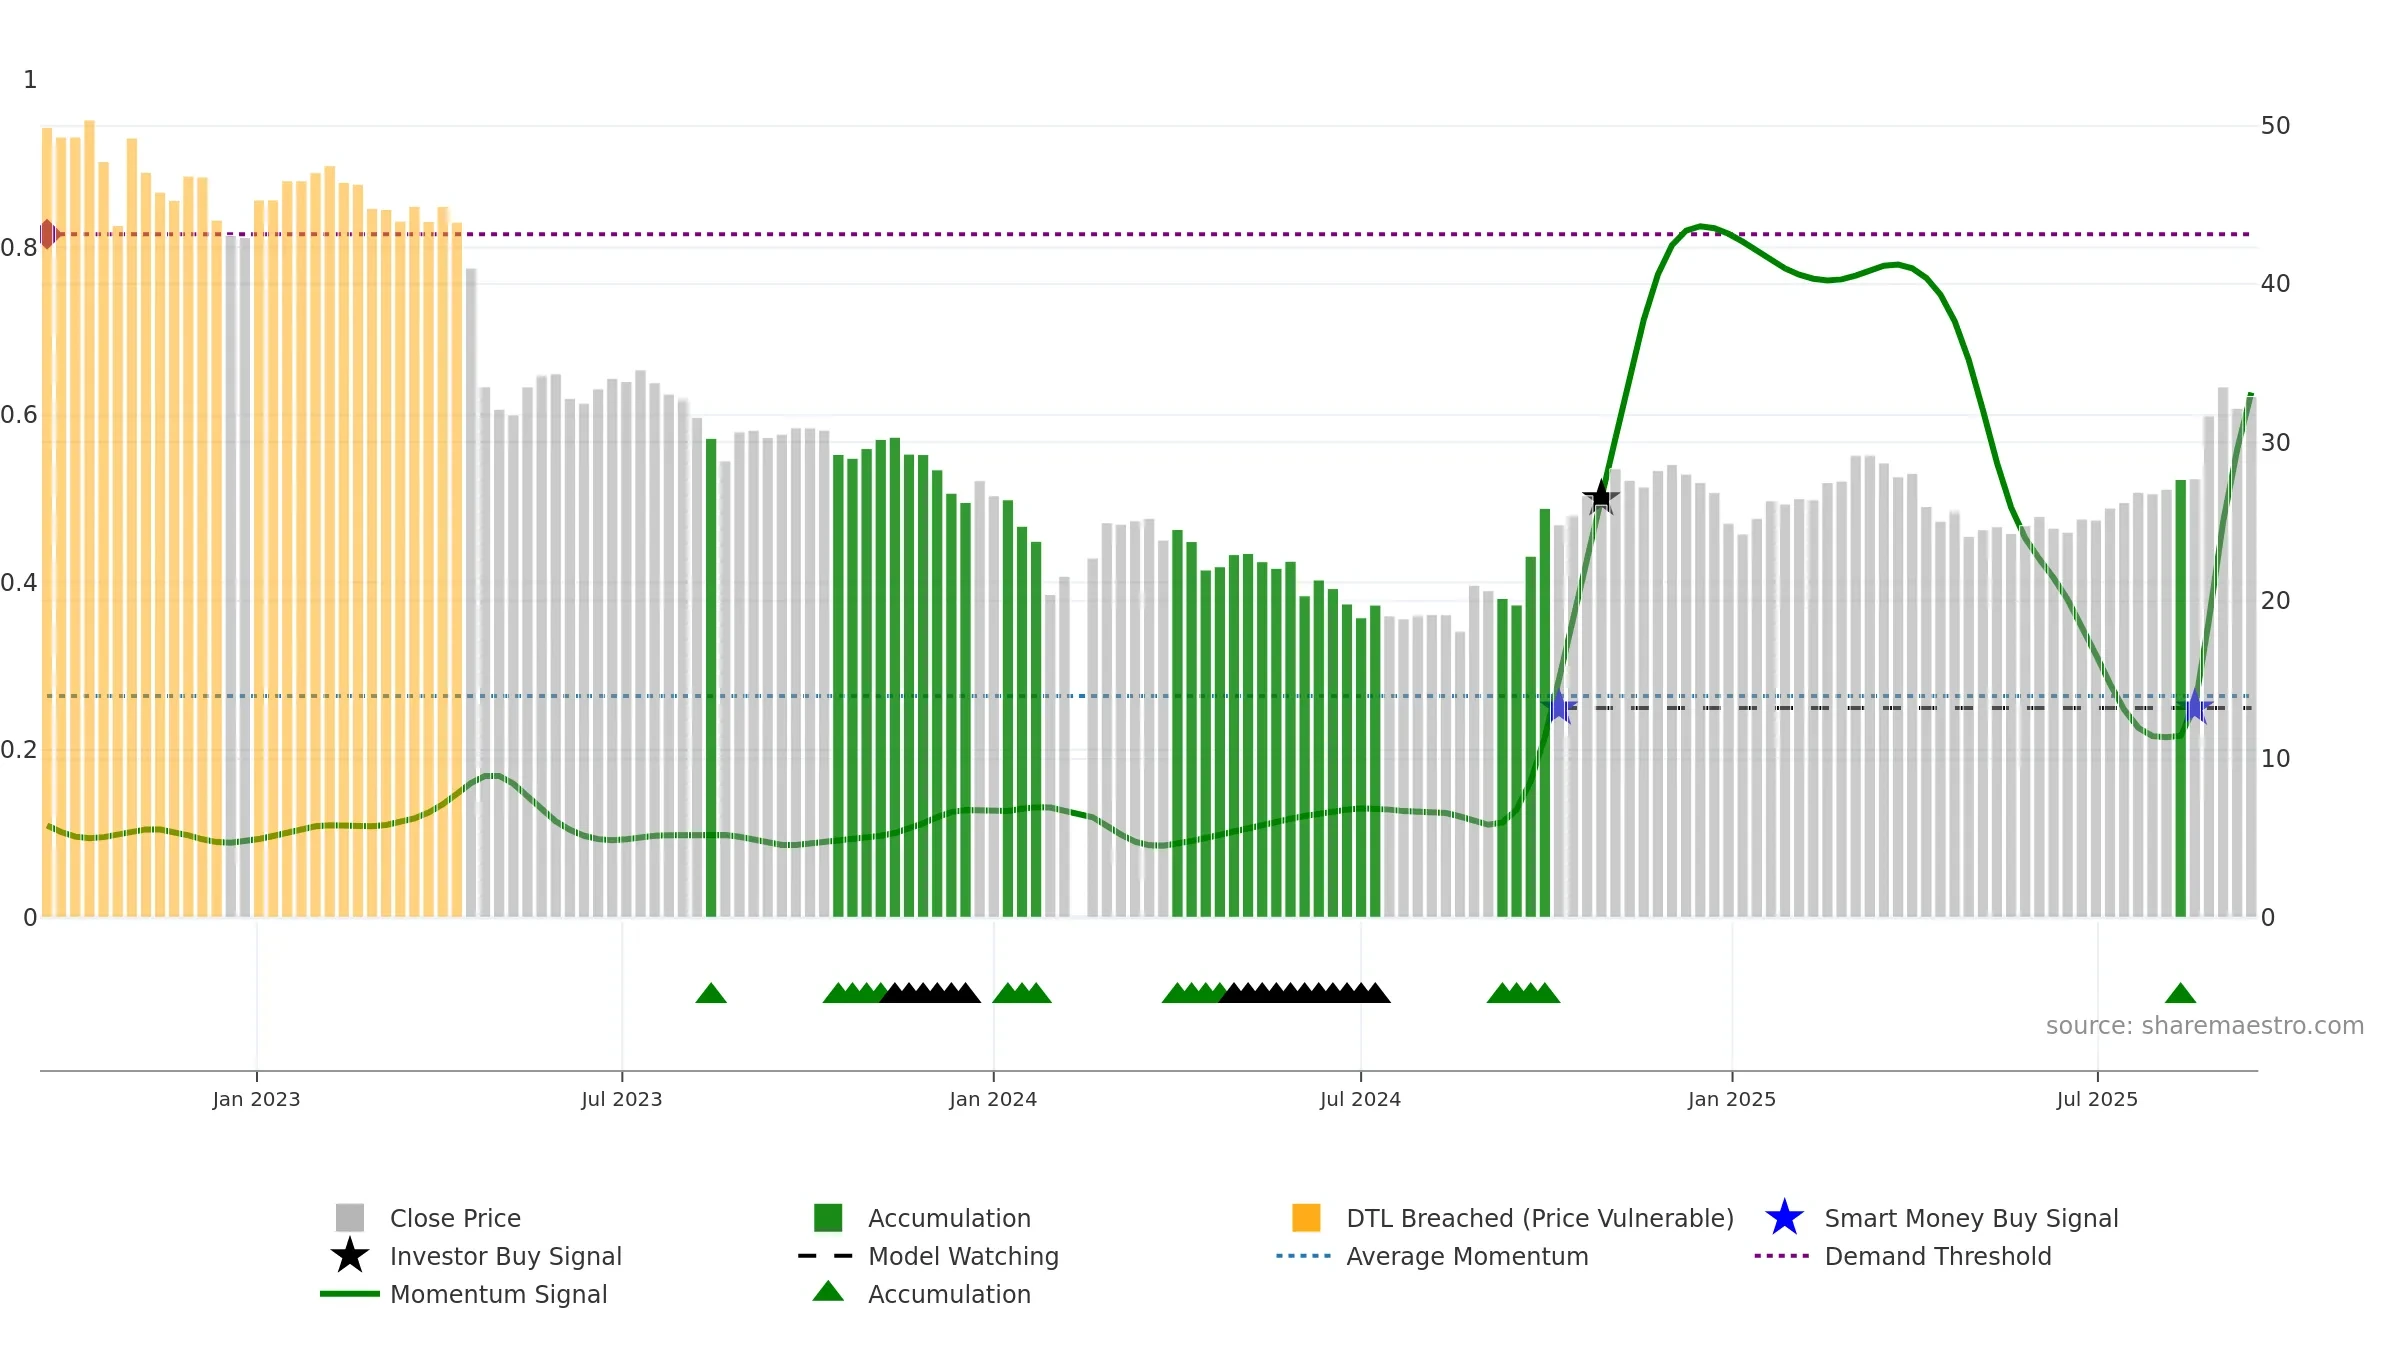
Weekly Report
Shanghai Holystar Information Technology Co., Ltd. closed at 32.8900 (1.89% WoW) . Data window ends Mon, 15 Sep 2025.
How to read this — Price slope is upward, indicating persistent buying over the window. Volume and price are moving in the same direction — a constructive confirmation. Returns are positively correlated with volume — strength tends to arrive on higher activity. Constructive MA stack supports the up-drift; pullbacks may find support at the 8–13 week region. Price holds above key averages, indicating constructive participation.
Up-slope supports buying interest; pullbacks may be contained if activity stays firm.
Gauge maps the trend signal to a 0–100 scale.
How to read this — High gauge and rising momentum — buyers in control.
Bias remains higher; pullbacks could be buyable if participation holds.
The flag is positive: favourable upside skew with supportive conditions.
Conclusion
Positive setup. ★★★★☆ confidence. Price window: 22. Trend: Strong Uptrend; gauge 62. In combination, liquidity confirms the move.
- High gauge with rising momentum (strong uptrend)
- Momentum is bullish and rising
- Price holds above 8w & 26w averages
- Constructive moving-average stack
Why: Price window 22.95% over 8w. Close is -1.82% below the prior-window high. Volume trend rising. Liquidity convergence with price. Trend state strong uptrend. Low-regime (≤0.25) upticks 2/3 (67.0%) • Accumulating. MA stack constructive. Momentum bullish and rising. Valuation stance positive.
Tip: Most metrics include a hover tooltip where they appear in the report.