ChipMOS TECHNOLOGIES INC.
IMOS NASDAQ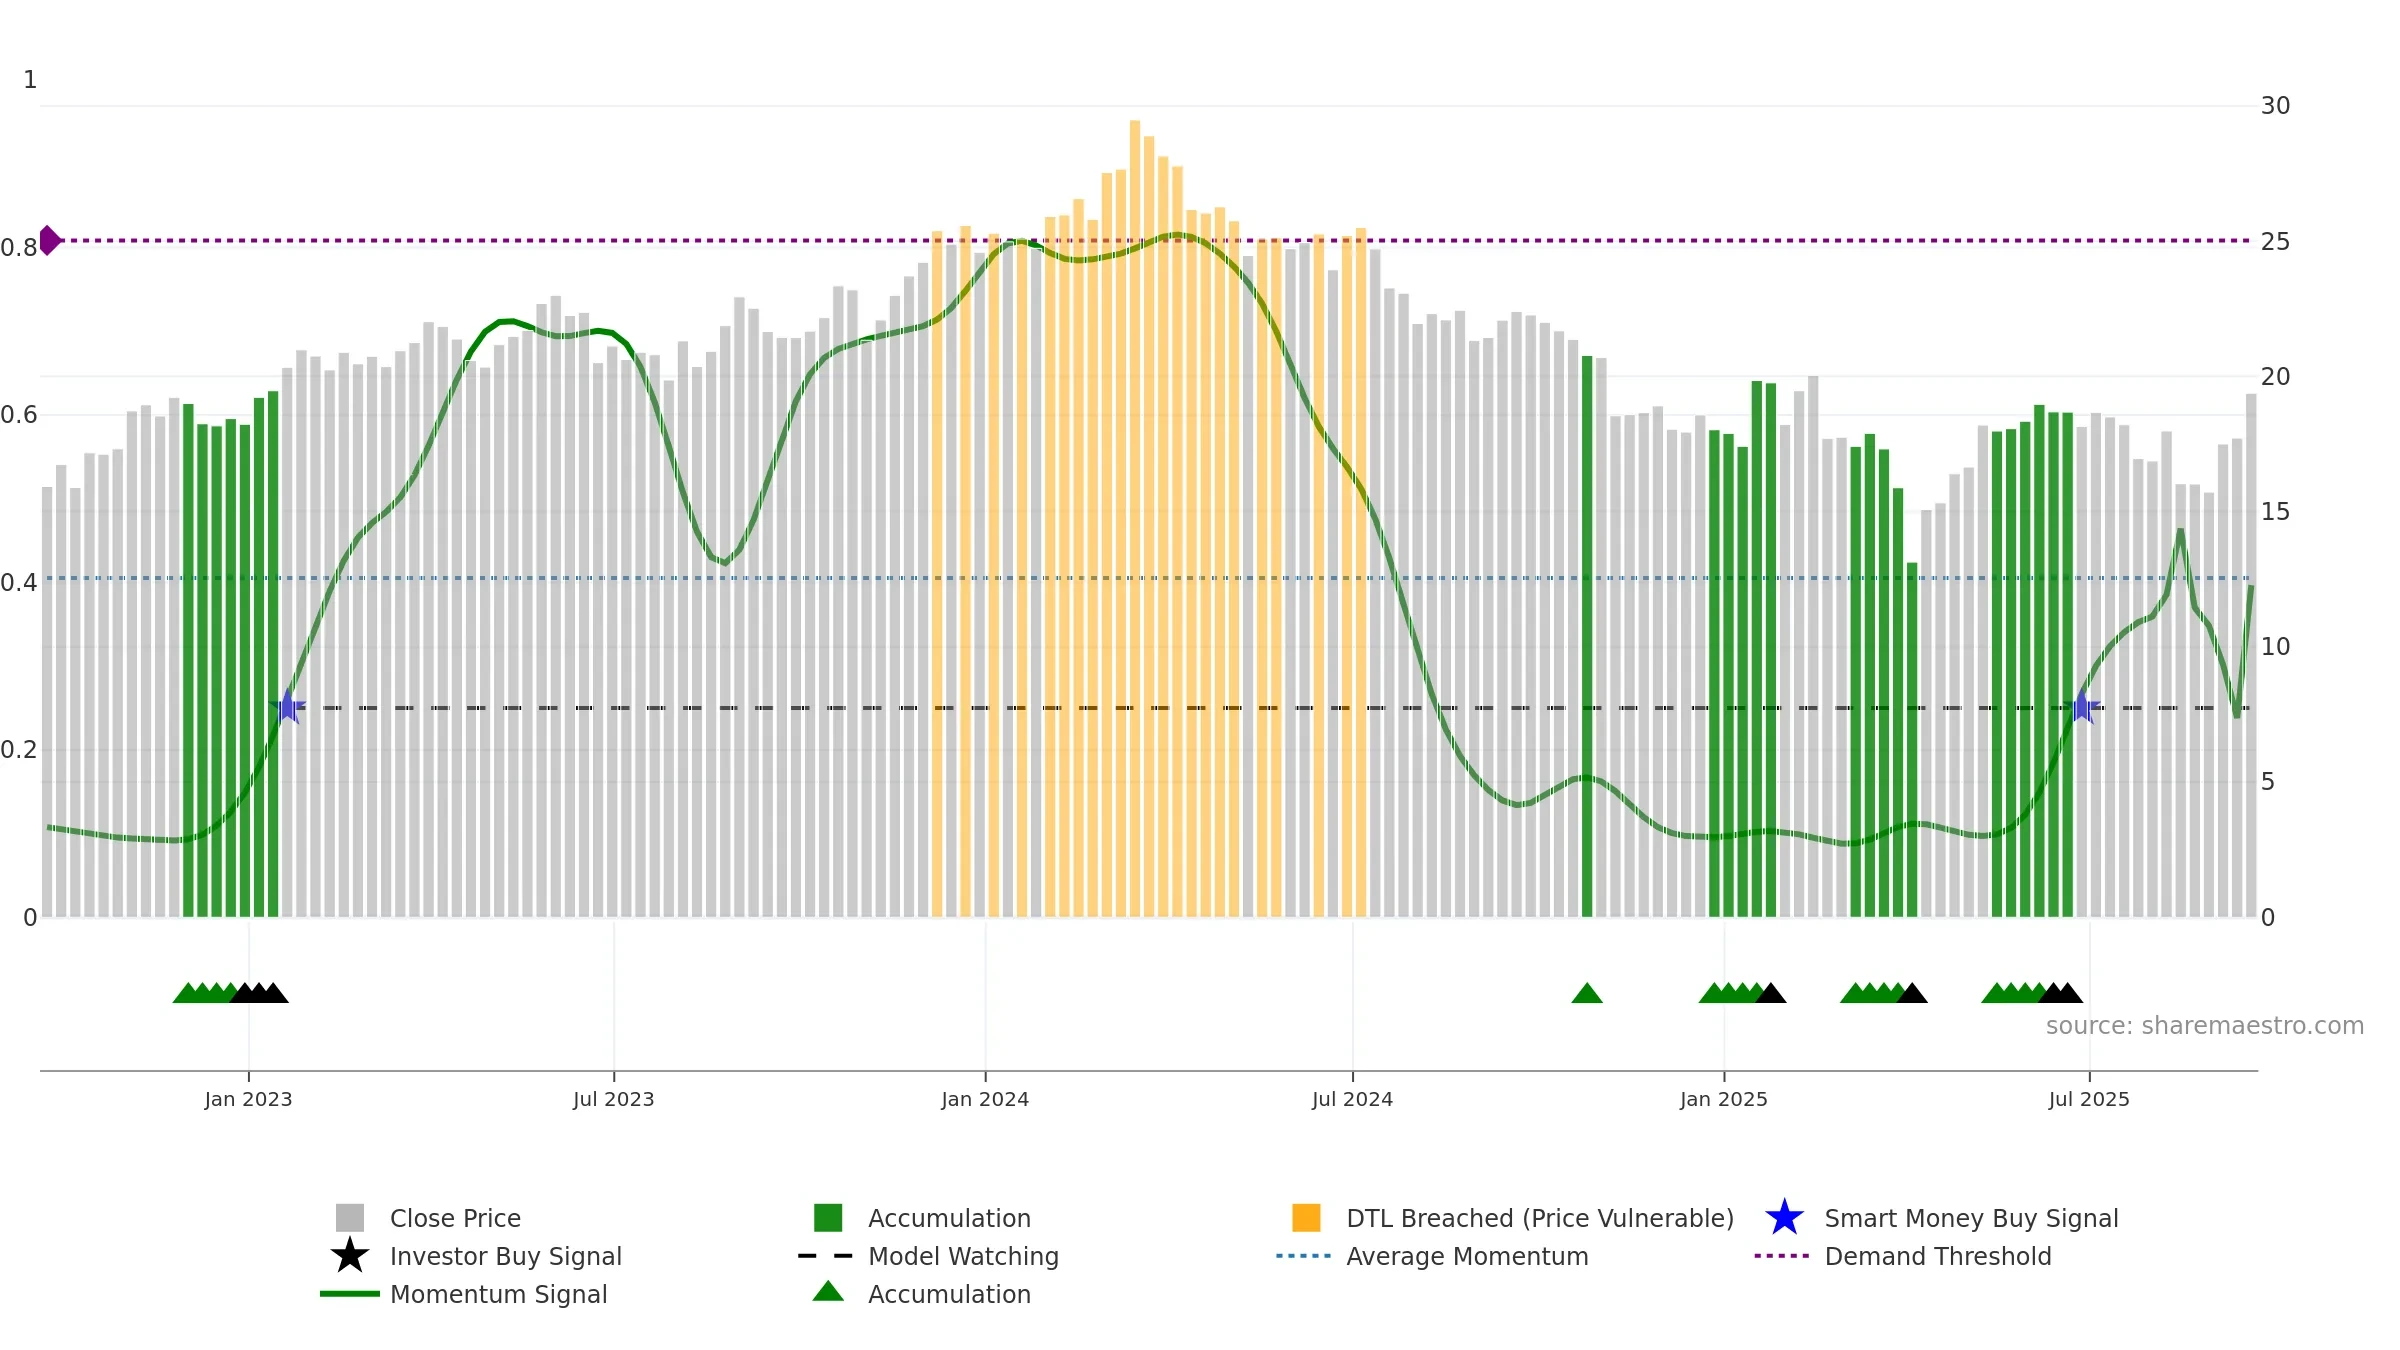
Weekly Report
ChipMOS TECHNOLOGIES INC. closed at 19.3800 (0.31% WoW) . Data window ends Fri, 19 Sep 2025.
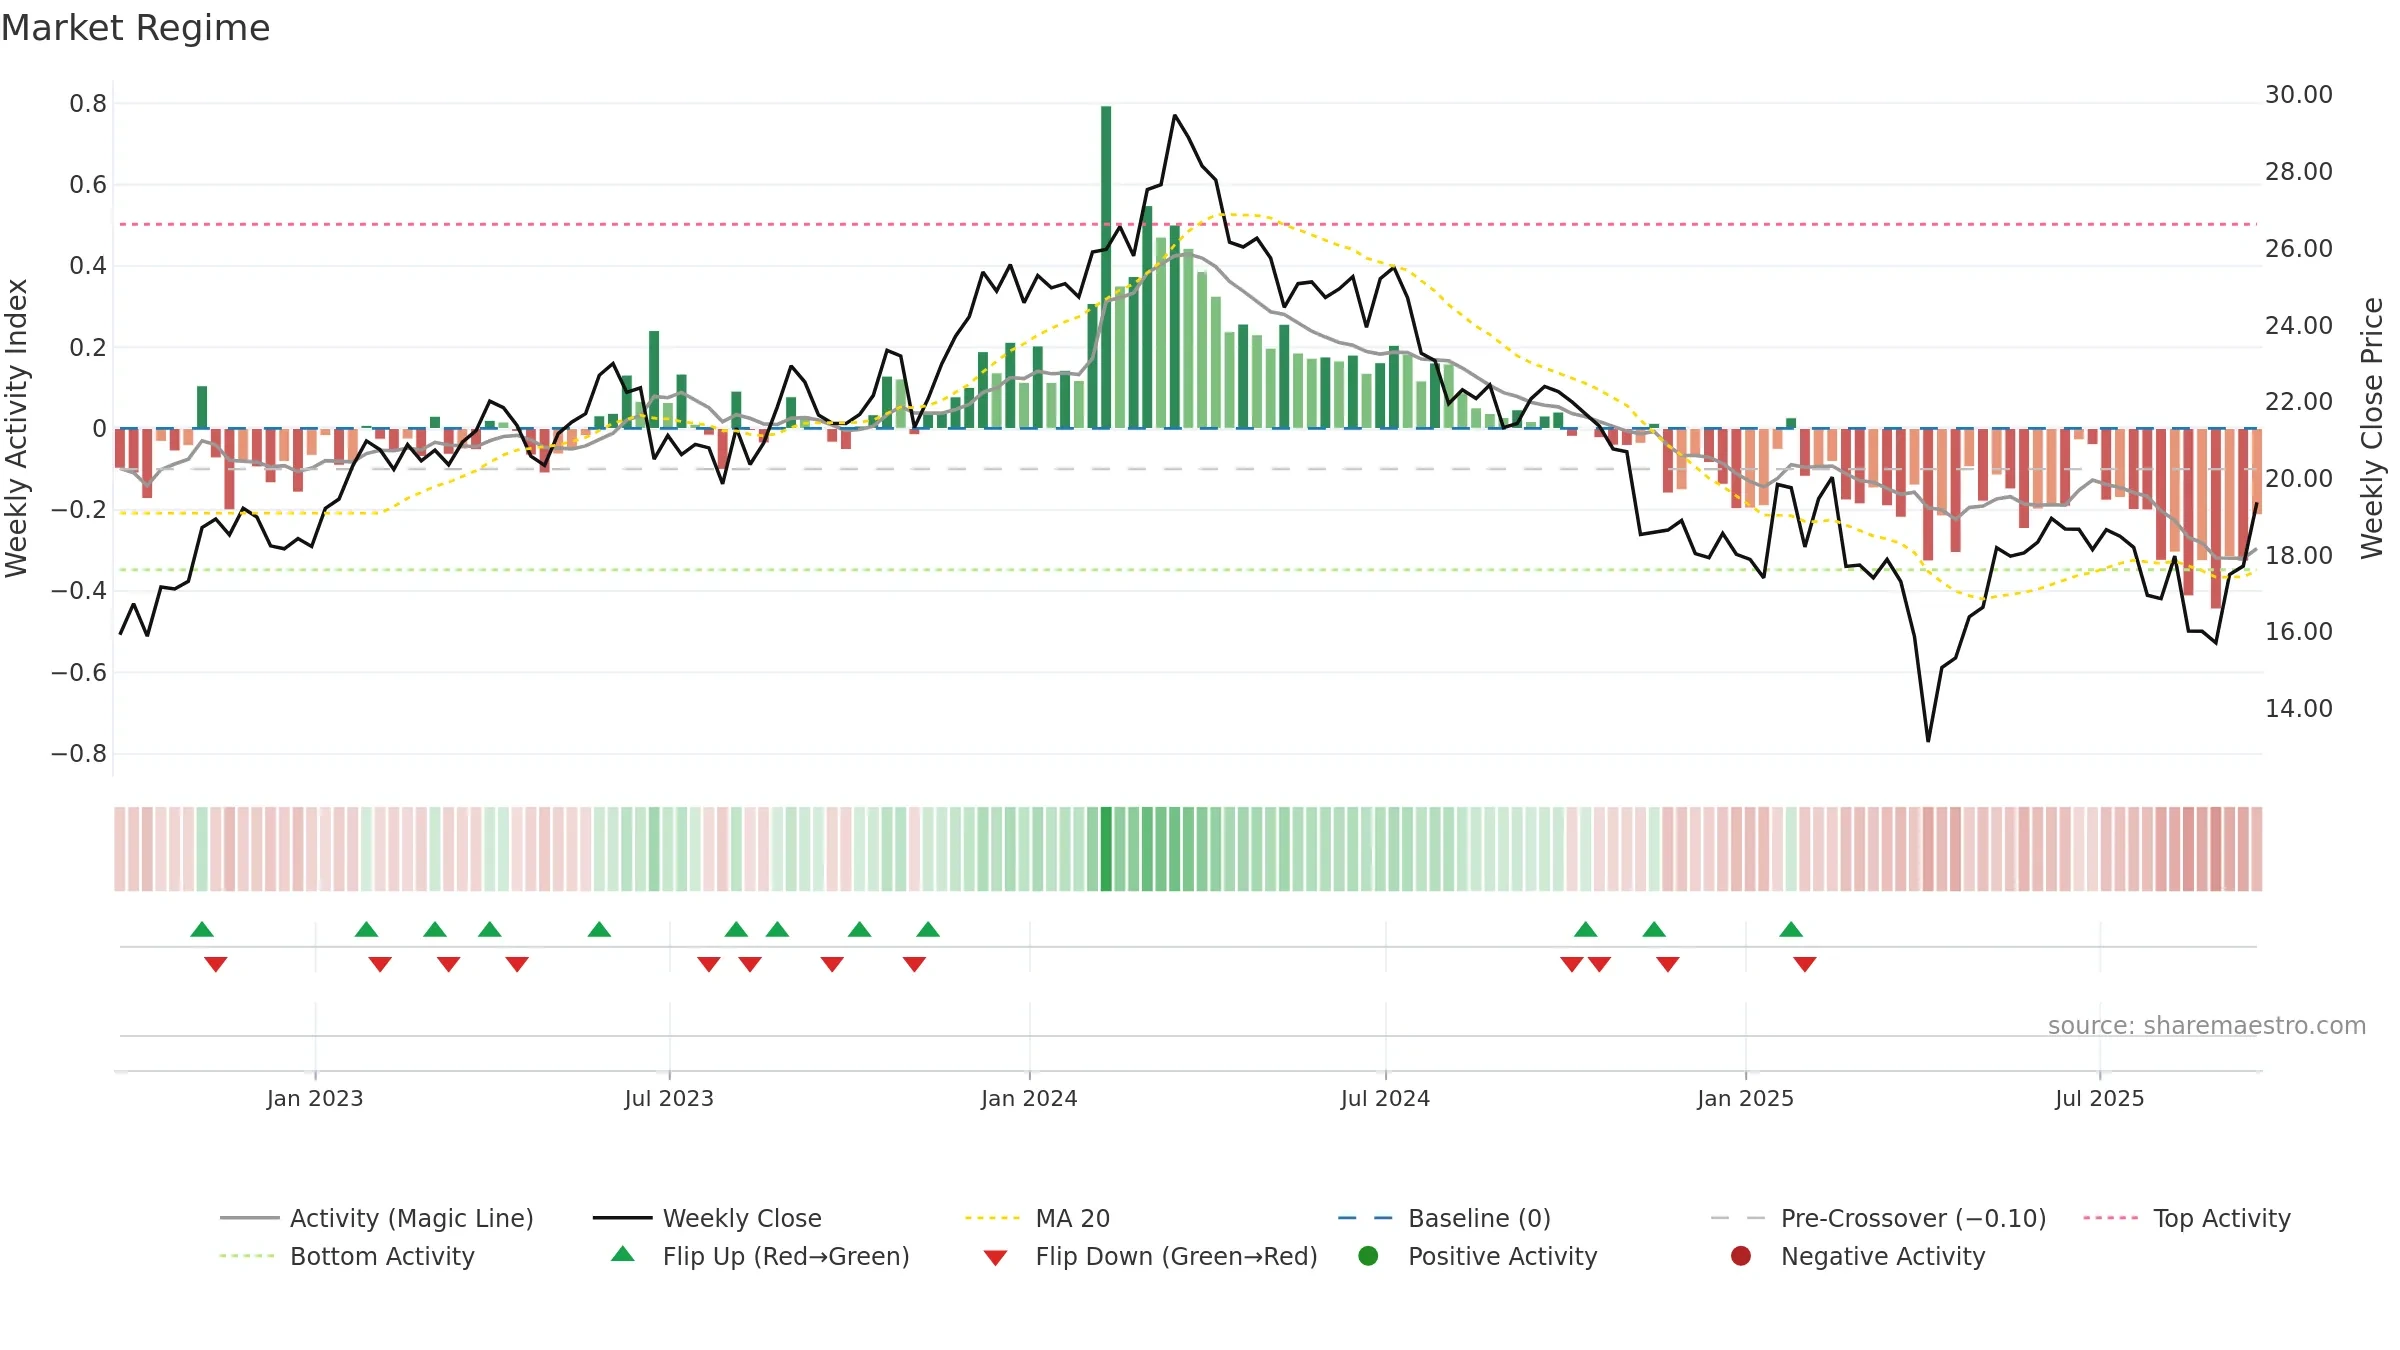
How to read this — Price slope is upward, indicating persistent buying over the window. Low weekly volatility favours steadier follow-through. Volume trend diverges from price — watch for fatigue or rotation. Returns are positively correlated with volume — strength tends to arrive on higher activity. Fresh short-term crossover improves near-term tone. Price holds above key averages, indicating constructive participation.
Up-slope supports buying interest; pullbacks may be contained if activity stays firm. Because liquidity isn’t confirming, prefer evidence of fresh demand before chasing moves.
Gauge maps the trend signal to a 0–100 scale.
How to read this — Bearish backdrop but short-term momentum is improving; confirmation still needed.
Early improvement — look for a reclaim of 0.50→0.60 to validate.
Price is below fair value; potential upside if momentum constructive.
Conclusion
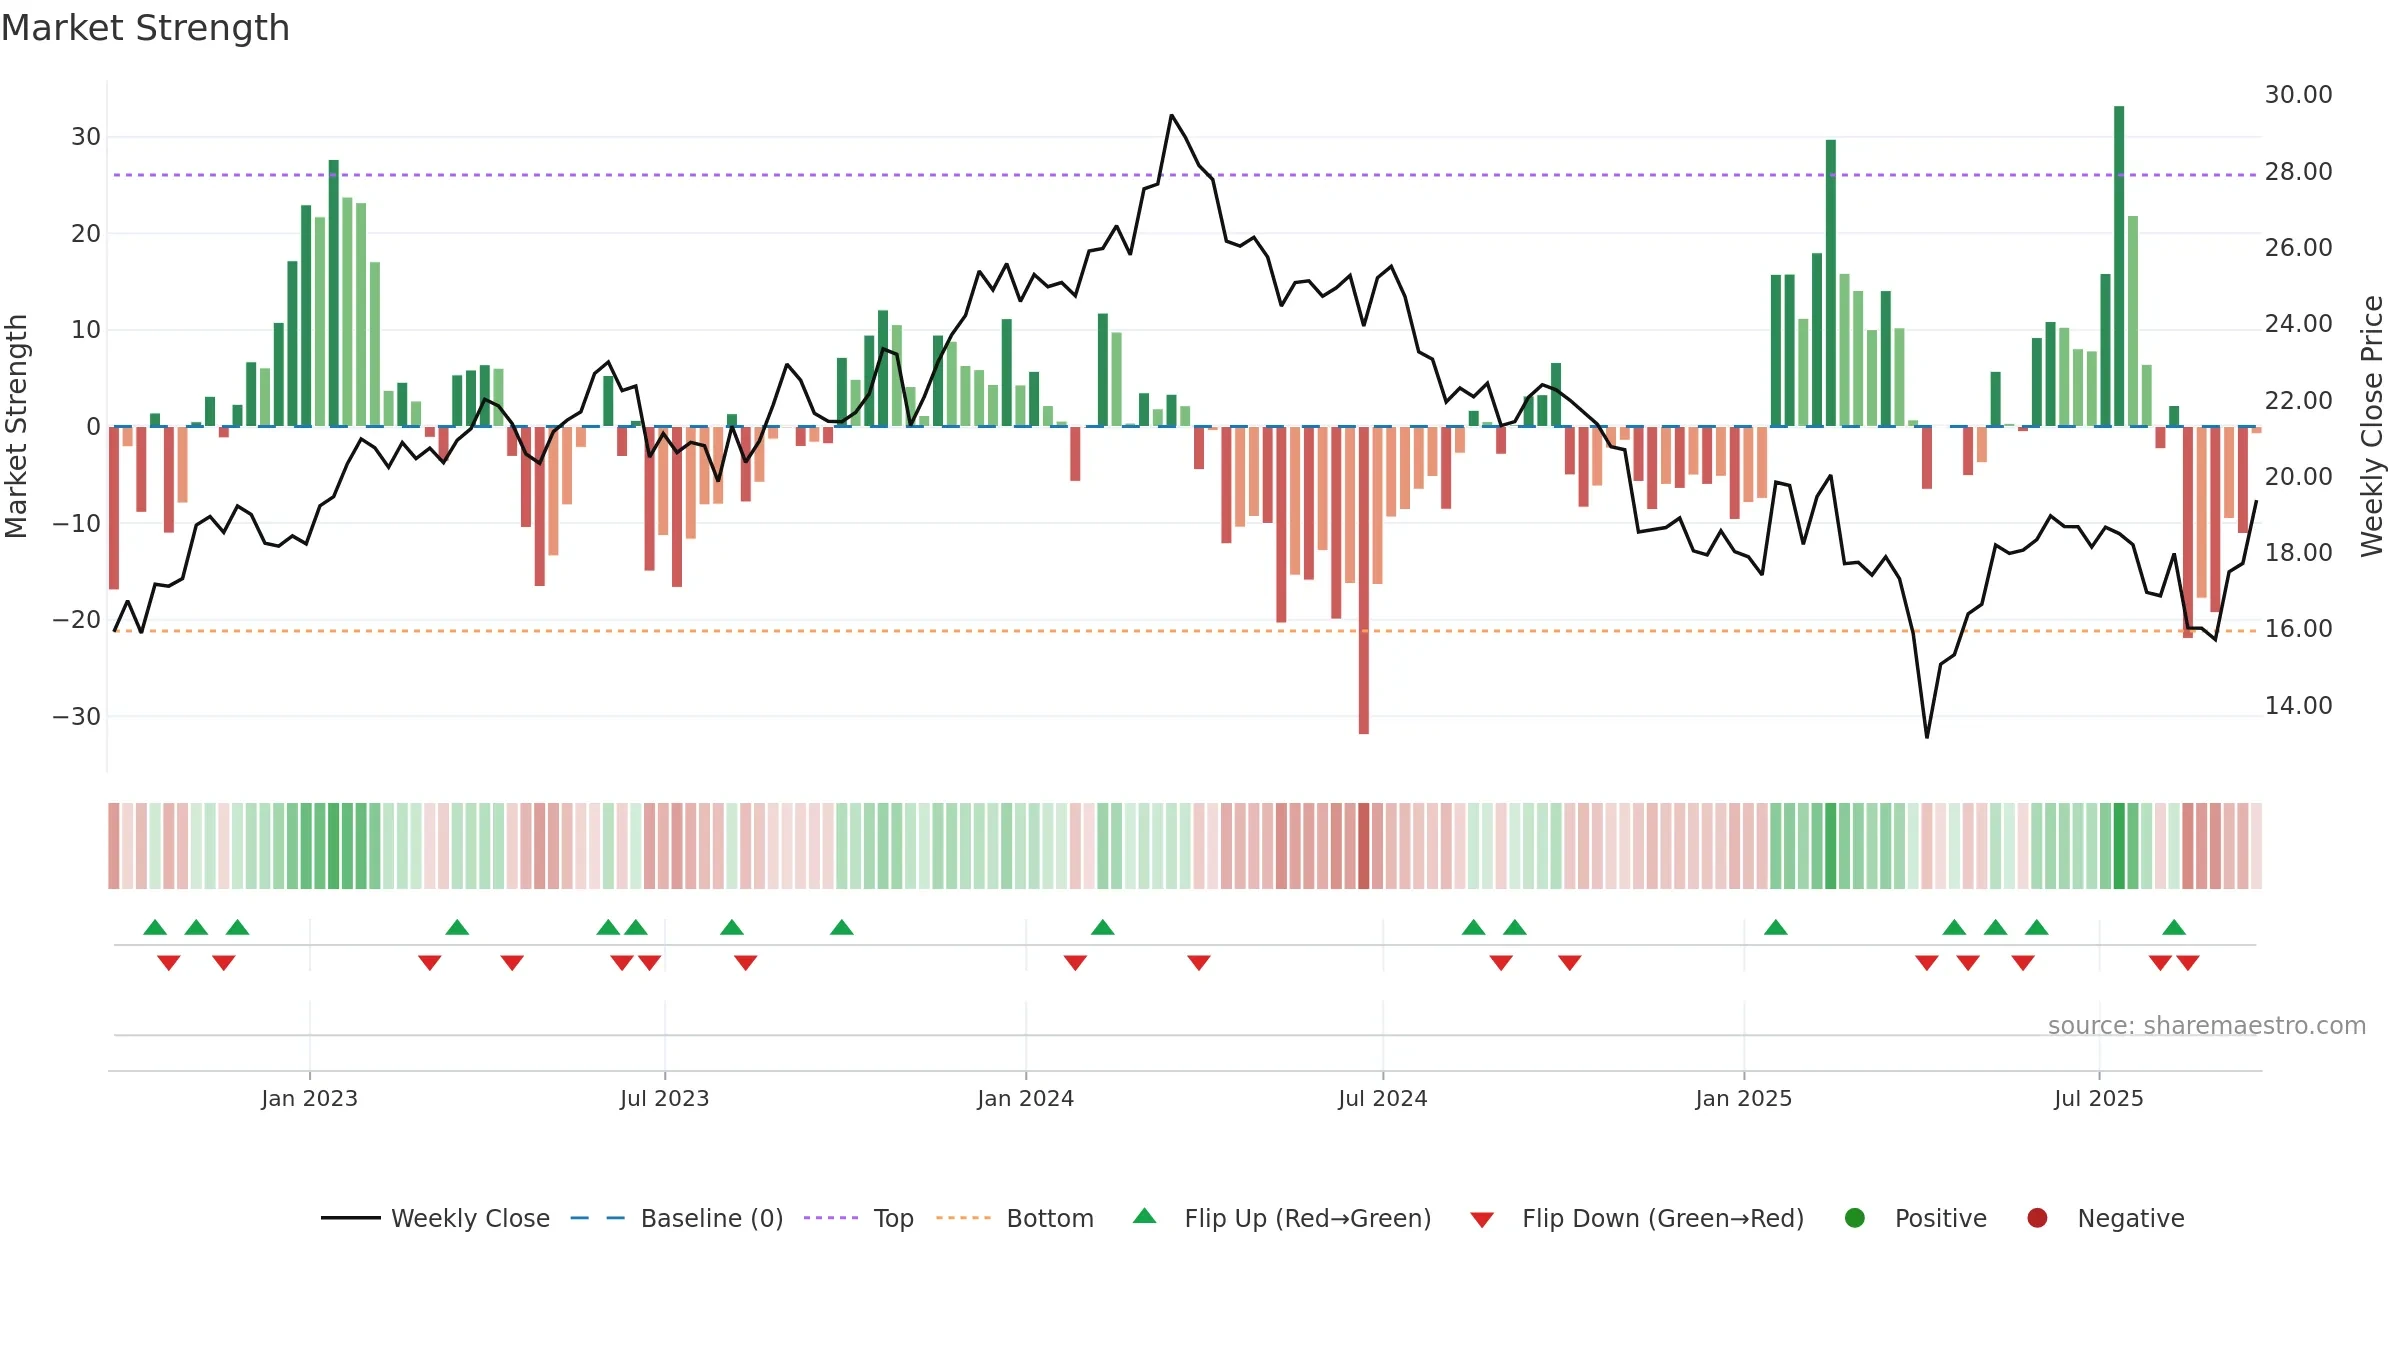
Negative setup. ★★☆☆☆ confidence. Price window: 14. Trend: Bottoming Attempt; gauge 39. In combination, liquidity diverges from price.
- Early improvement from bearish zone (bottoming attempt)
- Price holds above 8w & 26w averages
- Low return volatility supports durability
- Solid multi-week performance
- Momentum is weak/falling
- Liquidity diverges from price
Why: Price window 14.88% over 8w. Close is 7.79% above the prior-window high. Return volatility 1.66%. Volume trend falling. Liquidity divergence with price. Trend state bottoming attempt. 4–8w crossover bullish. Momentum bearish and falling. Valuation supportive skew.
Tip: Most metrics include a hover tooltip where they appear in the report.