Lung Hwa Electronics Co., Ltd.
2424 TPE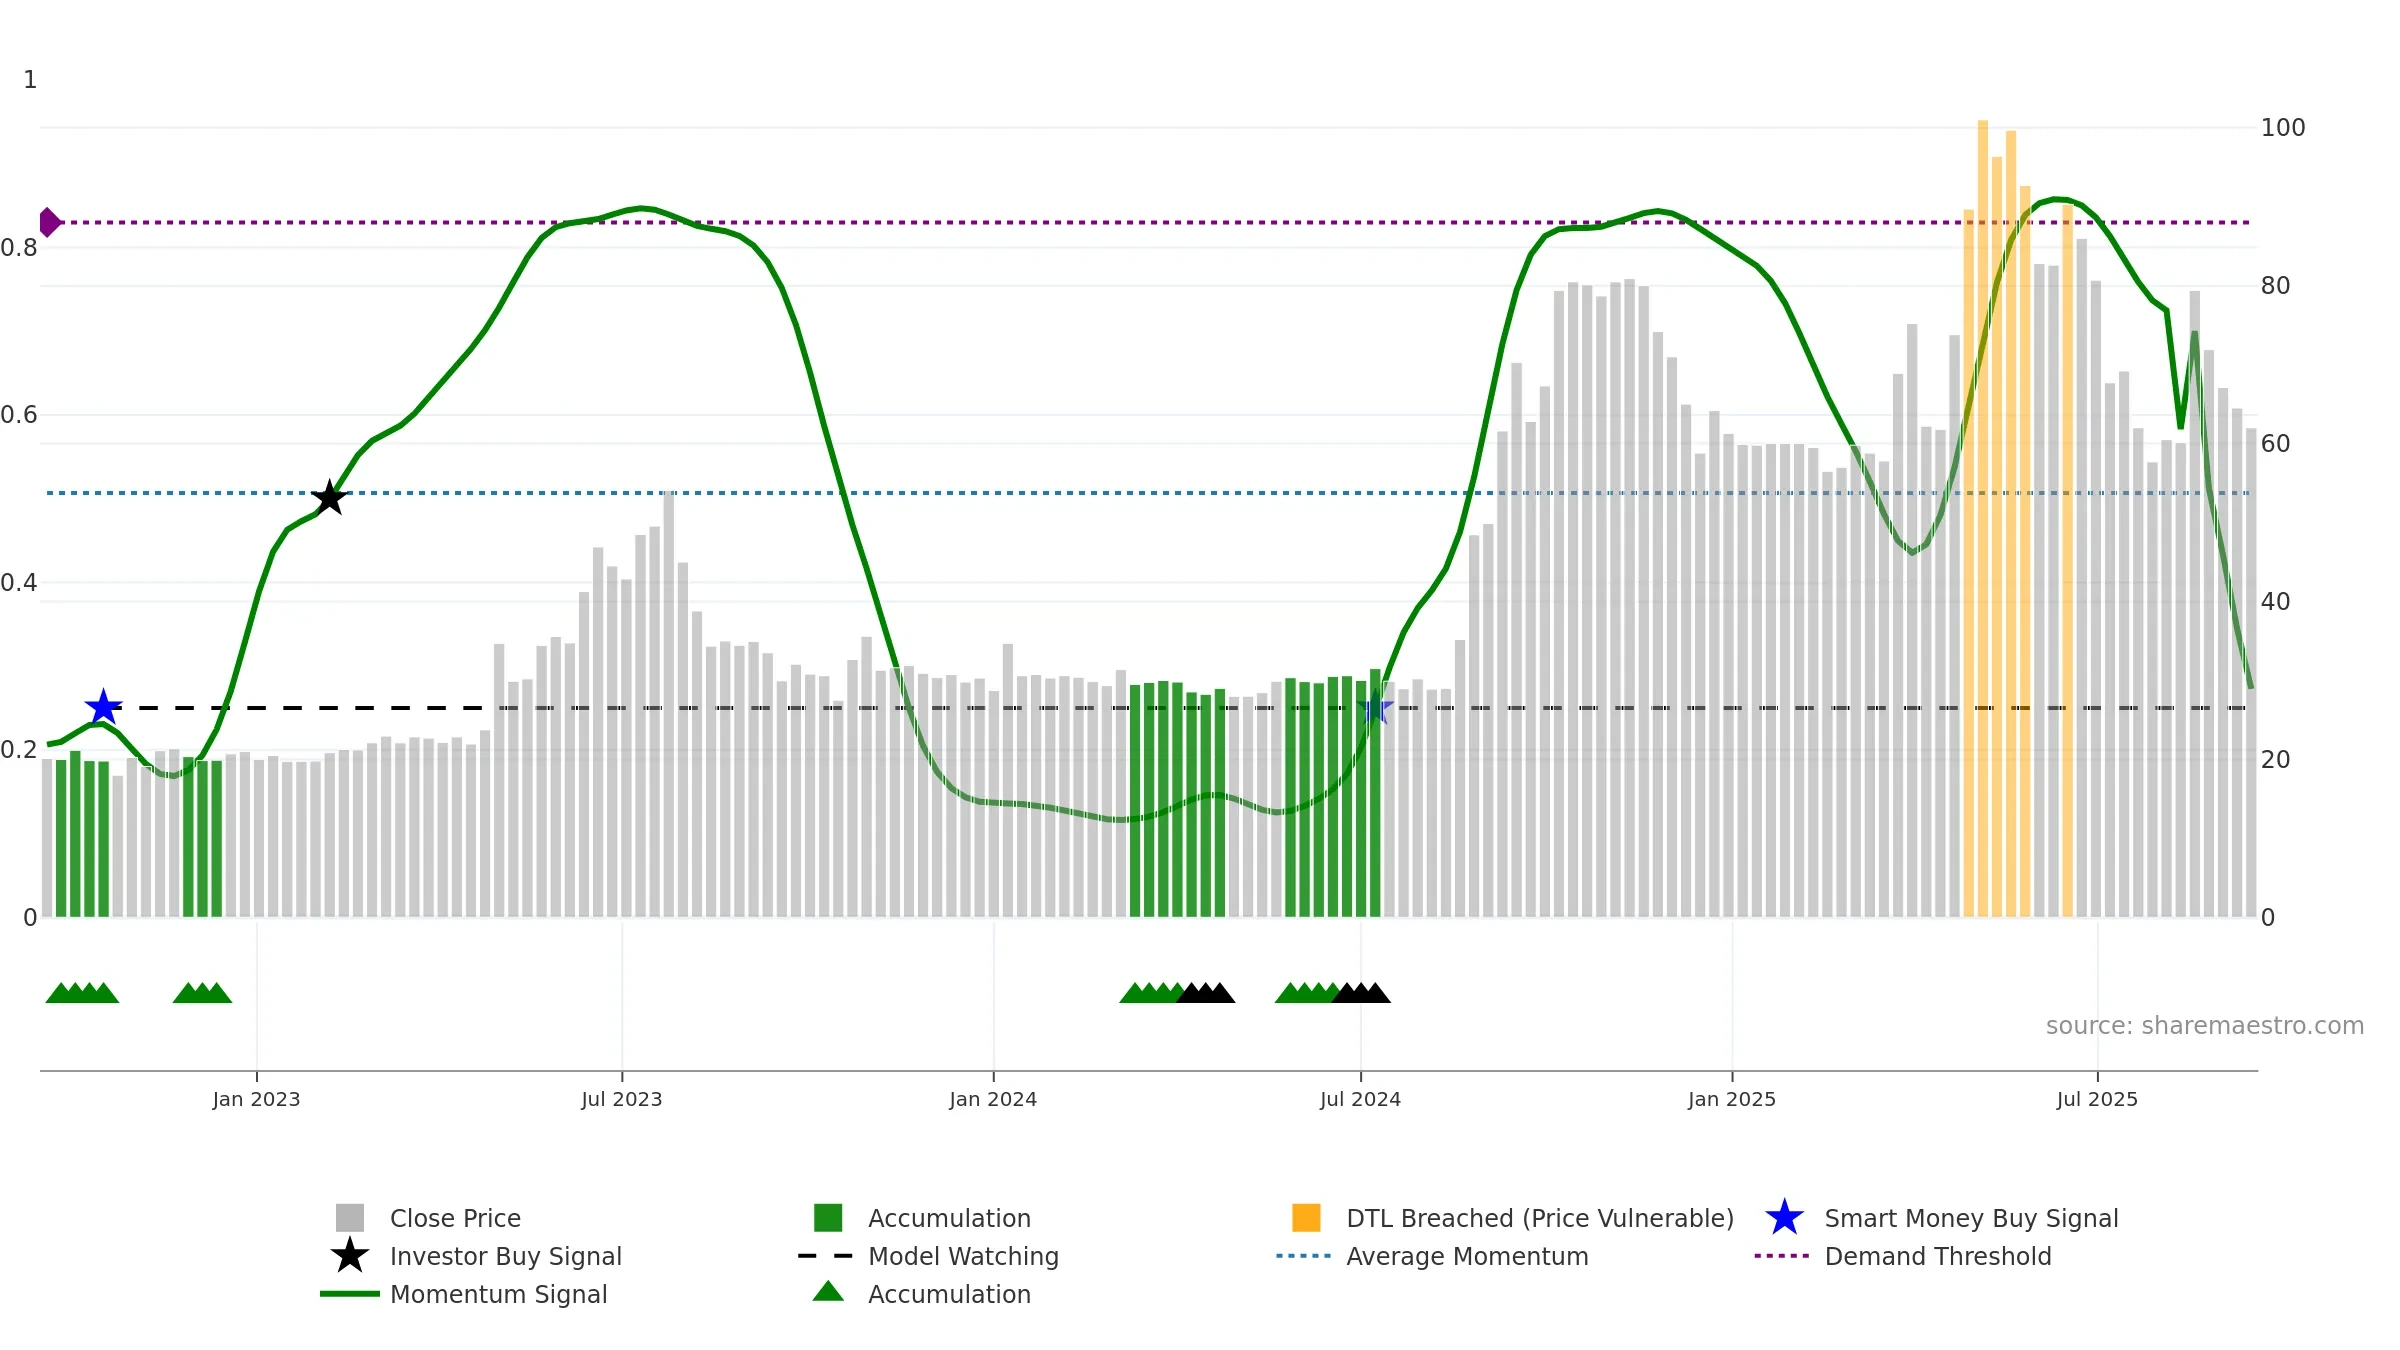
Weekly Report
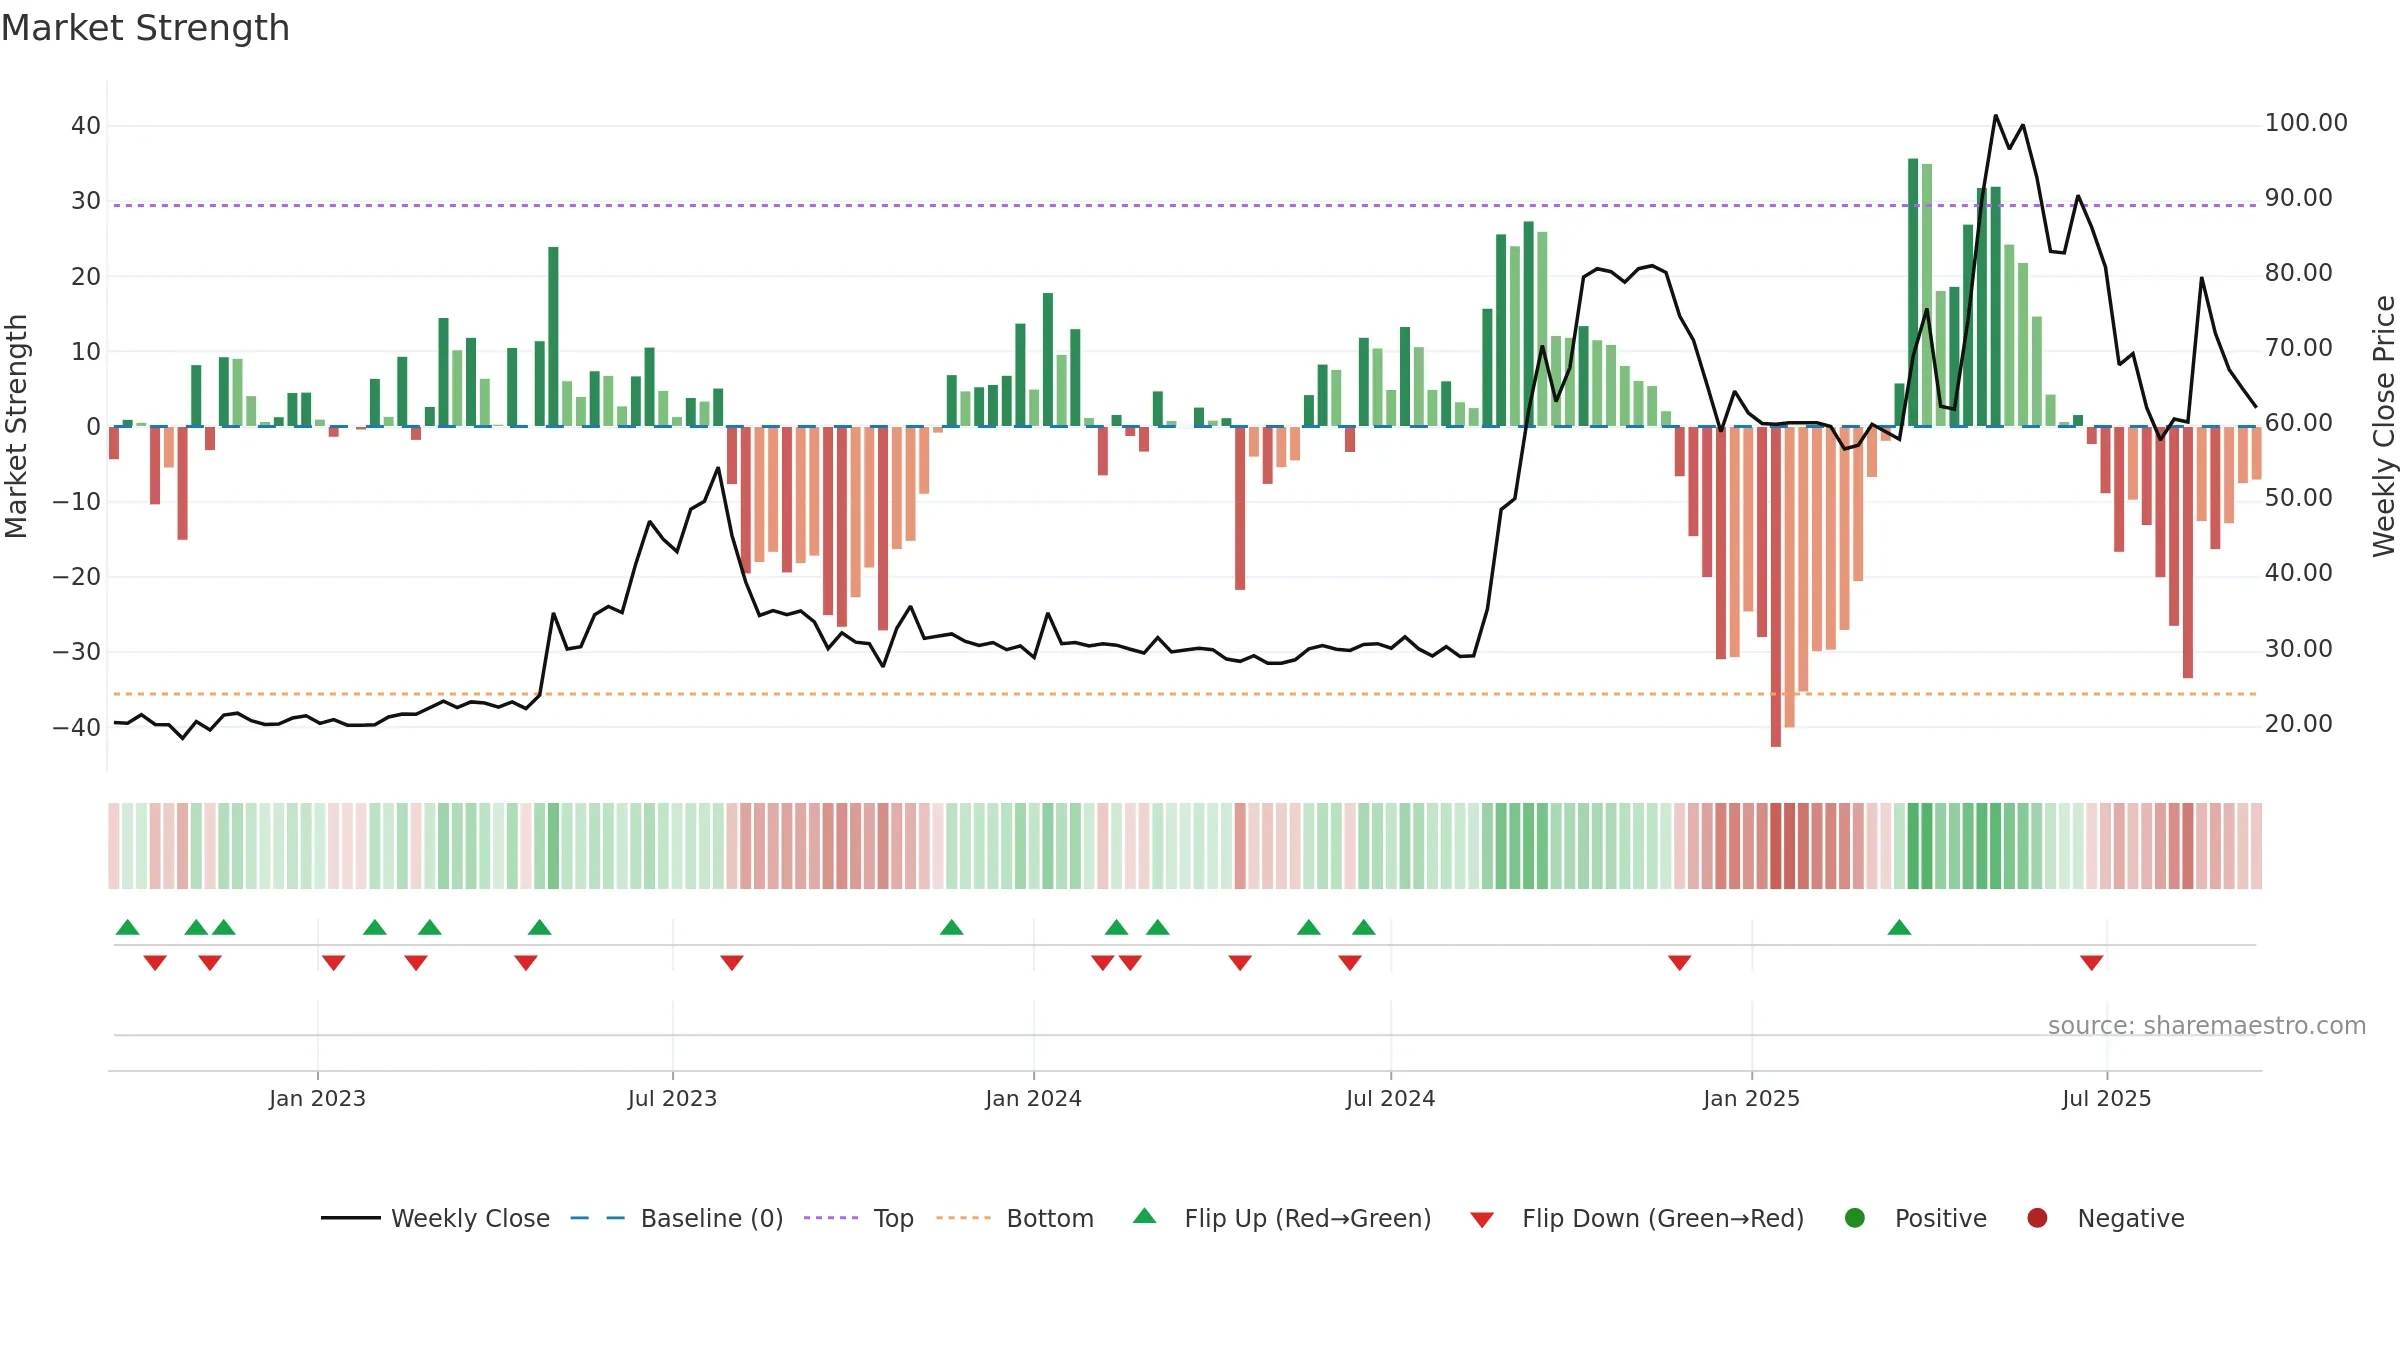
Lung Hwa Electronics Co., Ltd. closed at 62.0000 (3.16% WoW) . Data window ends Mon, 15 Sep 2025.
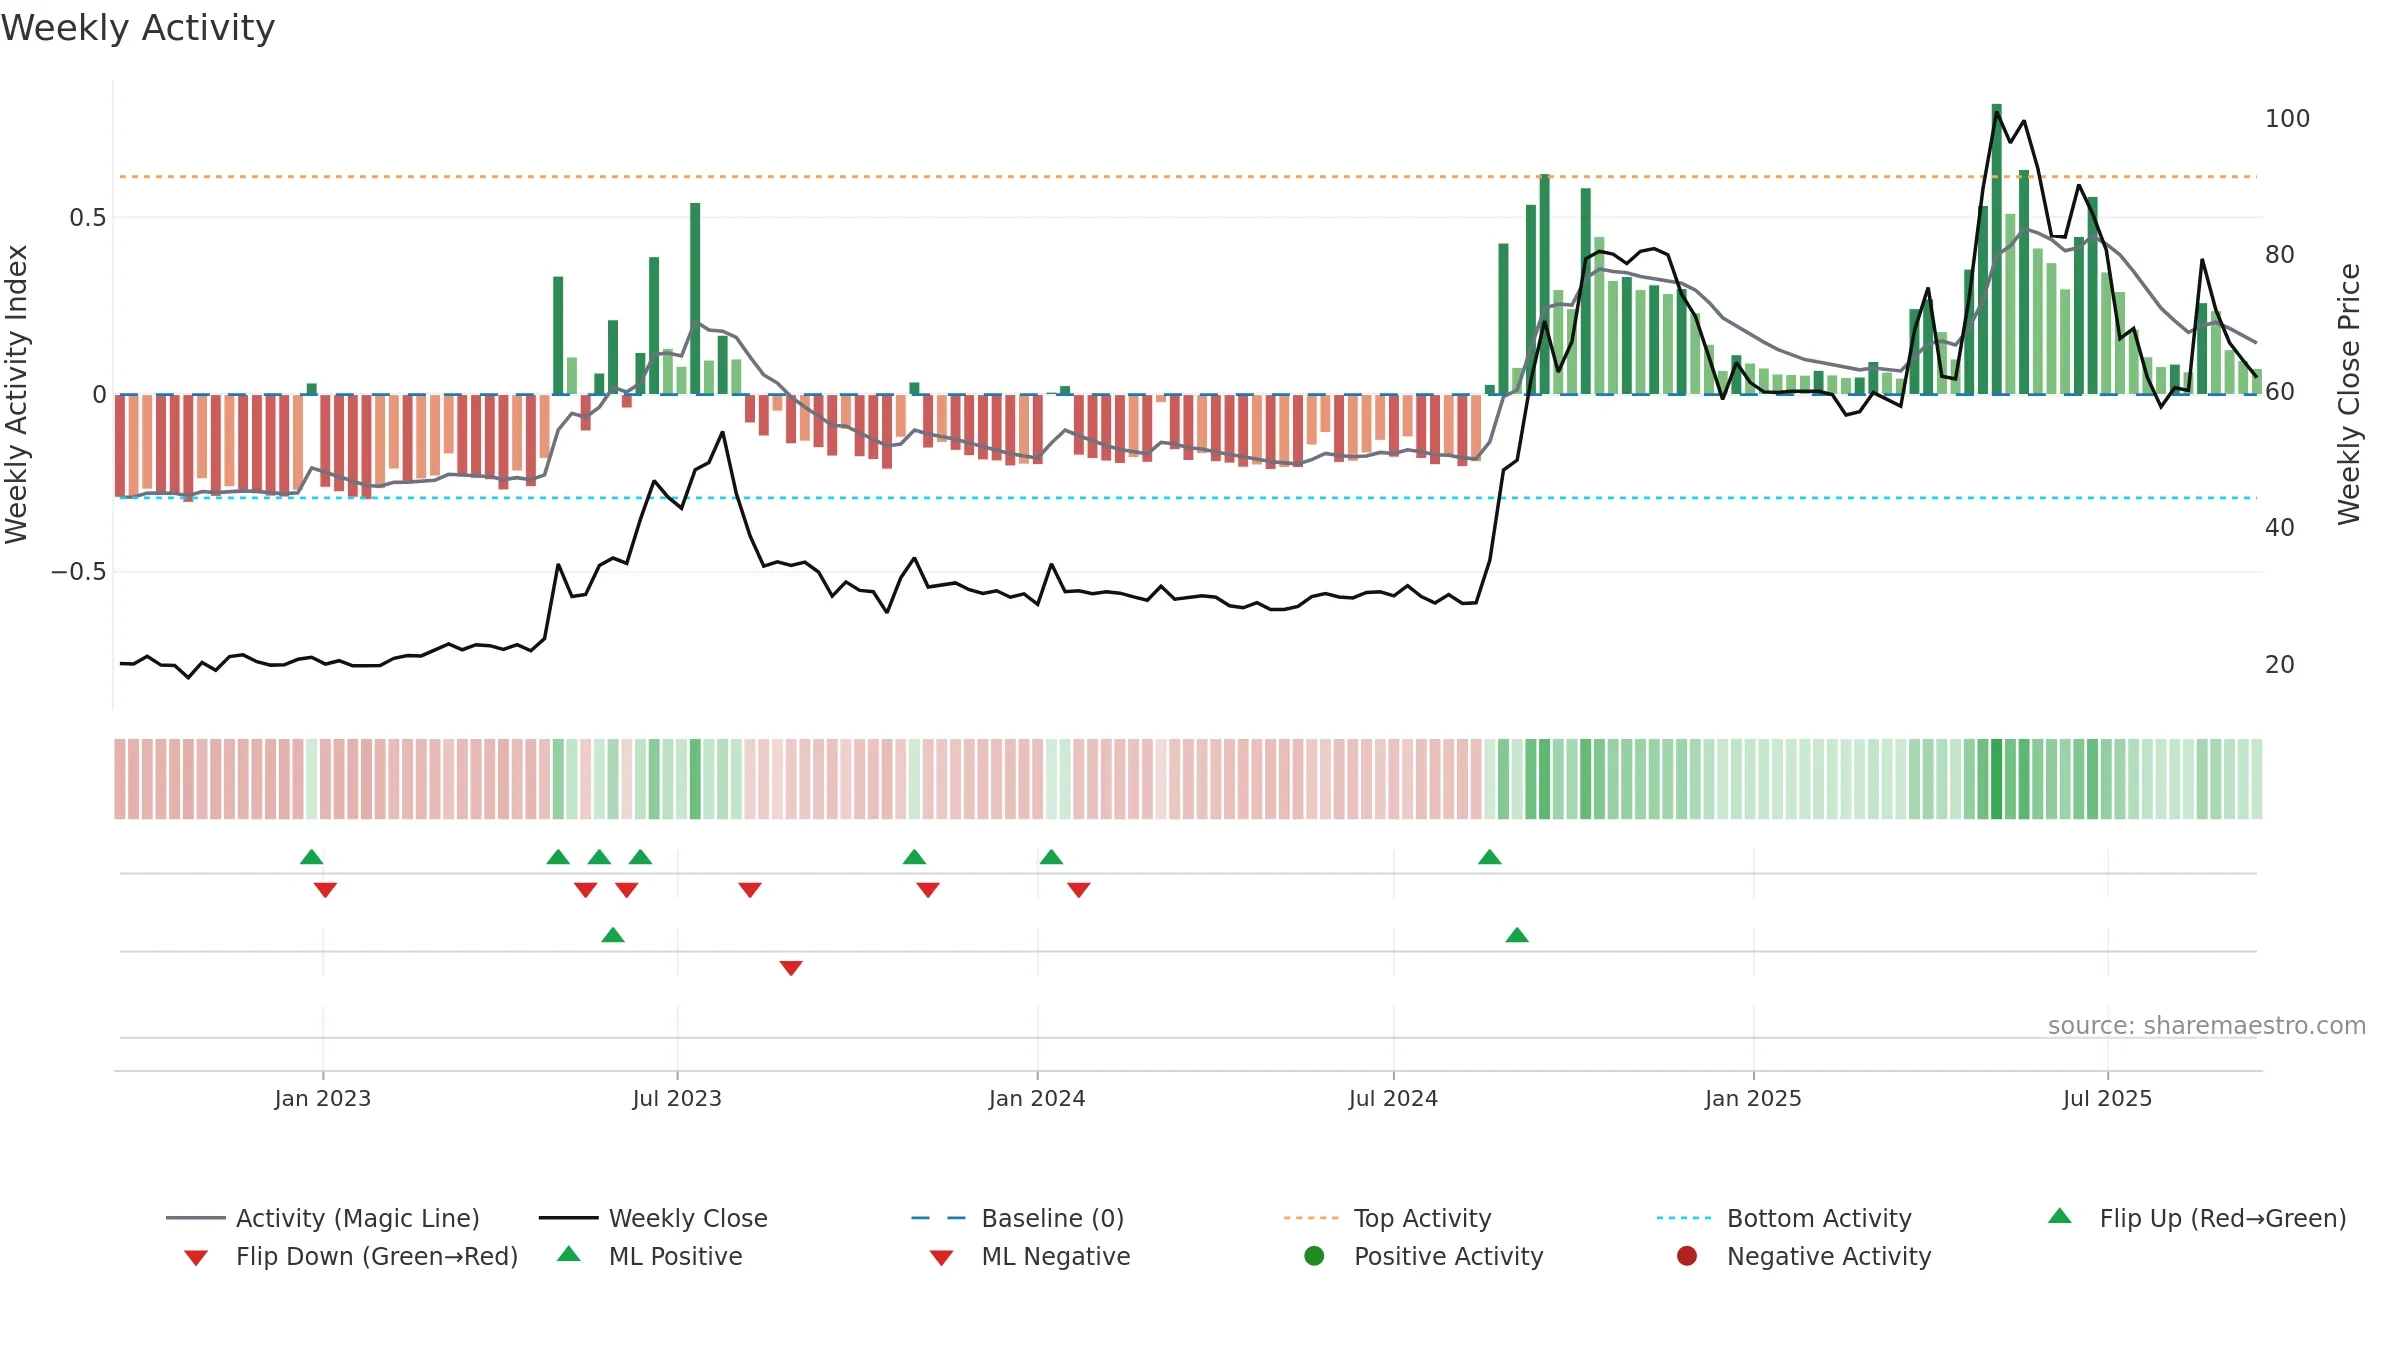
How to read this — Price slope is upward, indicating persistent buying over the window. Volume trend diverges from price — watch for fatigue or rotation. Distance to baseline is narrowing — reverting closer to its fair-value track. Price sits below key averages, keeping pressure on the tape.
Up-slope supports buying interest; pullbacks may be contained if activity stays firm. Because liquidity isn’t confirming, prefer evidence of fresh demand before chasing moves.
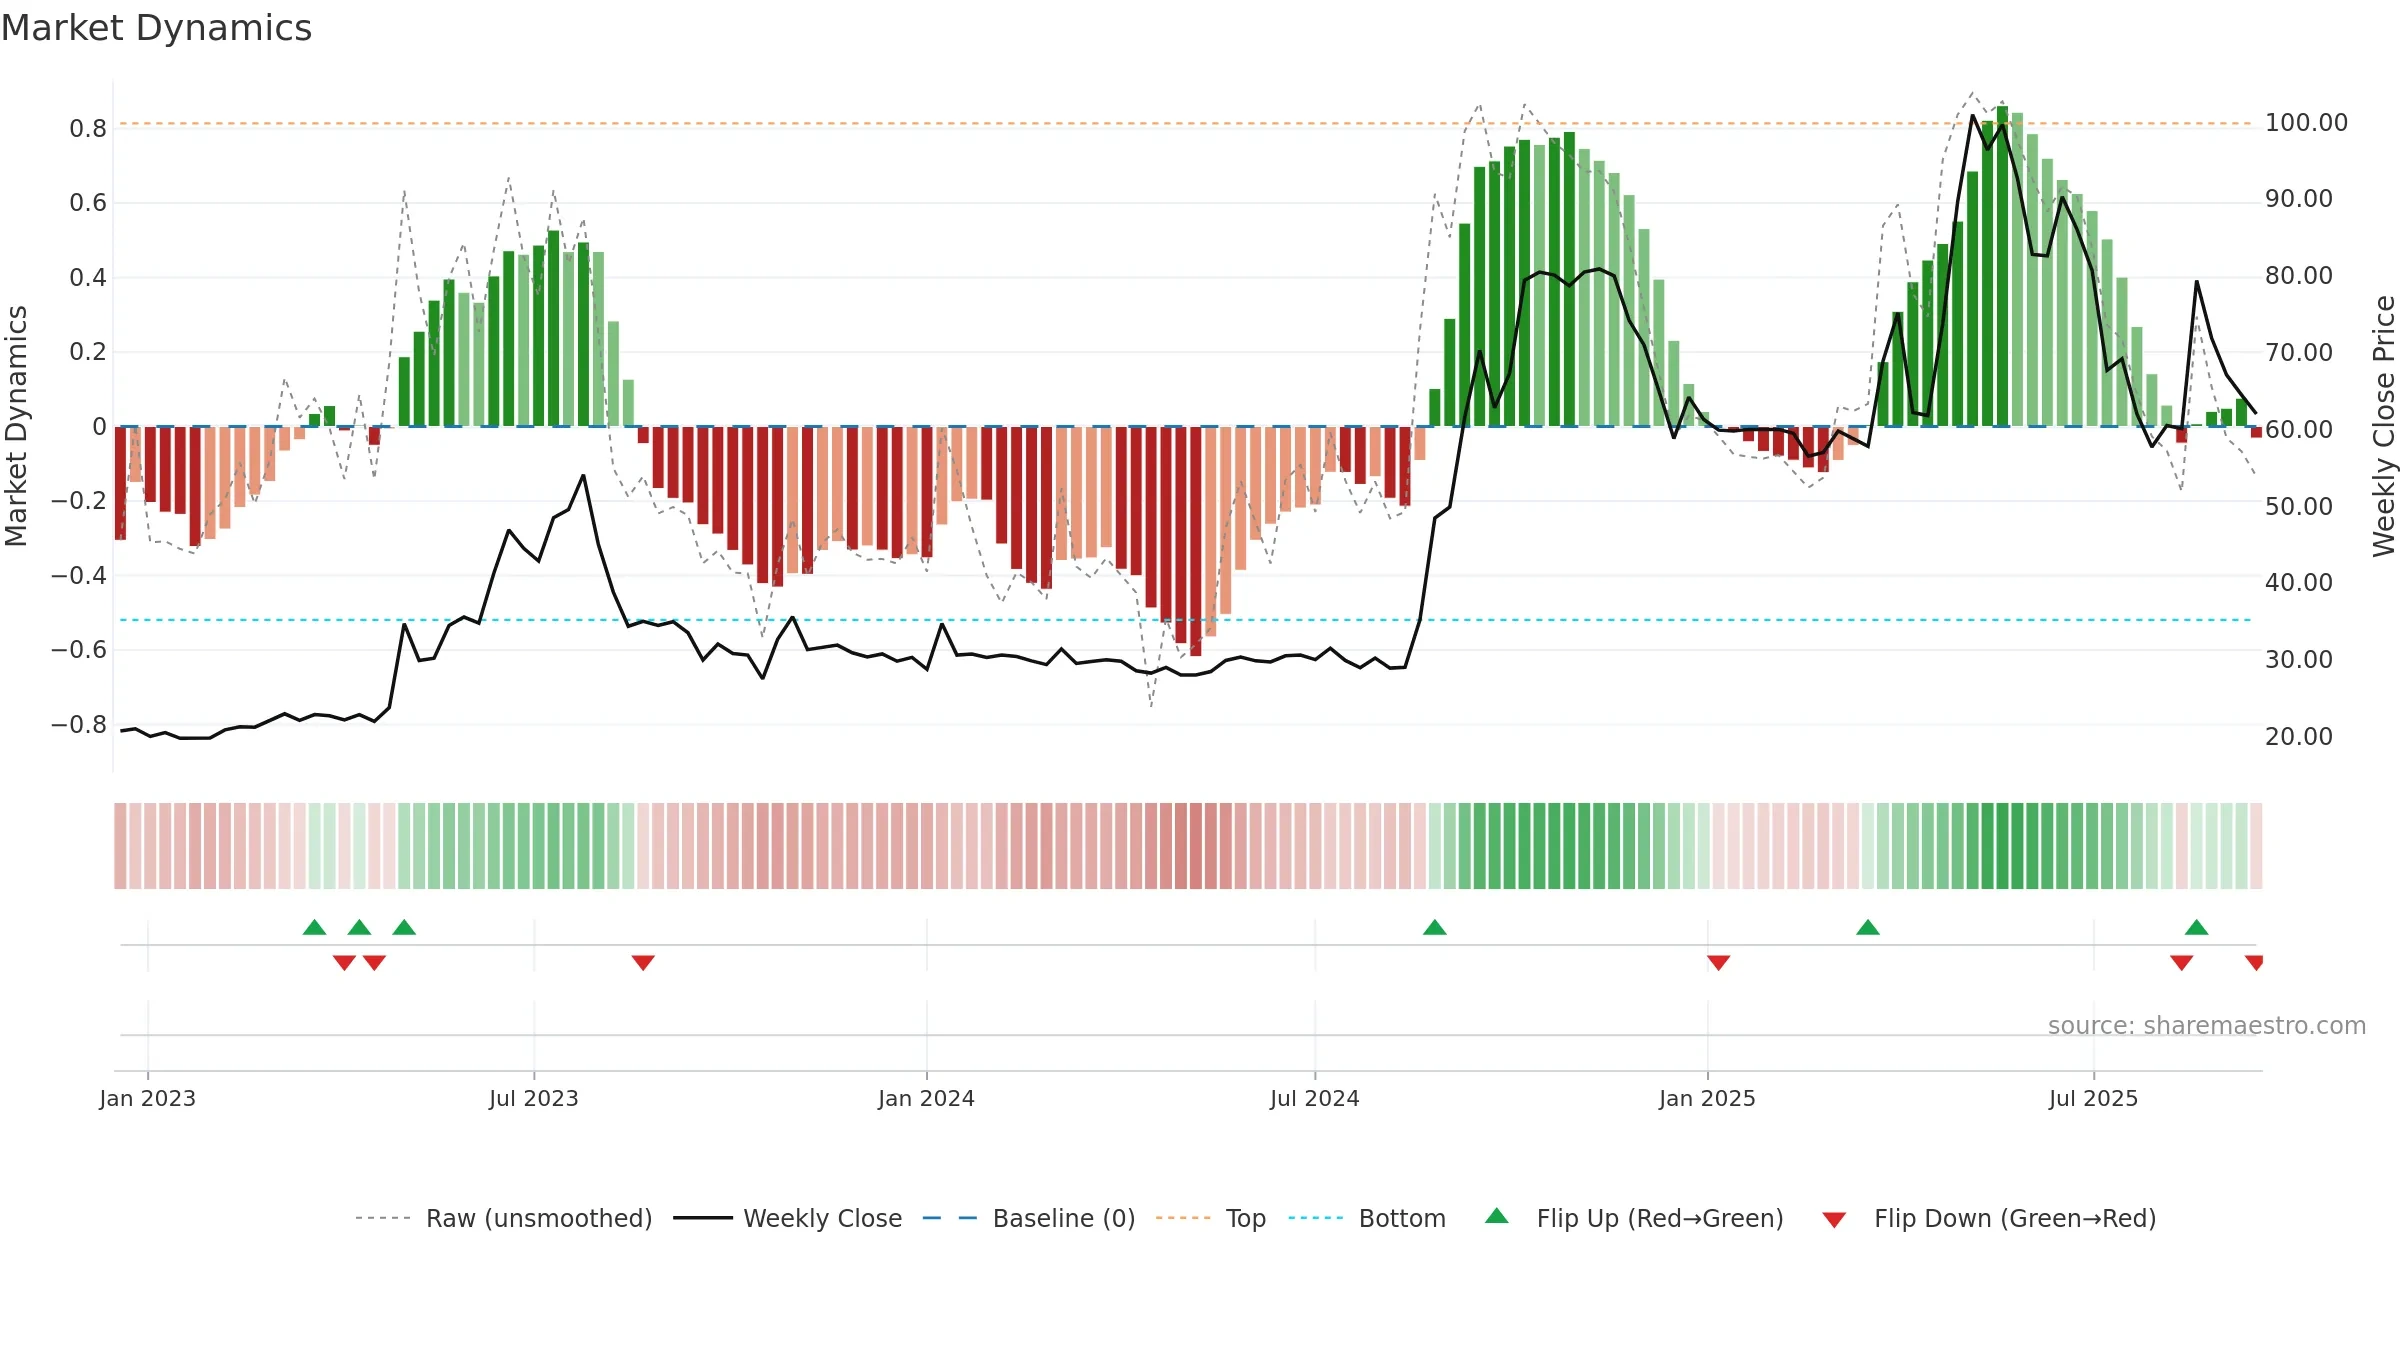
Gauge maps the trend signal to a 0–100 scale.
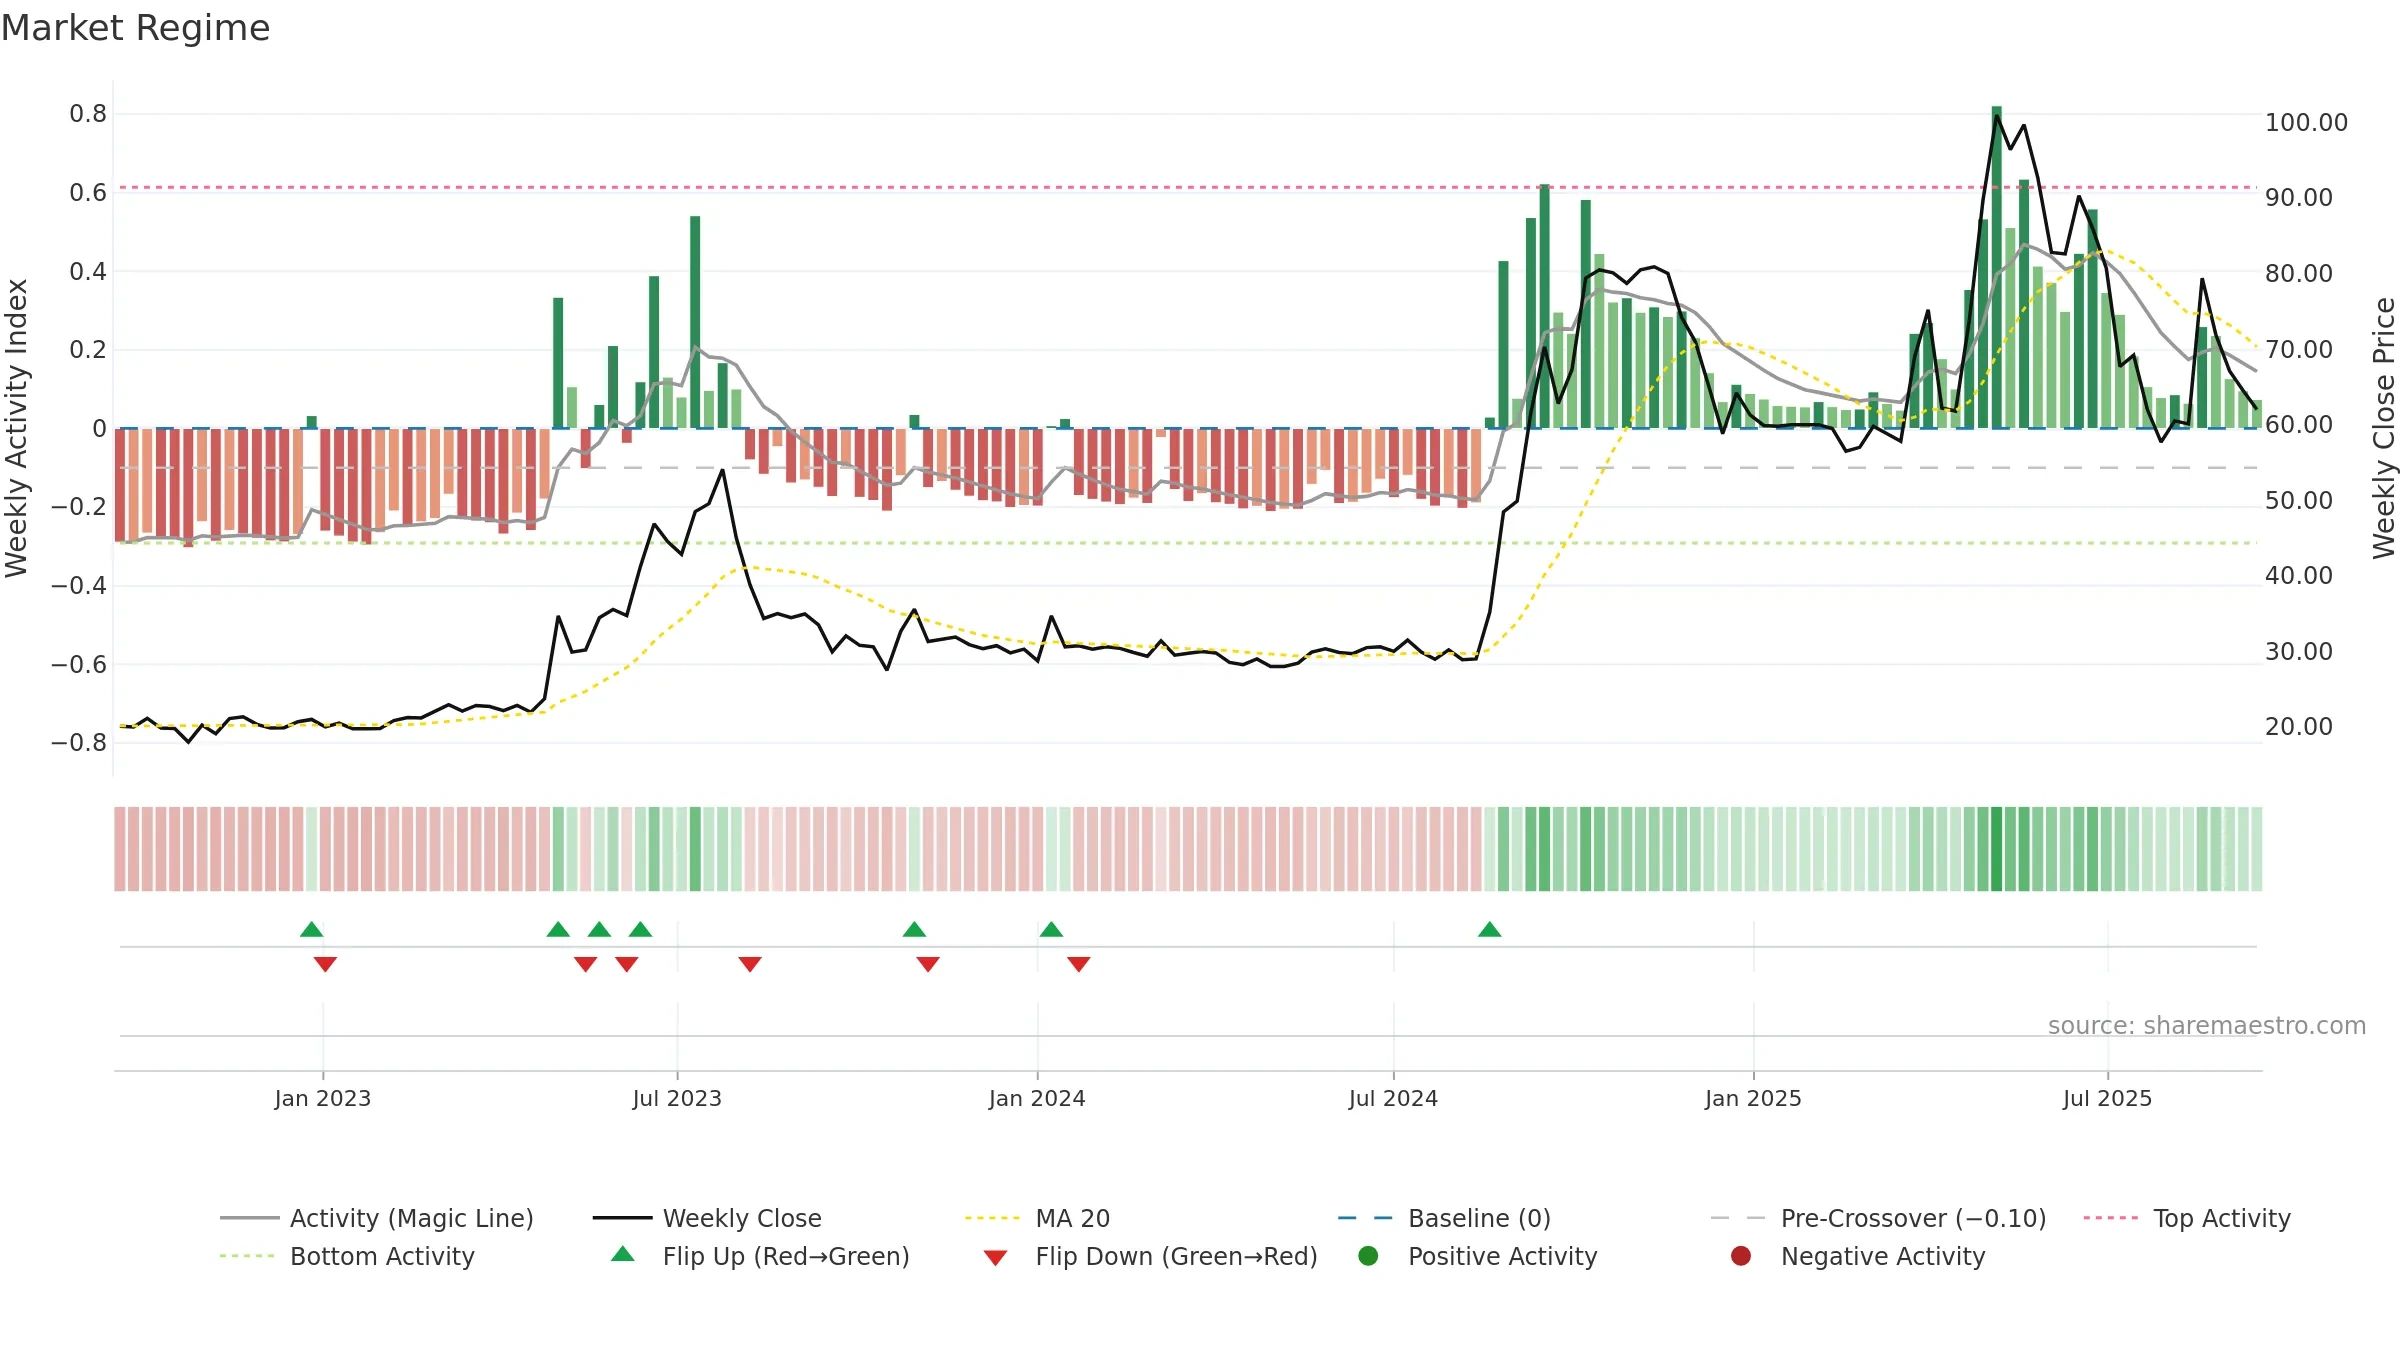
How to read this — Bearish zone with falling momentum — sellers in control. Loss of the ~0.50 midline after strength suggests regime shift. Sub-0.40 print confirms downside control.
Bias remains lower; rallies are suspect unless gauge reclaims 0.50/0.60.
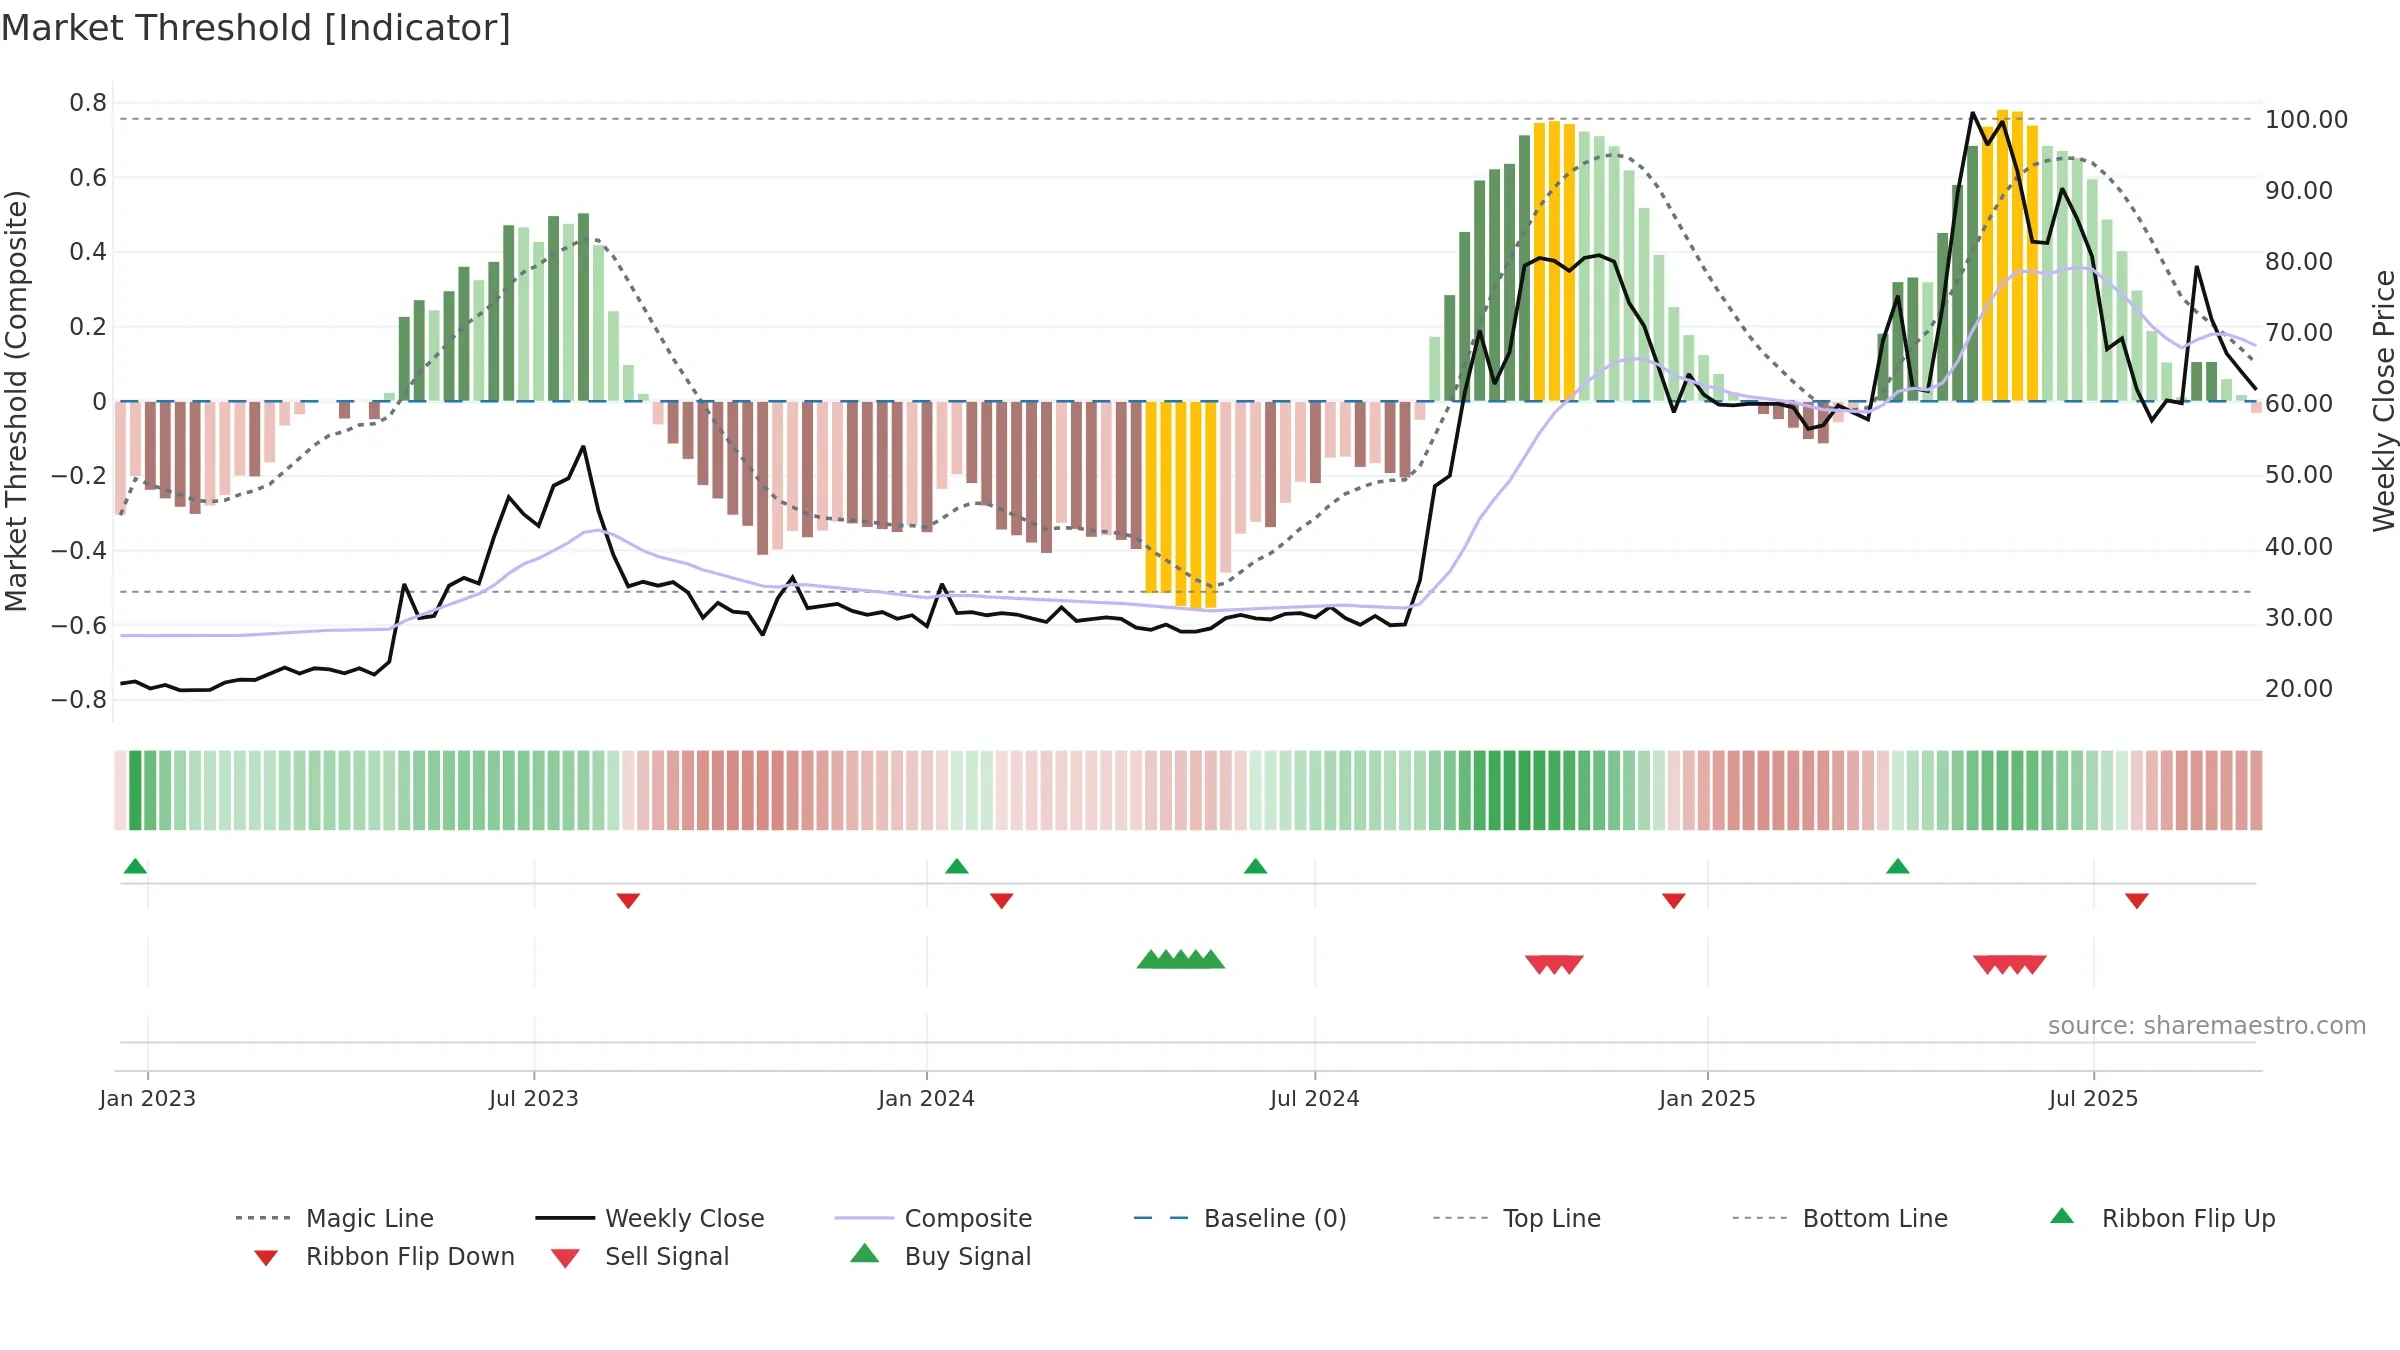
Conclusion
Negative setup. ★☆☆☆☆ confidence. Price window: 7. Trend: Downtrend Confirmed; gauge 27. In combination, liquidity diverges from price.
- Bearish control with falling momentum
- Momentum is weak/falling
- Price is not above key averages
- Liquidity diverges from price
Why: Price window 7.45% over 8w. Close is -21.91% below the prior-window high. Volume trend falling. Liquidity divergence with price. Trend state downtrend confirmed. Momentum bearish and falling.
Tip: Most metrics include a hover tooltip where they appear in the report.