B&M European Value Retail S.A.
BME LSE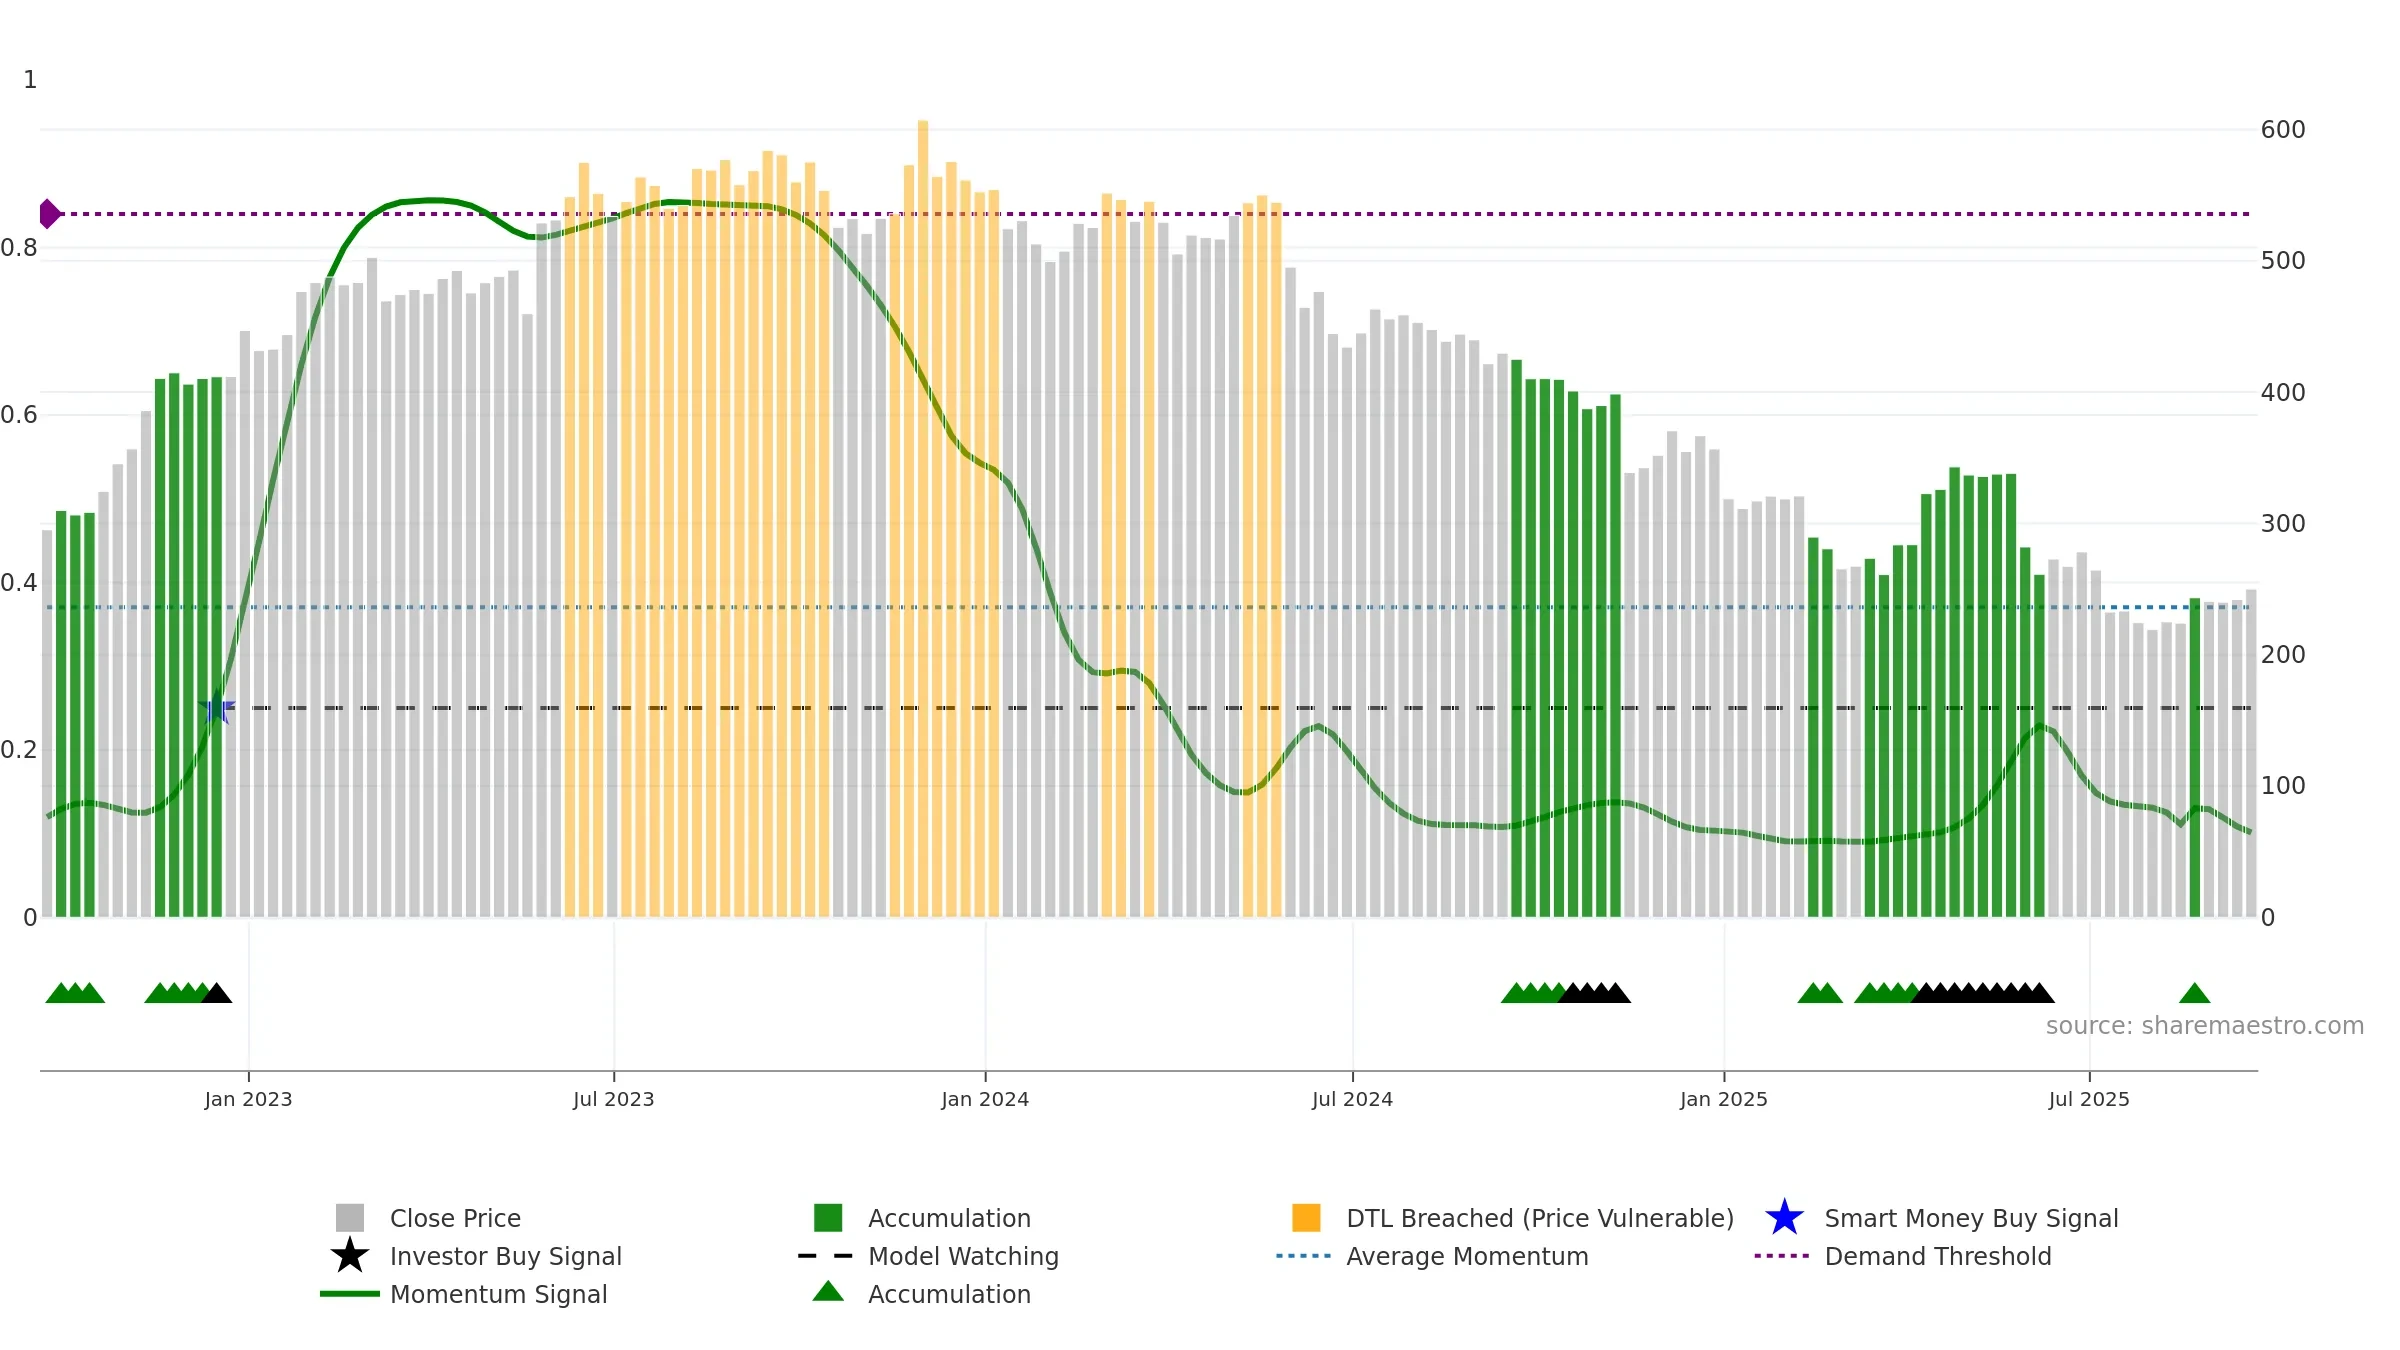
Weekly Report
B&M European Value Retail S.A. closed at 250.0000 (-1.96% WoW) . Data window ends Fri, 19 Sep 2025.
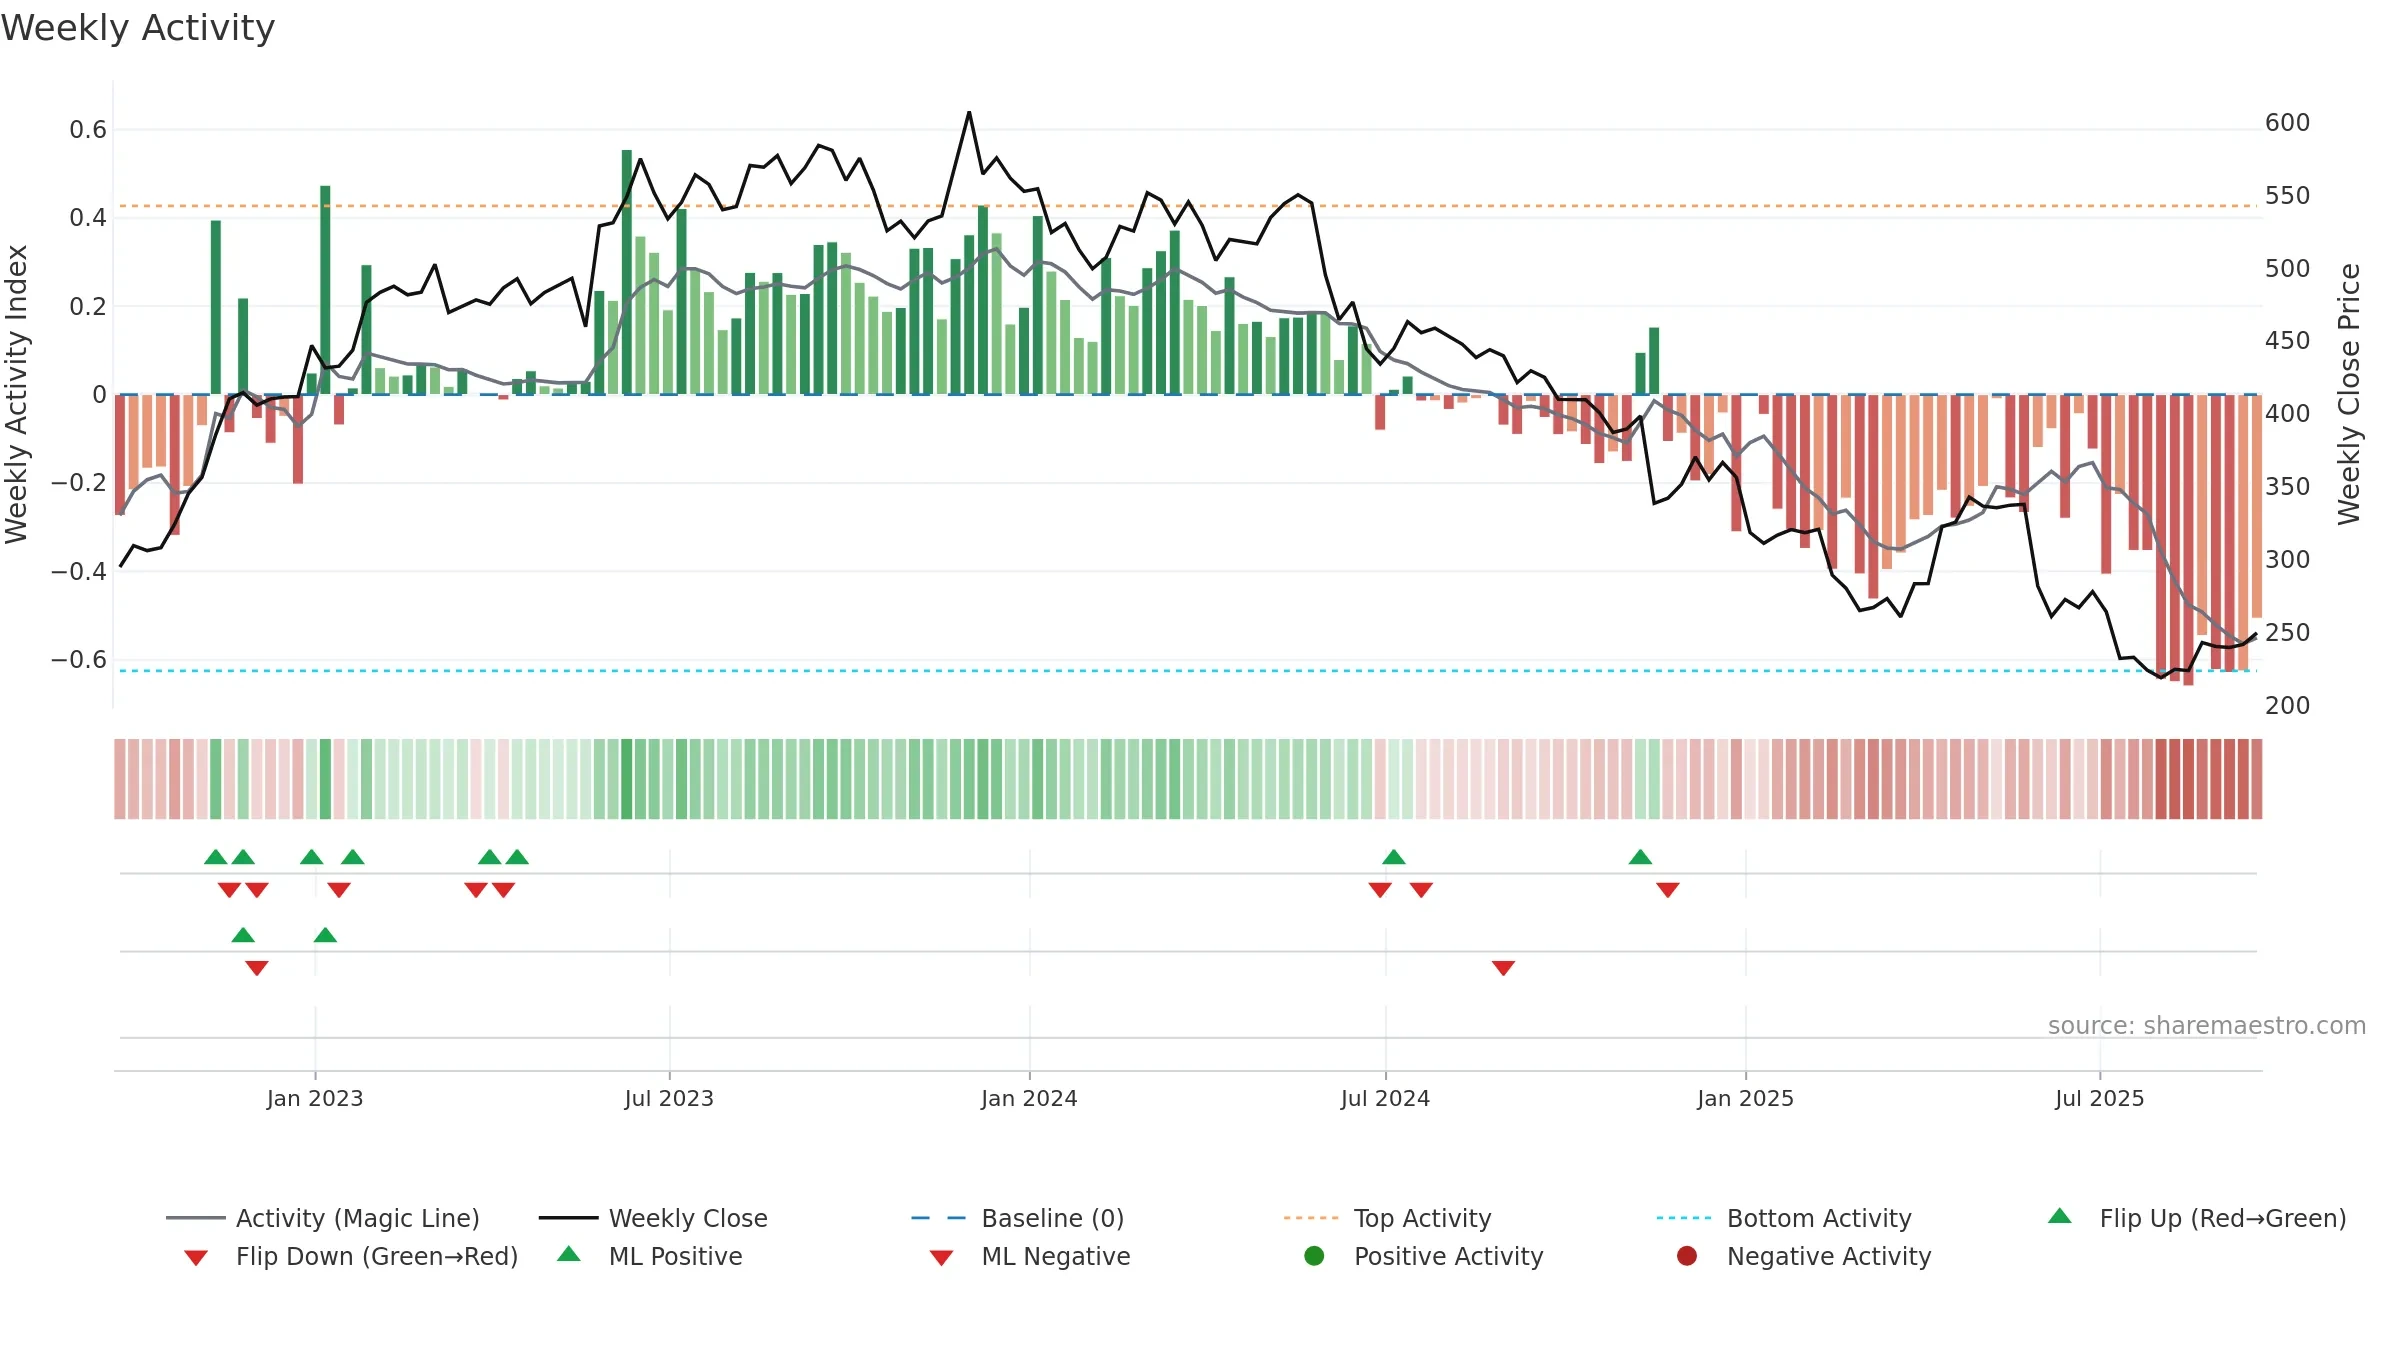
How to read this — Price slope is upward, indicating persistent buying over the window. Low weekly volatility favours steadier follow-through. Volume and price are moving in the same direction — a constructive confirmation.
Up-slope supports buying interest; pullbacks may be contained if activity stays firm.
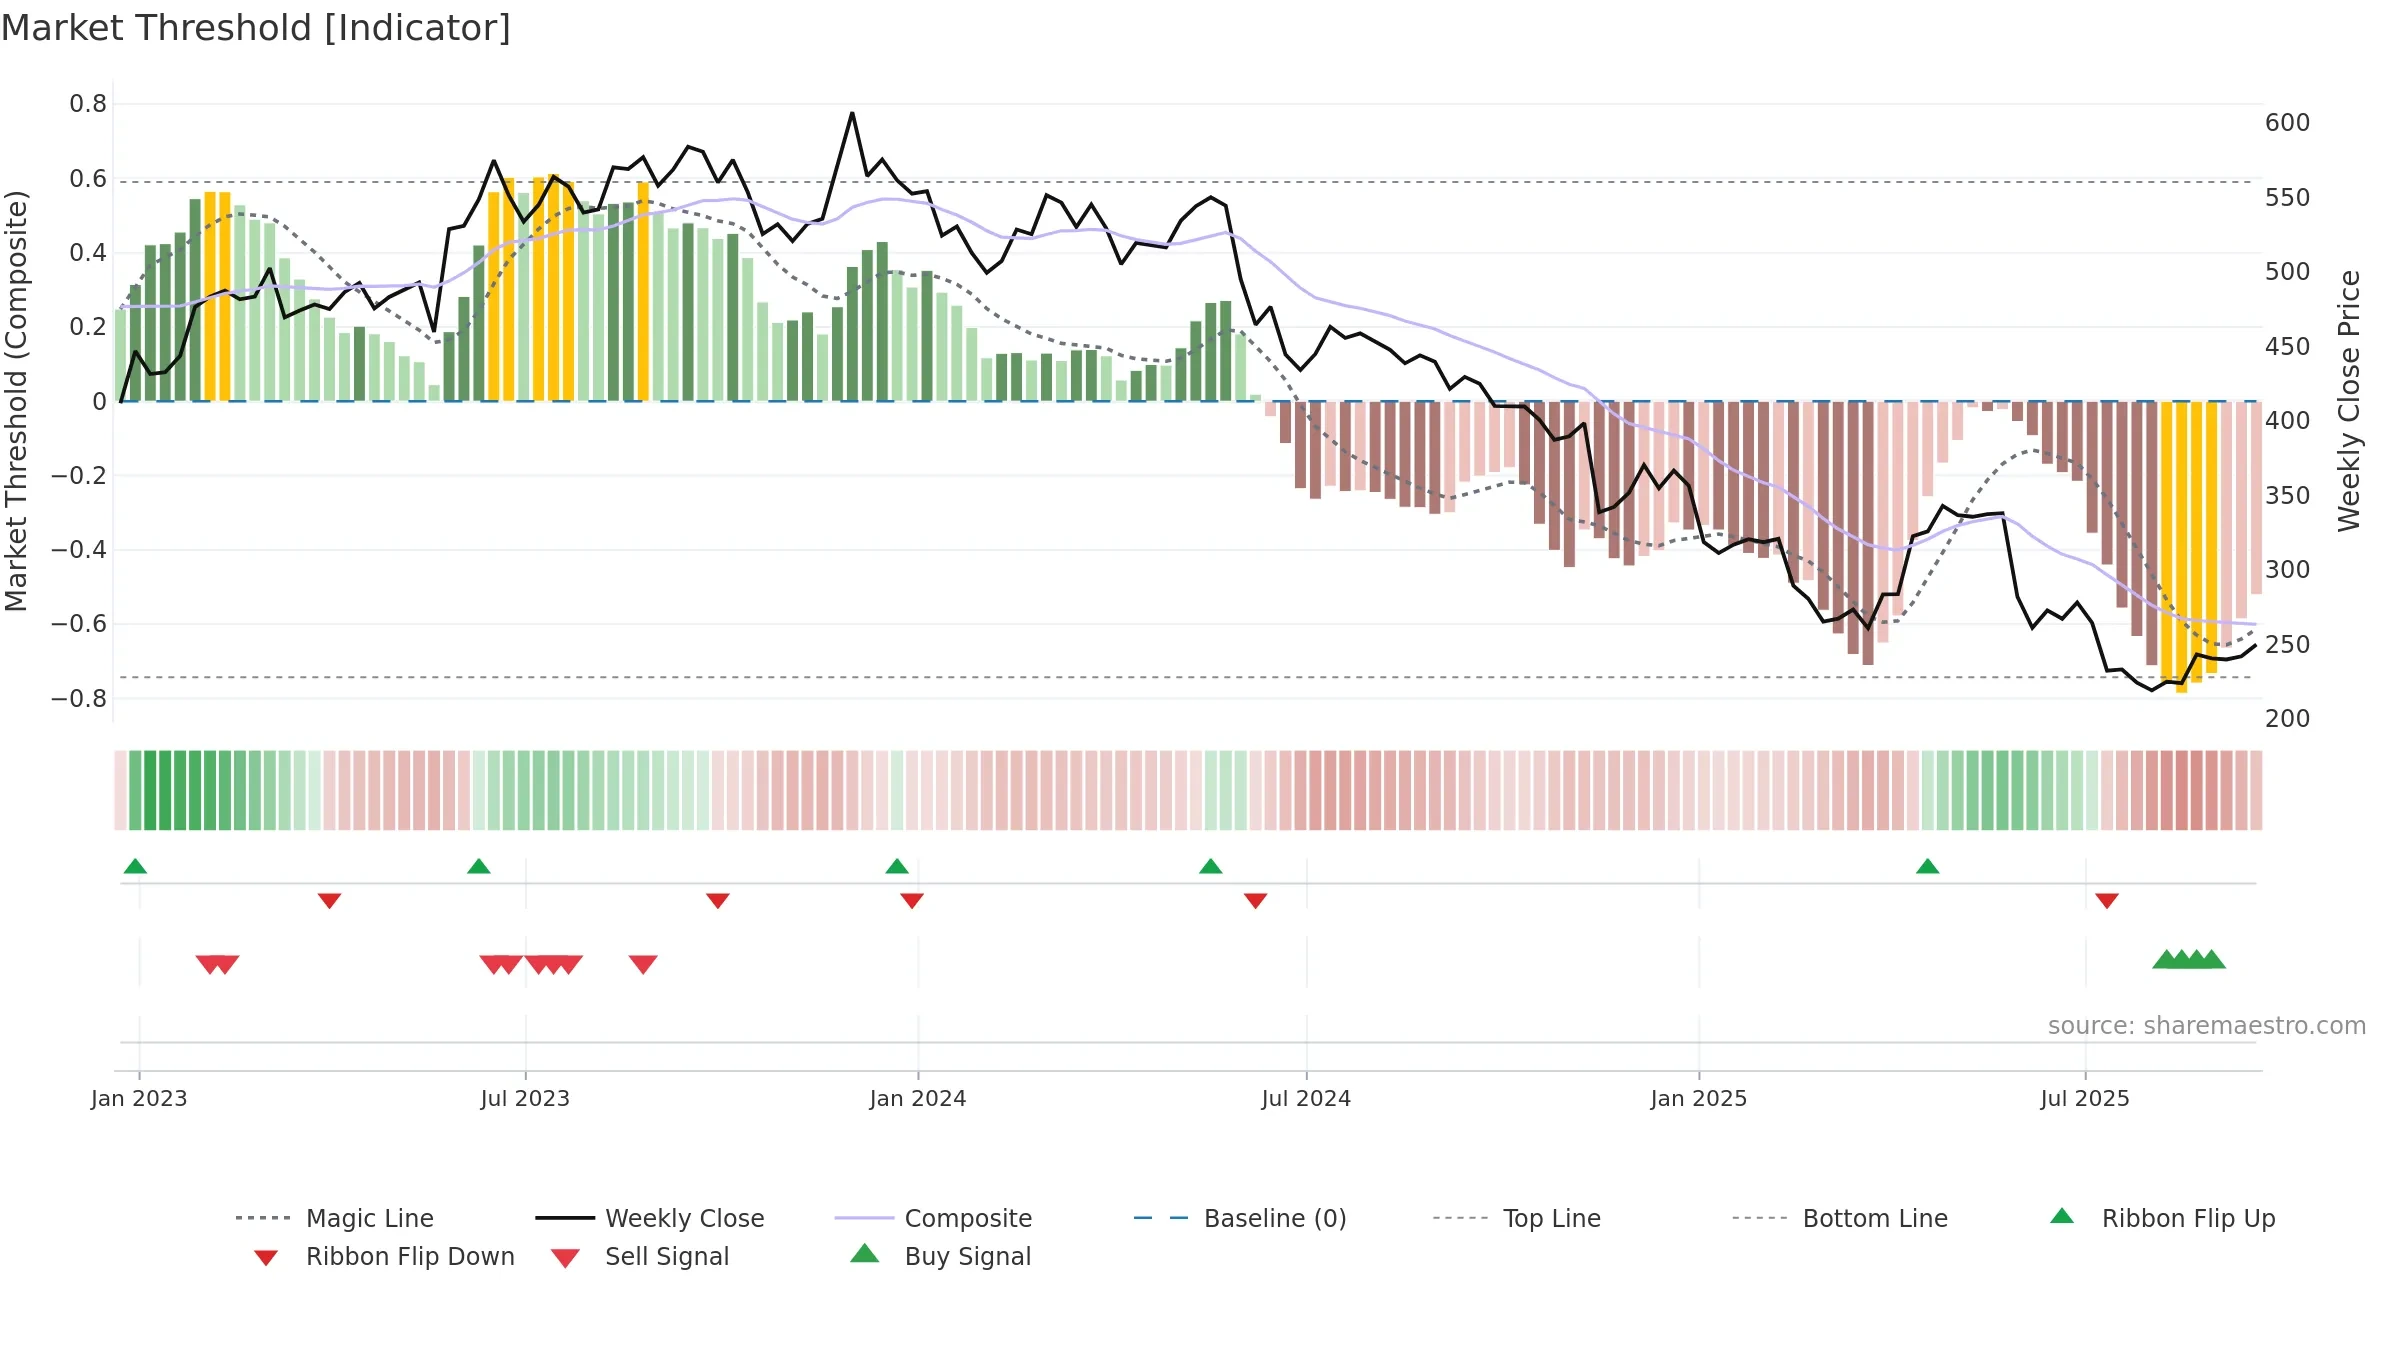
Gauge maps the trend signal to a 0–100 scale.
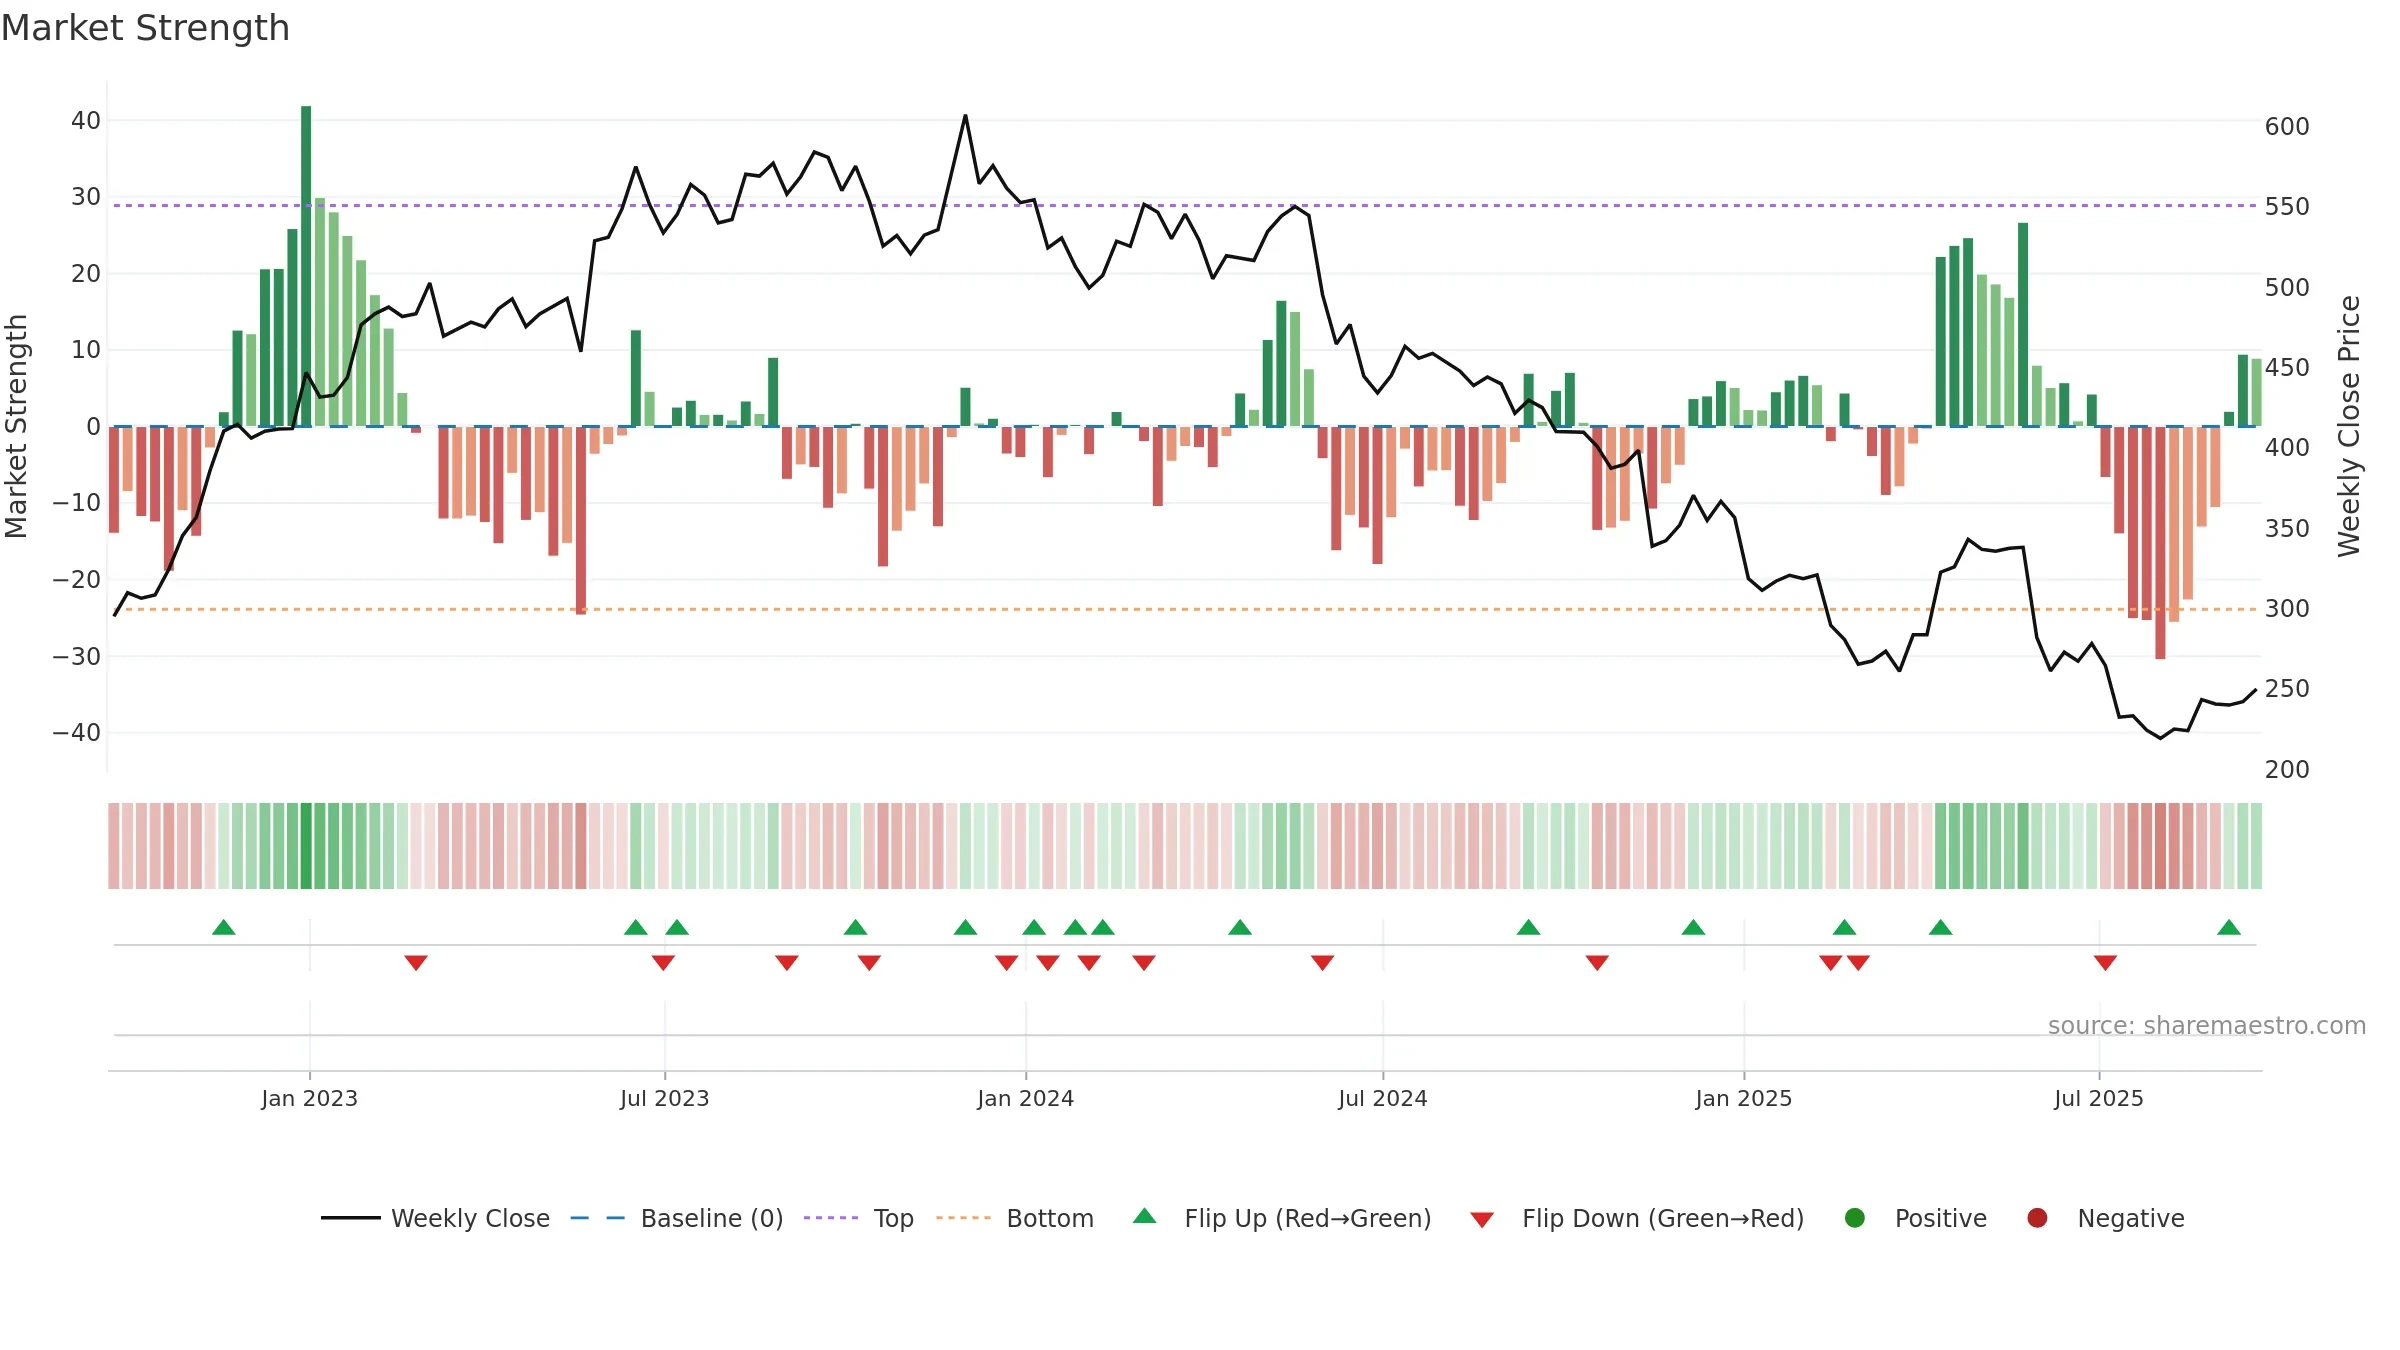
How to read this — Bearish zone with falling momentum — sellers in control.
Bias remains lower; rallies are suspect unless gauge reclaims 0.50/0.60.
The flag is positive: favourable upside skew with supportive conditions.
Conclusion
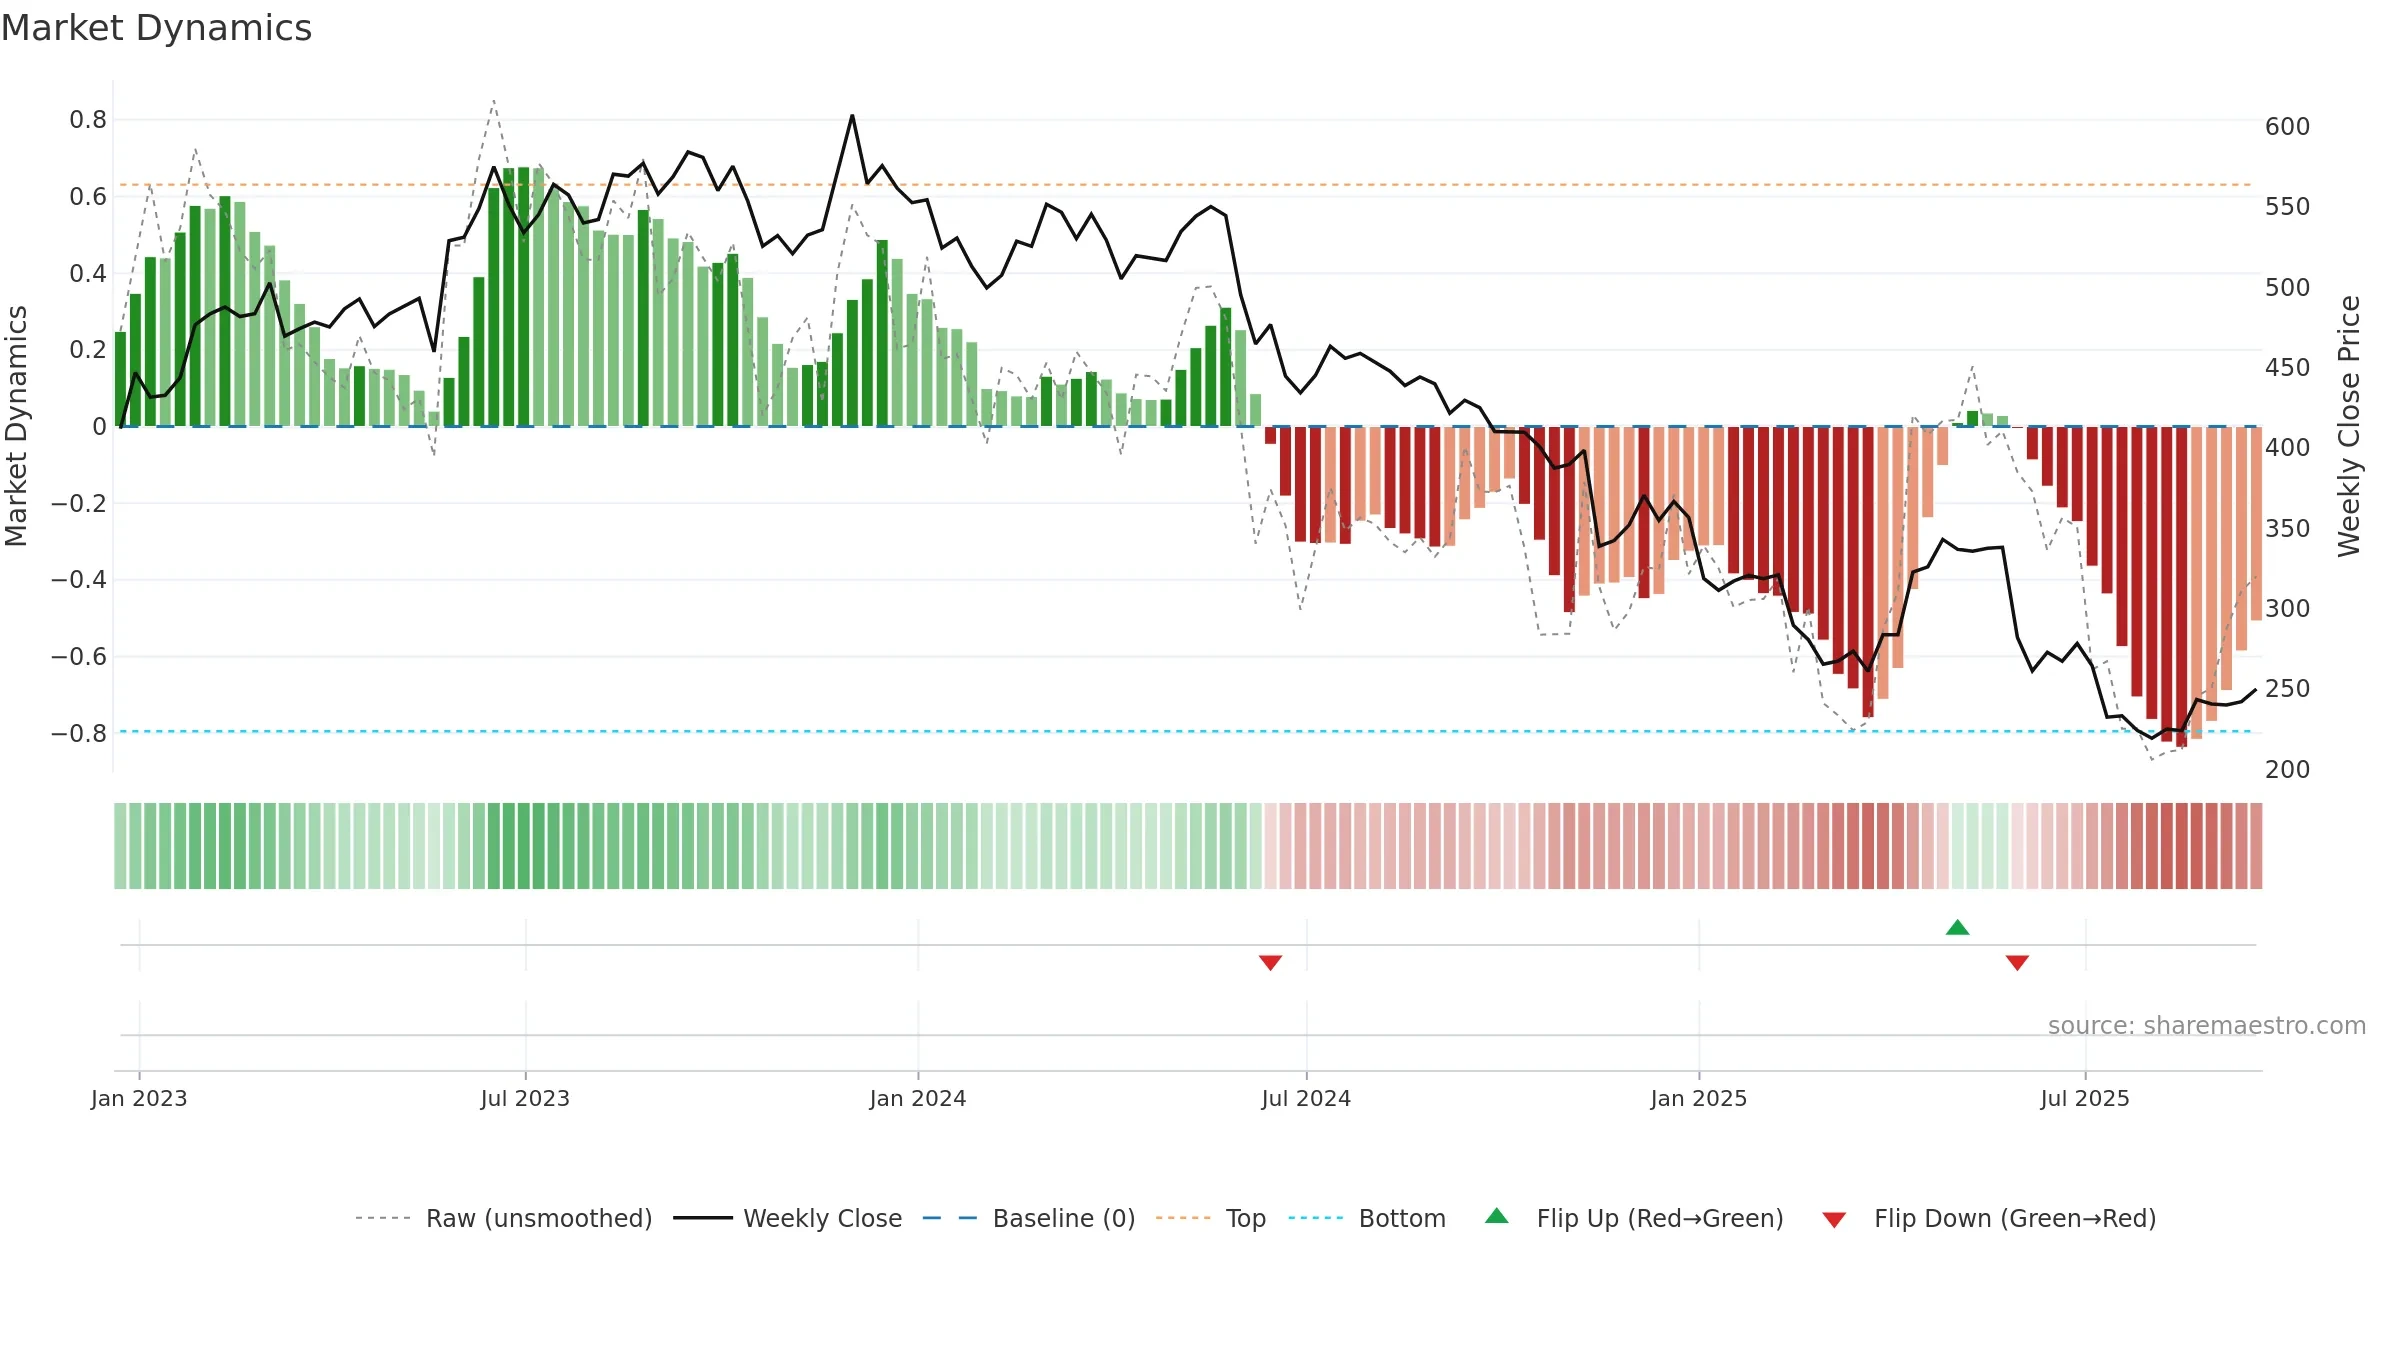
Negative setup. ★★☆☆☆ confidence. Price window: 14. Trend: Downtrend Confirmed; gauge 10. In combination, liquidity confirms the move.
- Liquidity confirms the price trend
- Low return volatility supports durability
- Solid multi-week performance
- Bearish control with falling momentum
- Momentum is weak/falling
- Price is not above key averages
Why: Price window 14.00% over 8w. Close is 2.71% above the prior-window high. Return volatility 1.82%. Volume trend rising. Liquidity convergence with price. Trend state downtrend confirmed. Low-regime (≤0.25) upticks 1/7 (14.0%) • Distributing. Momentum bearish and falling. Valuation stance positive.
Tip: Most metrics include a hover tooltip where they appear in the report.