Exponent, Inc.
EXPO NASDAQ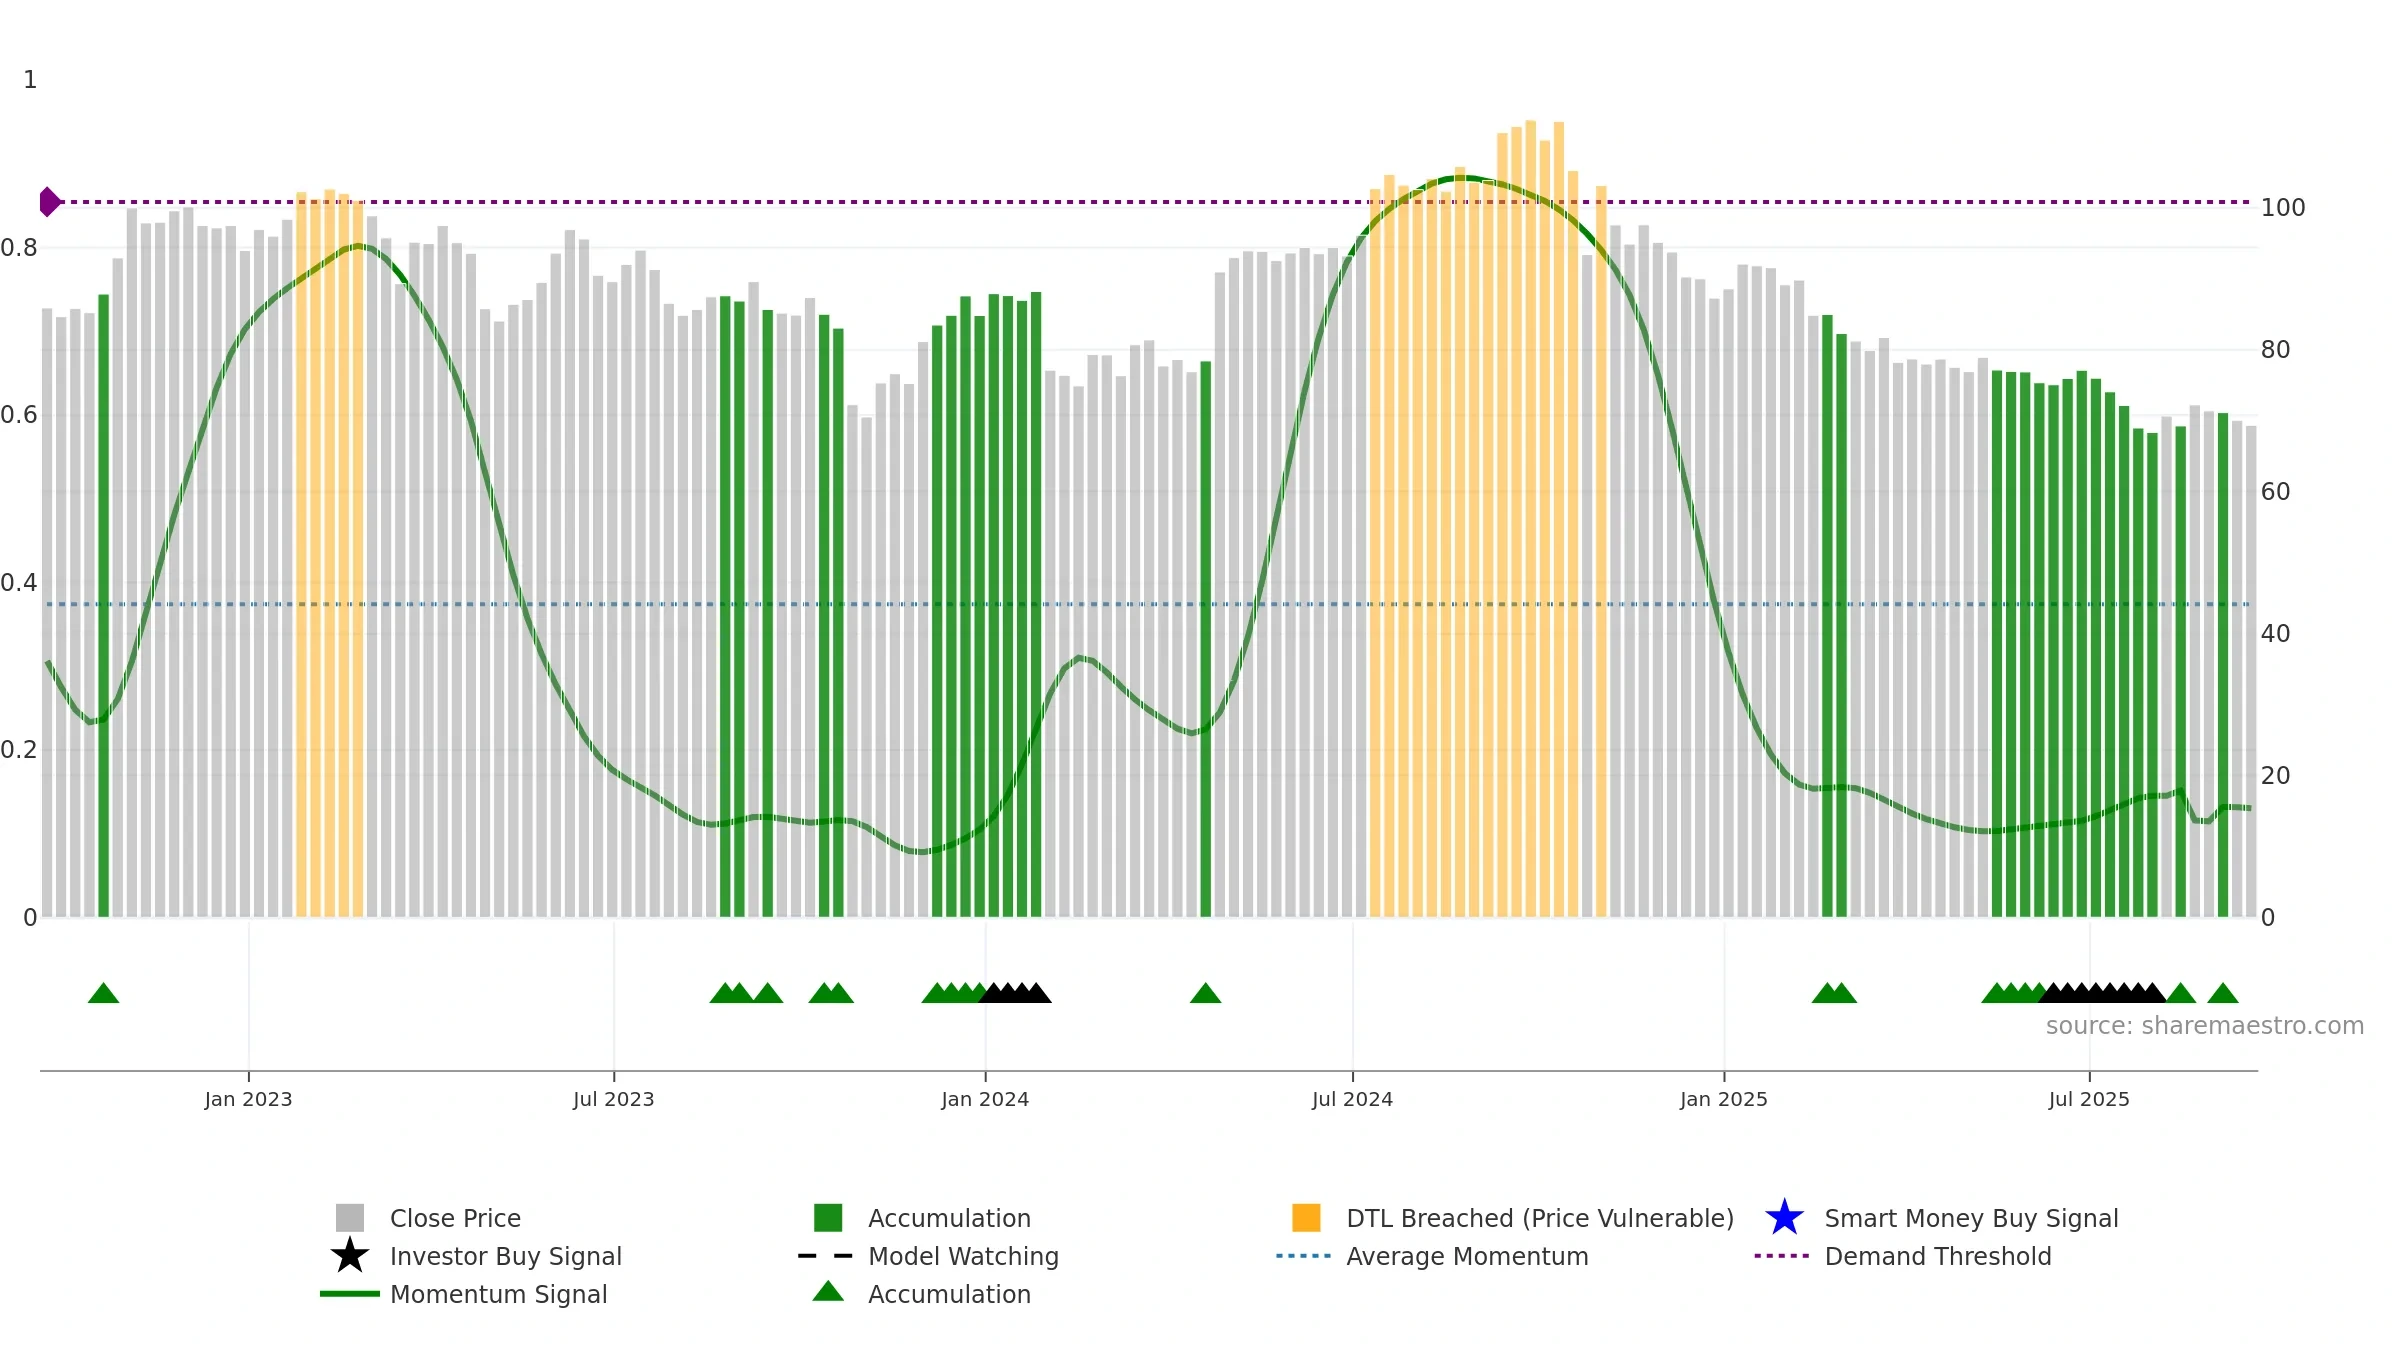
Weekly Report
Exponent, Inc. closed at 69.3400 (-1.67% WoW) . Data window ends Fri, 19 Sep 2025.
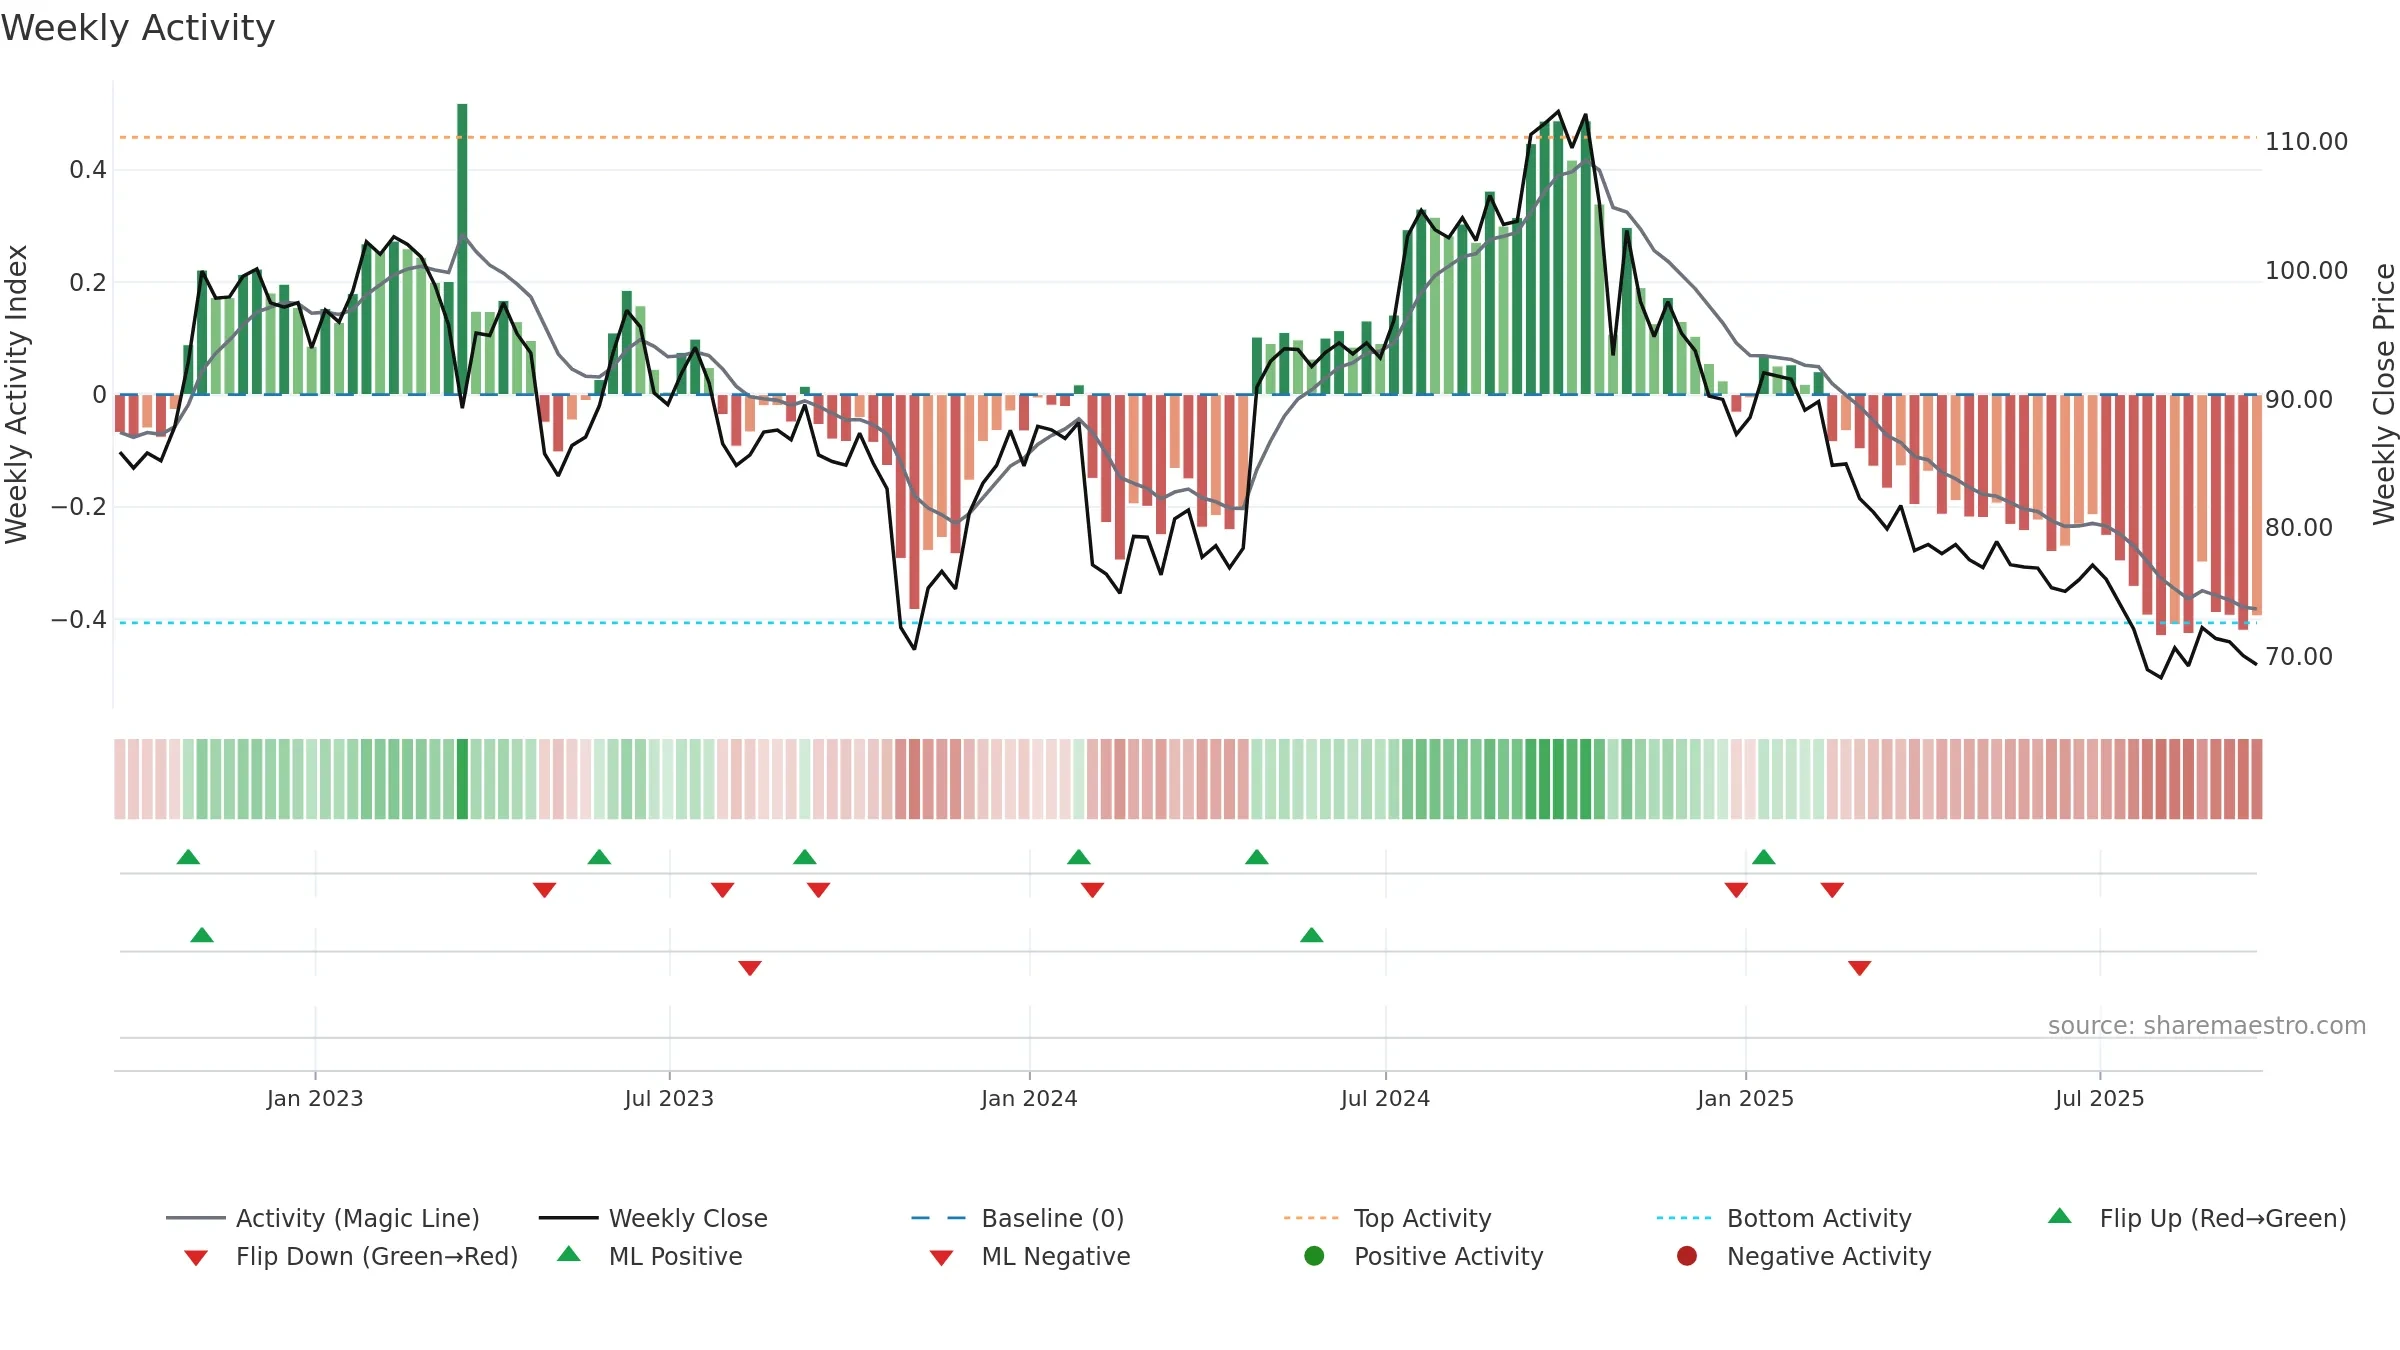
How to read this — Price slope is upward, indicating persistent buying over the window. Low weekly volatility favours steadier follow-through. Volume and price are moving in the same direction — a constructive confirmation. Returns are positively correlated with volume — strength tends to arrive on higher activity. Price sits below key averages, keeping pressure on the tape.
Up-slope supports buying interest; pullbacks may be contained if activity stays firm.
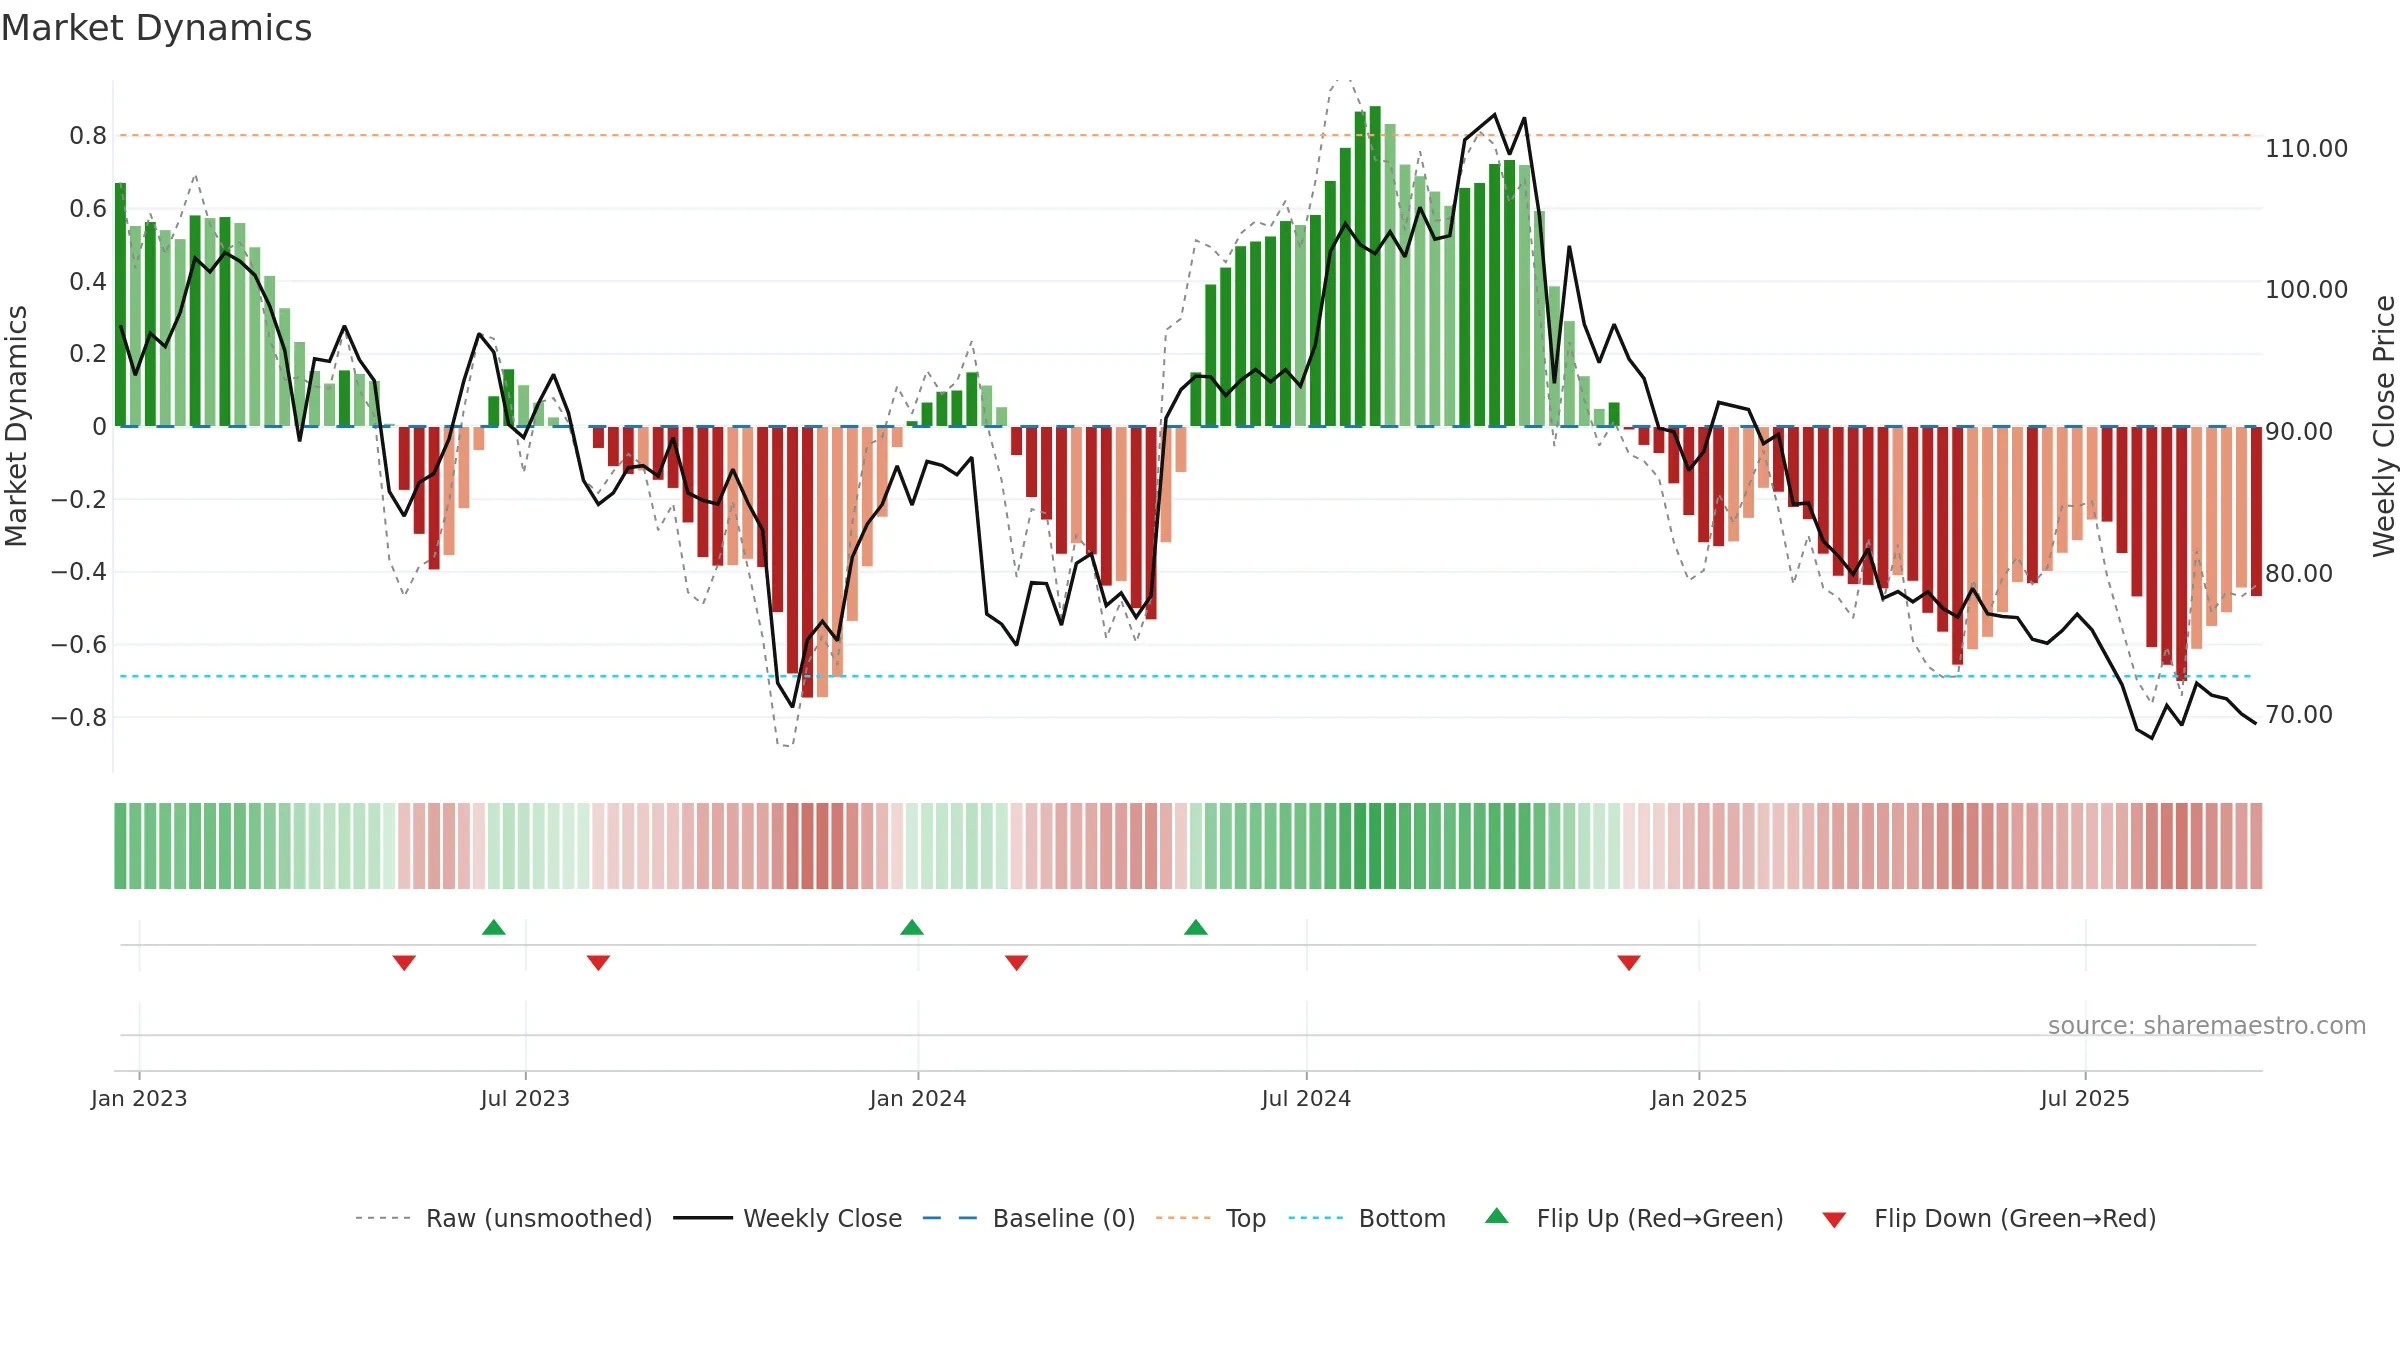
Gauge maps the trend signal to a 0–100 scale.
How to read this — Range-bound conditions; conviction is limited until a break or acceleration emerges.
Wait for a directional break or improving acceleration.
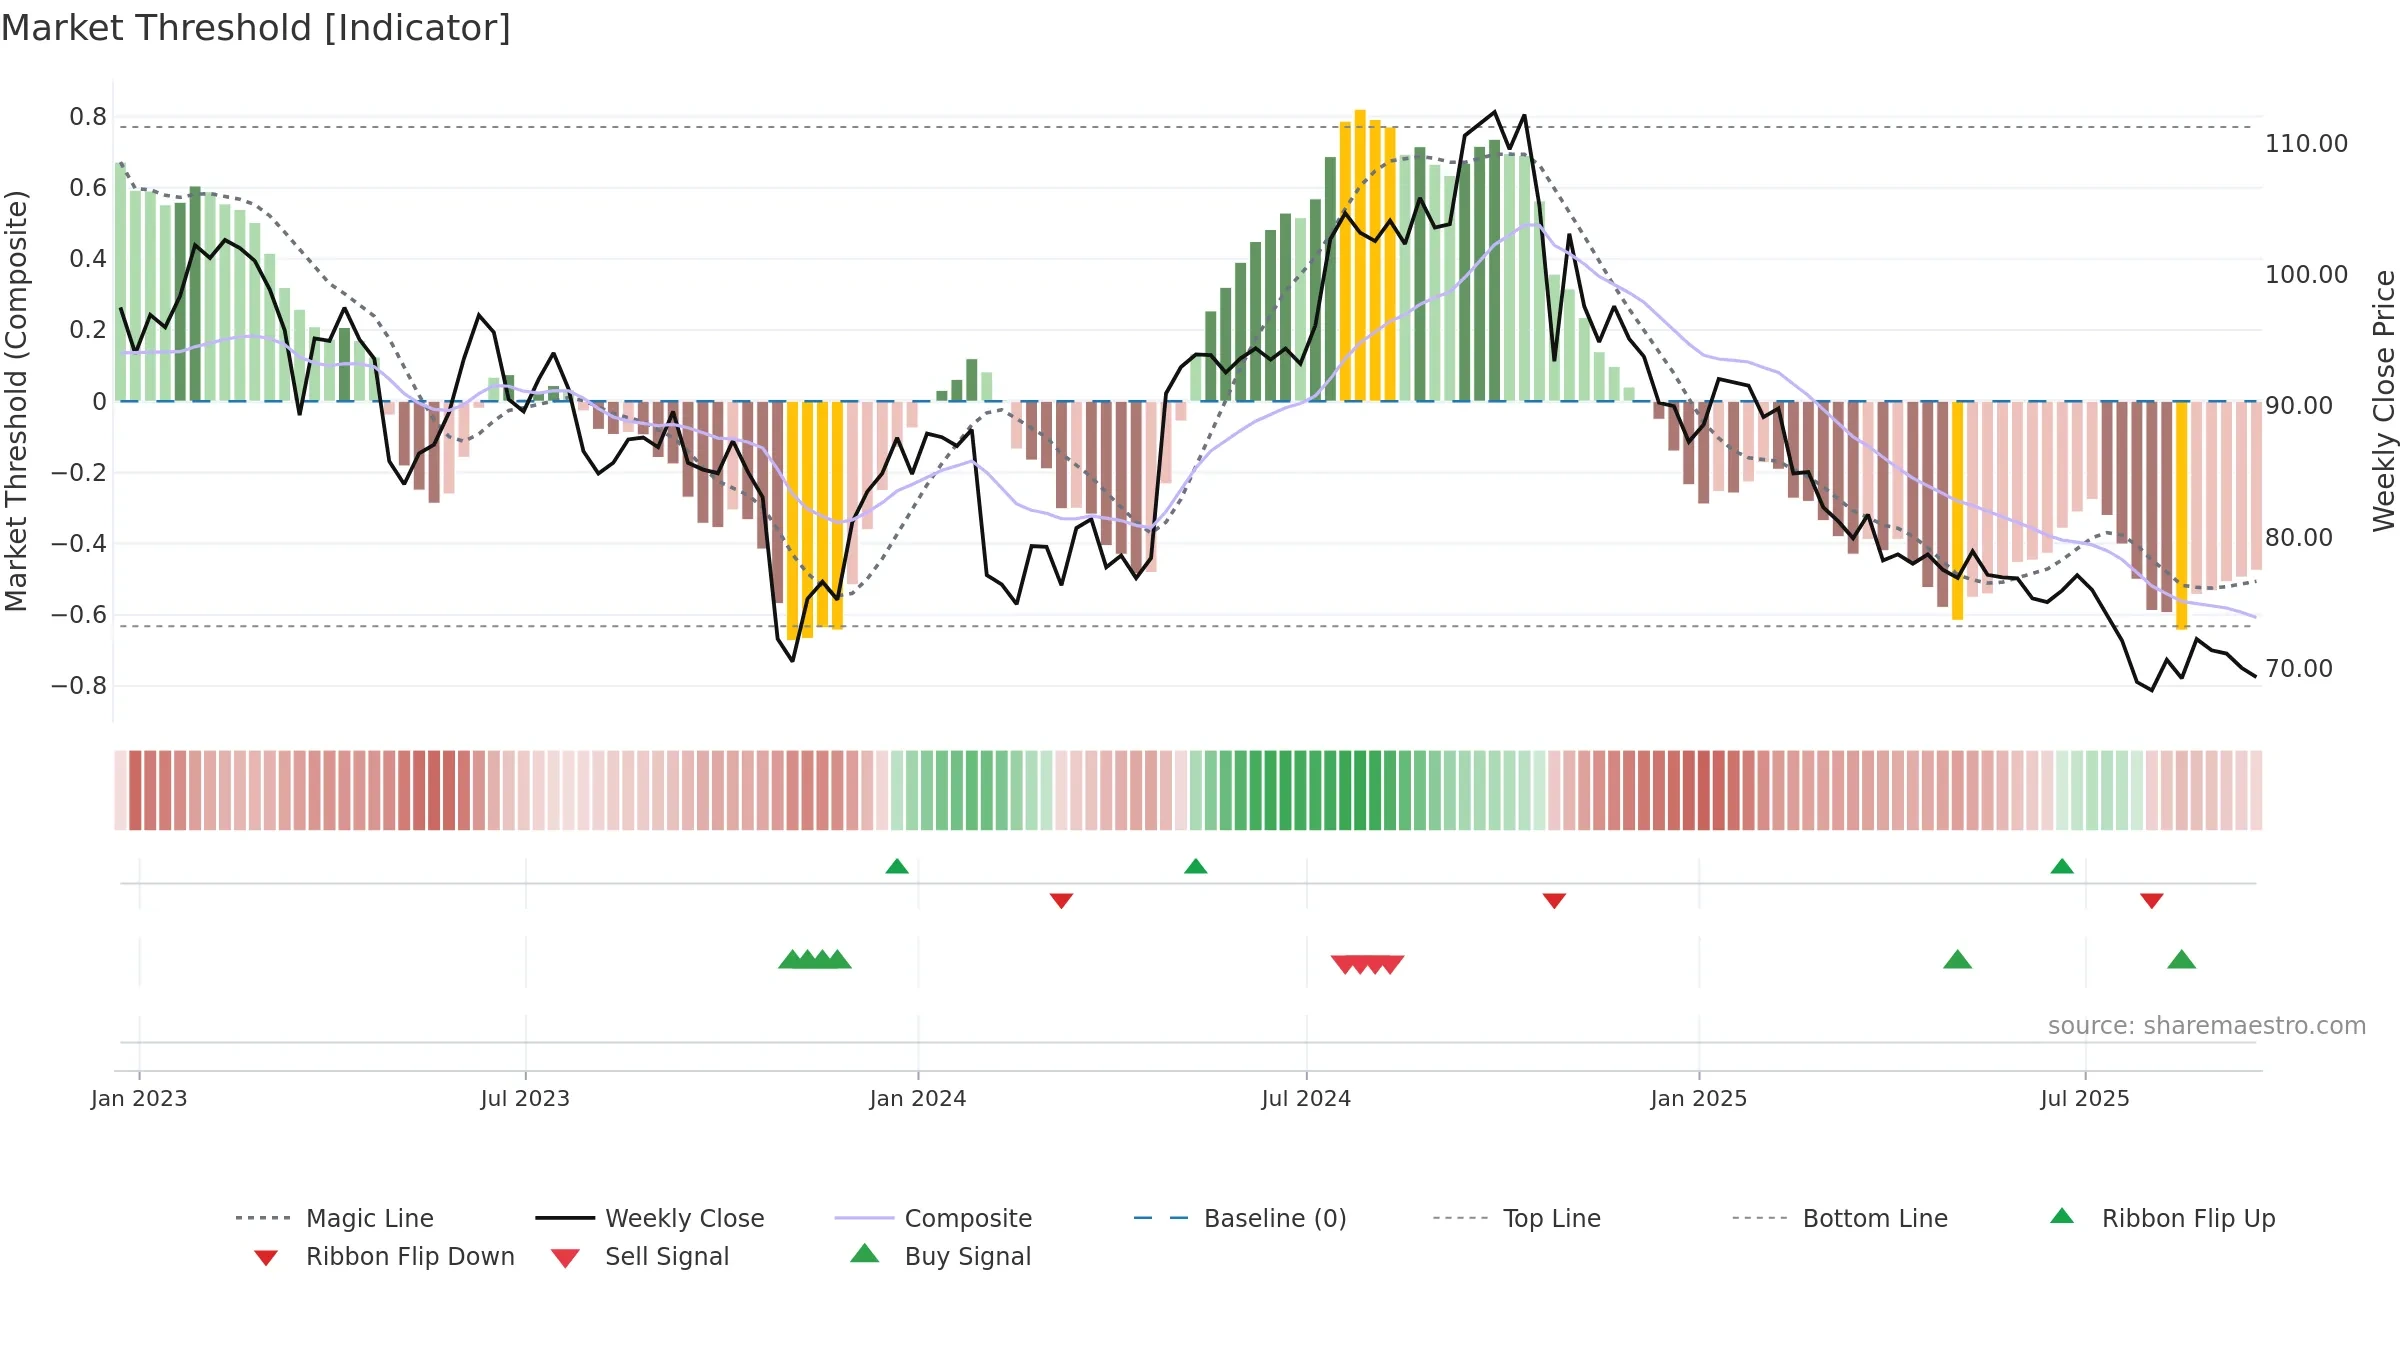
Price is above fair value; upside may be capped without catalysts.
Conclusion
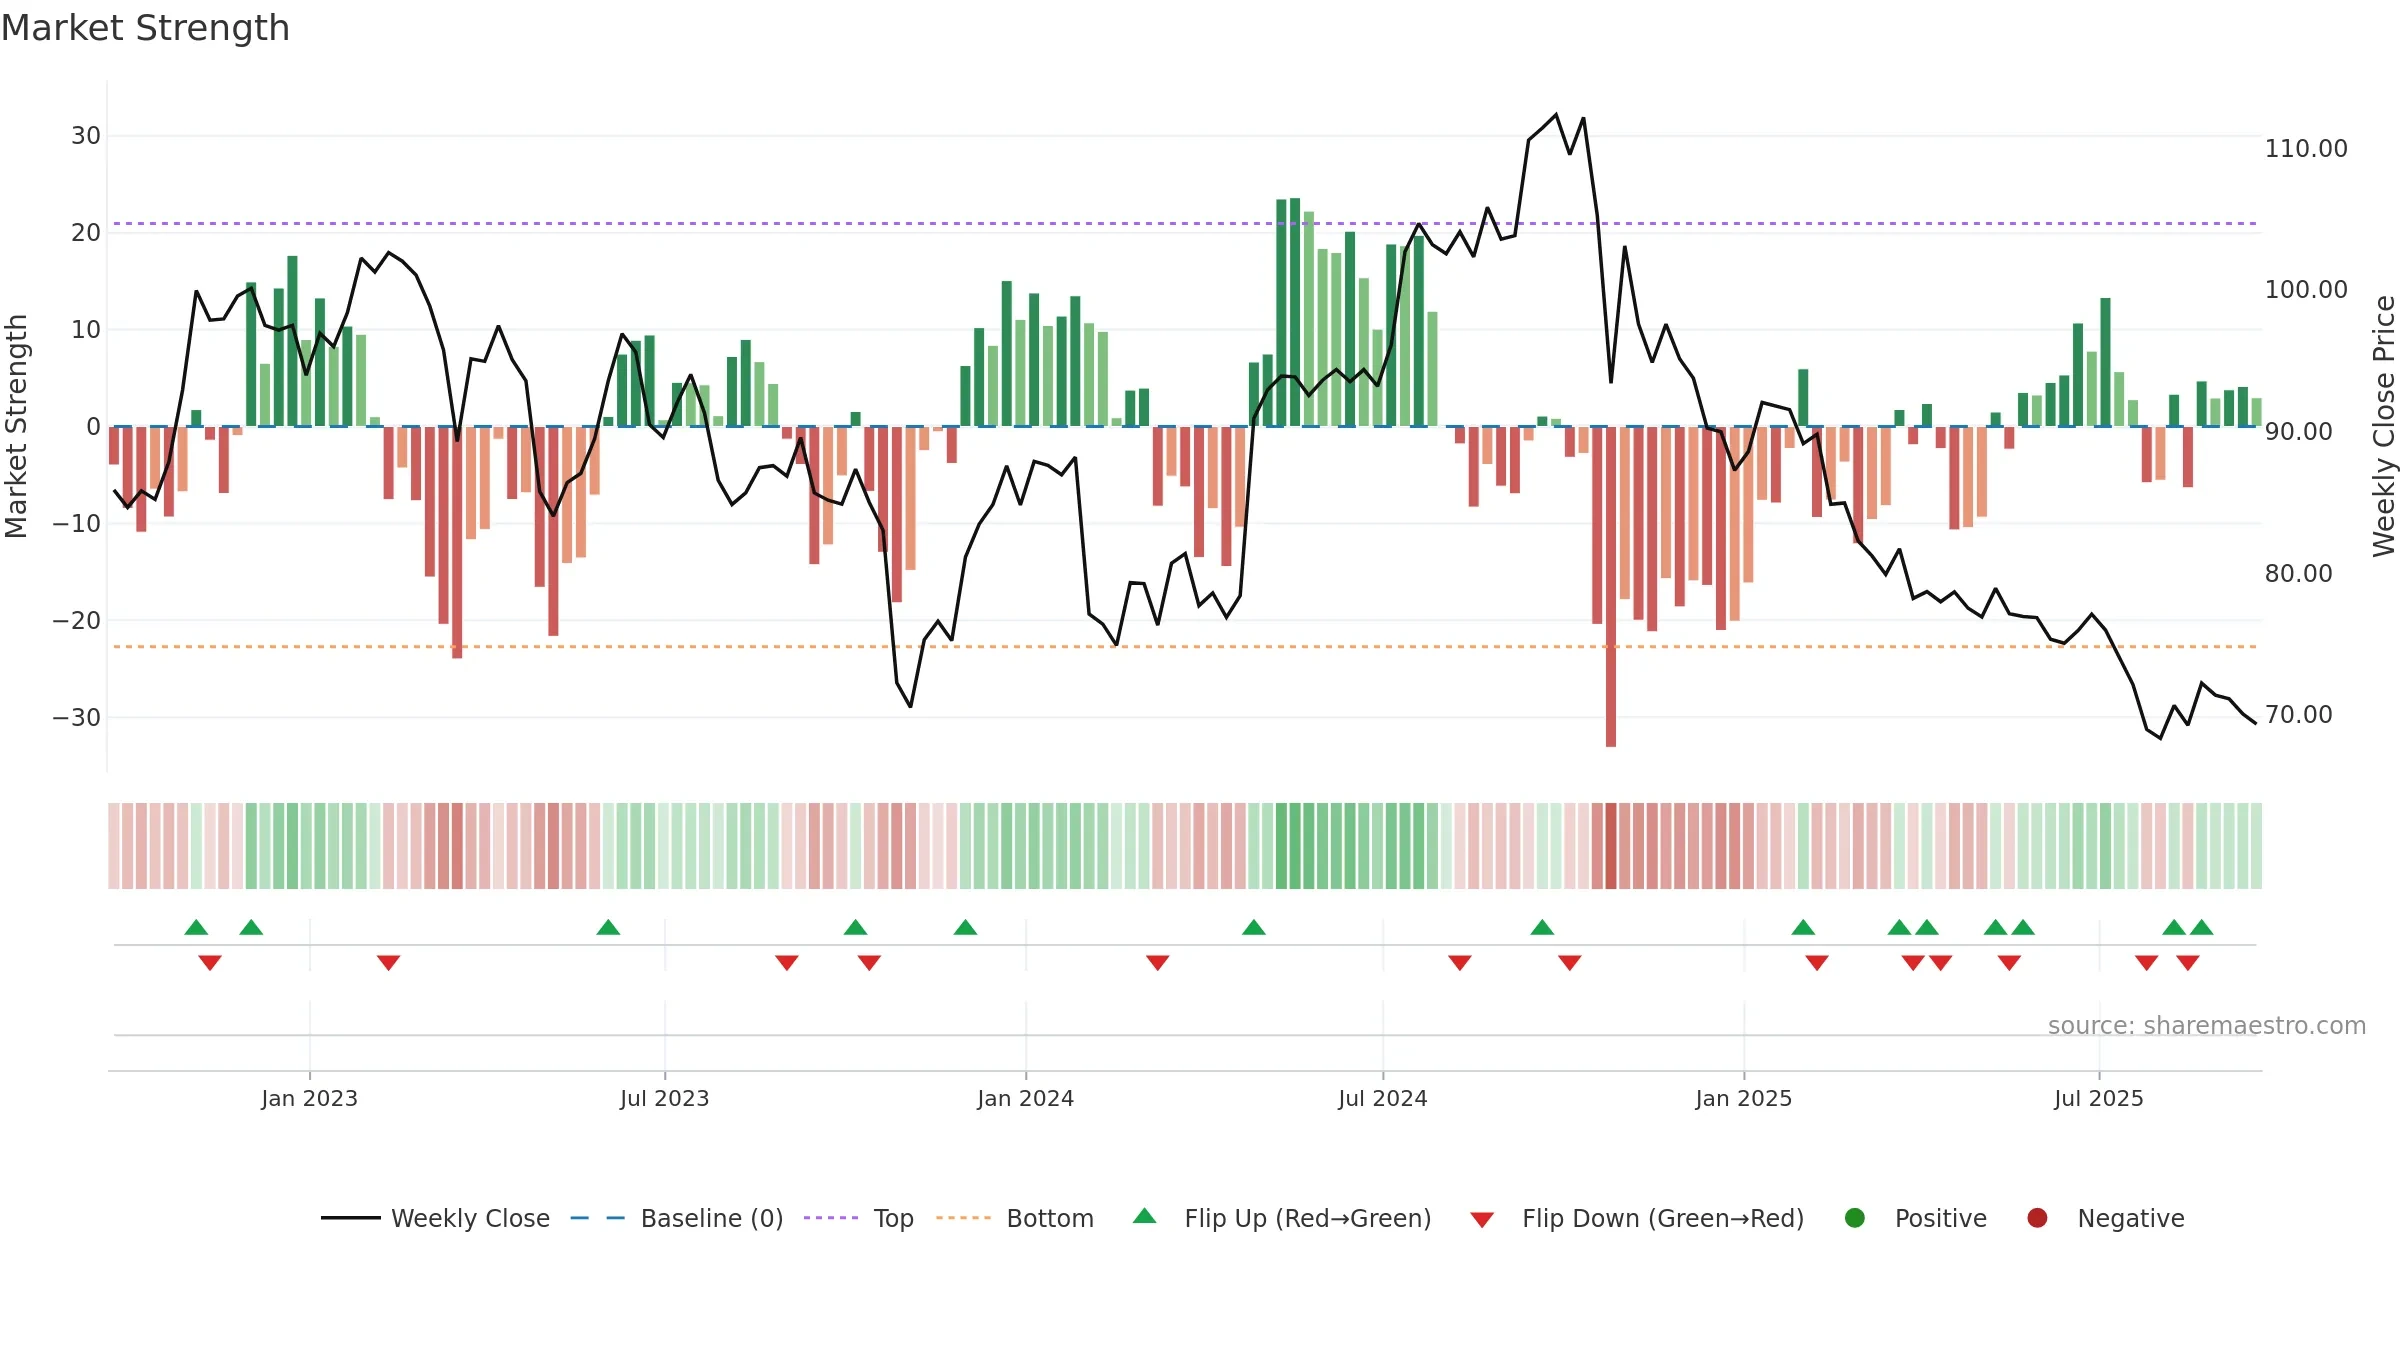
Negative setup. ★★☆☆☆ confidence. Price window: 1. Trend: Range / Neutral; gauge 13. In combination, liquidity confirms the move.
- Liquidity confirms the price trend
- Low return volatility supports durability
- Momentum is weak/falling
- Price is not above key averages
Why: Price window 1.48% over 8w. Close is -4.00% below the prior-window high. Return volatility 1.30%. Volume trend rising. Liquidity convergence with price. Trend state range / neutral. Low-regime (≤0.25) upticks 2/7 (29.0%) • Distributing. Momentum bearish and falling. Valuation limited upside without catalysts.
Tip: Most metrics include a hover tooltip where they appear in the report.