Zhejiang Huayou Cobalt Co., Ltd
603799 SHA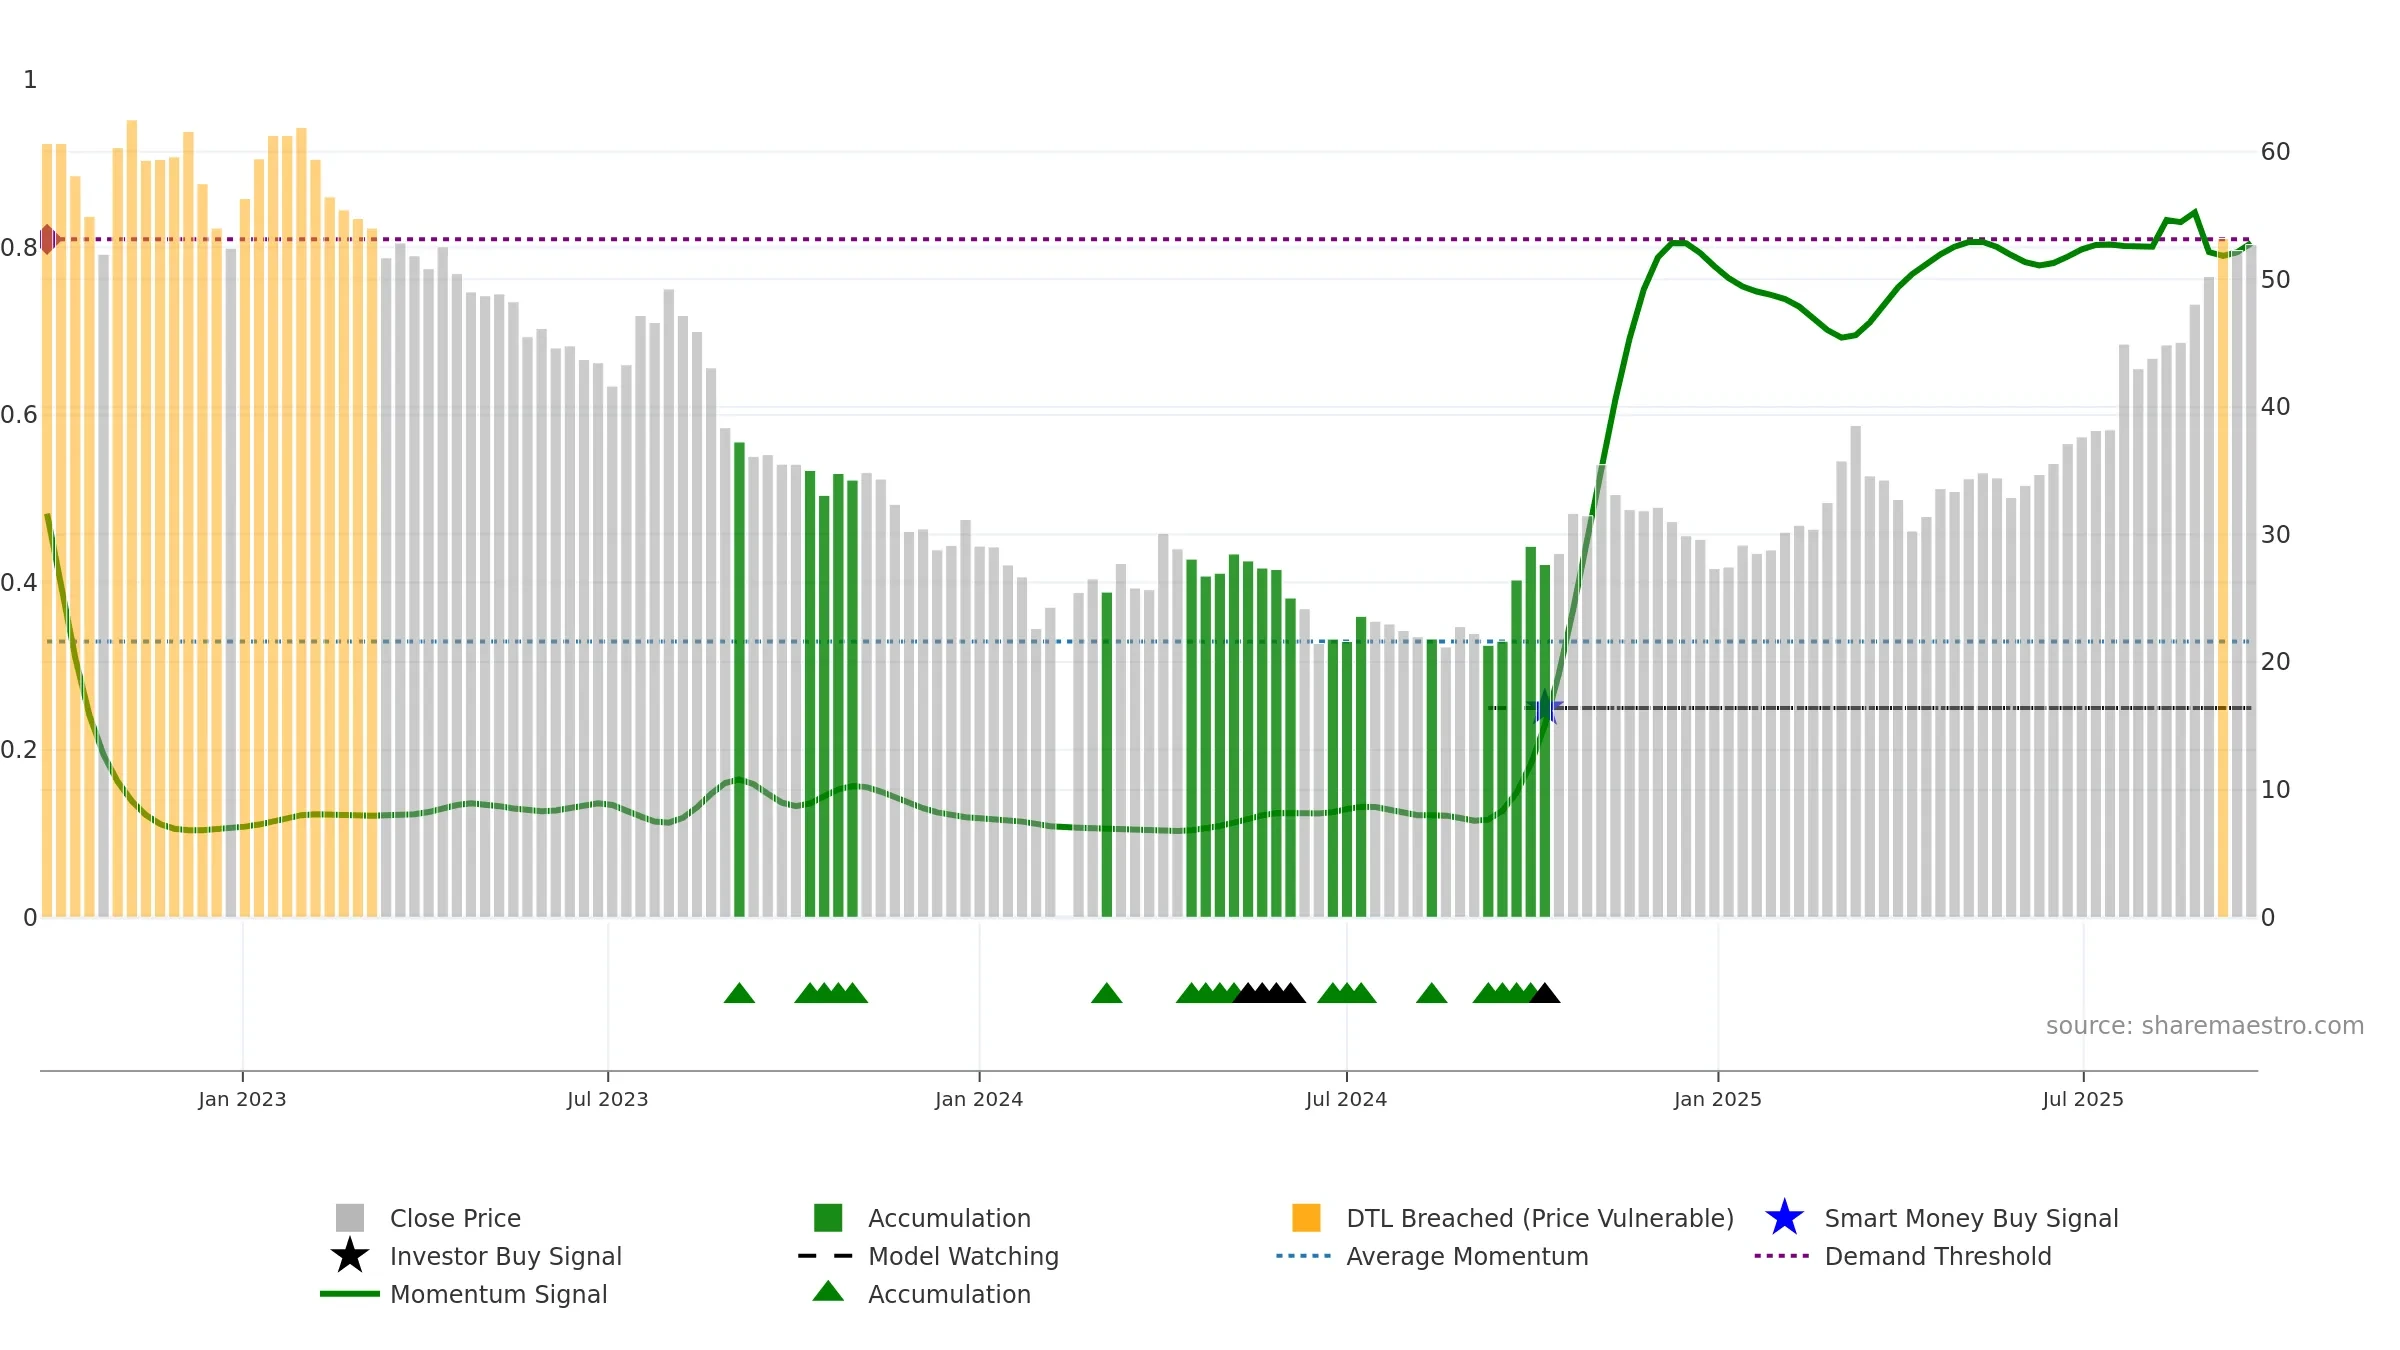
Weekly Summary
Zhejiang Huayou Cobalt Co., Ltd closed at 52.7200 (-2.33% WoW) . Data window ends Mon, 22 Sep 2025.
How to read this — Price slope is upward, indicating persistent buying over the window. Volume trend diverges from price — watch for fatigue or rotation. Constructive MA stack supports the up-drift; pullbacks may find support at the 8–13 week region. Price holds above key averages, indicating constructive participation.
Up-slope supports buying interest; pullbacks may be contained if activity stays firm. Because liquidity isn’t confirming, prefer evidence of fresh demand before chasing moves.
Gauge maps the trend signal to a 0–100 scale.
How to read this — Gauge is elevated but momentum is rolling over; topping risk is rising.
Stay alert: protect gains or seek confirmation before adding risk.

Relative strength is Positive
(> 0%, outperforming).
Latest MRS: 22.75% (week ending Fri, 19 Sep 2025).
Slope: Rising over 8w.
Notes:
- Holding above the zero line indicates relative bid.
- MRS slope rising over ~8 weeks.
Price is above fair value; upside may be capped without catalysts.
Conclusion
Negative setup. ★★⯪☆☆ confidence. Trend: Uptrend at Risk · 20.34% over window · vol 2.26% · liquidity divergence · posture above · RS outperforming · leaning negative
- Price holds above 8–26 week averages
- Constructive moving-average stack
- Solid multi-week performance
- Mansfield RS: outperforming & rising
- High level but momentum rolling over (topping risk)
- Momentum is weak/falling
- Liquidity diverges from price
Why: Price window 20.34% over w. Close is -0.90% below the prior-window high. Return volatility 2.26%. Volume trend falling. Liquidity divergence with price. Trend state uptrend at risk. MA stack constructive. Momentum bullish and falling. Valuation limited upside without catalysts.
Tip: Most metrics include a hover tooltip where they appear in the report.