OPAL Fuels Inc.
OPAL NASDAQ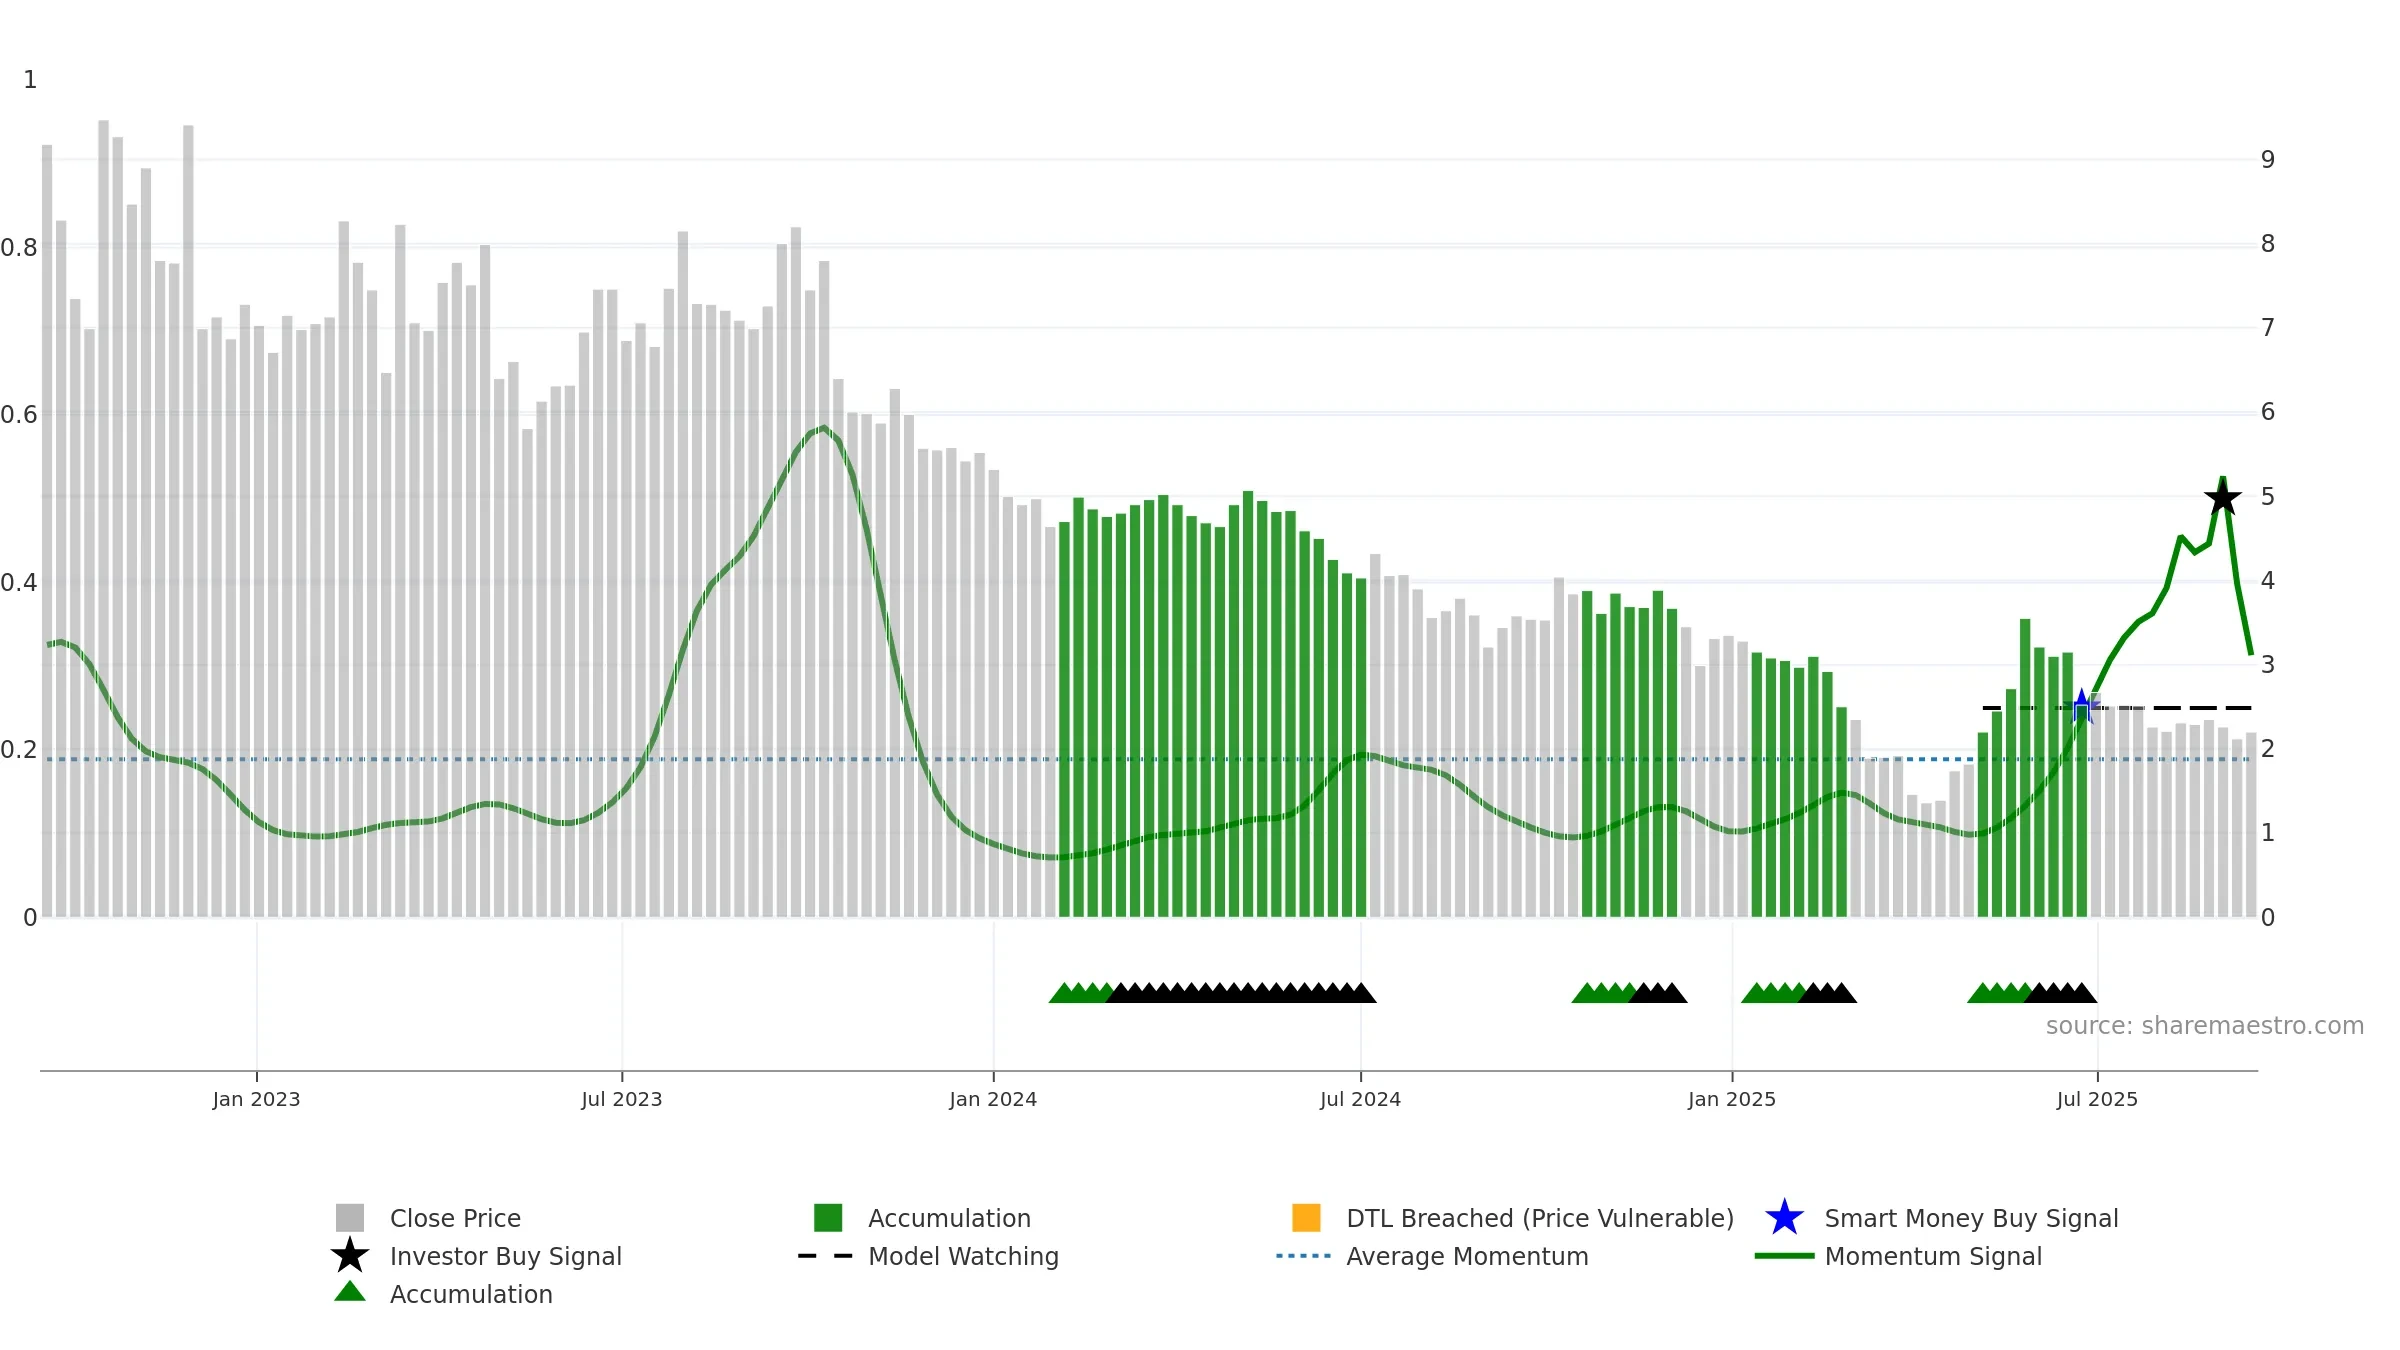
Weekly Report
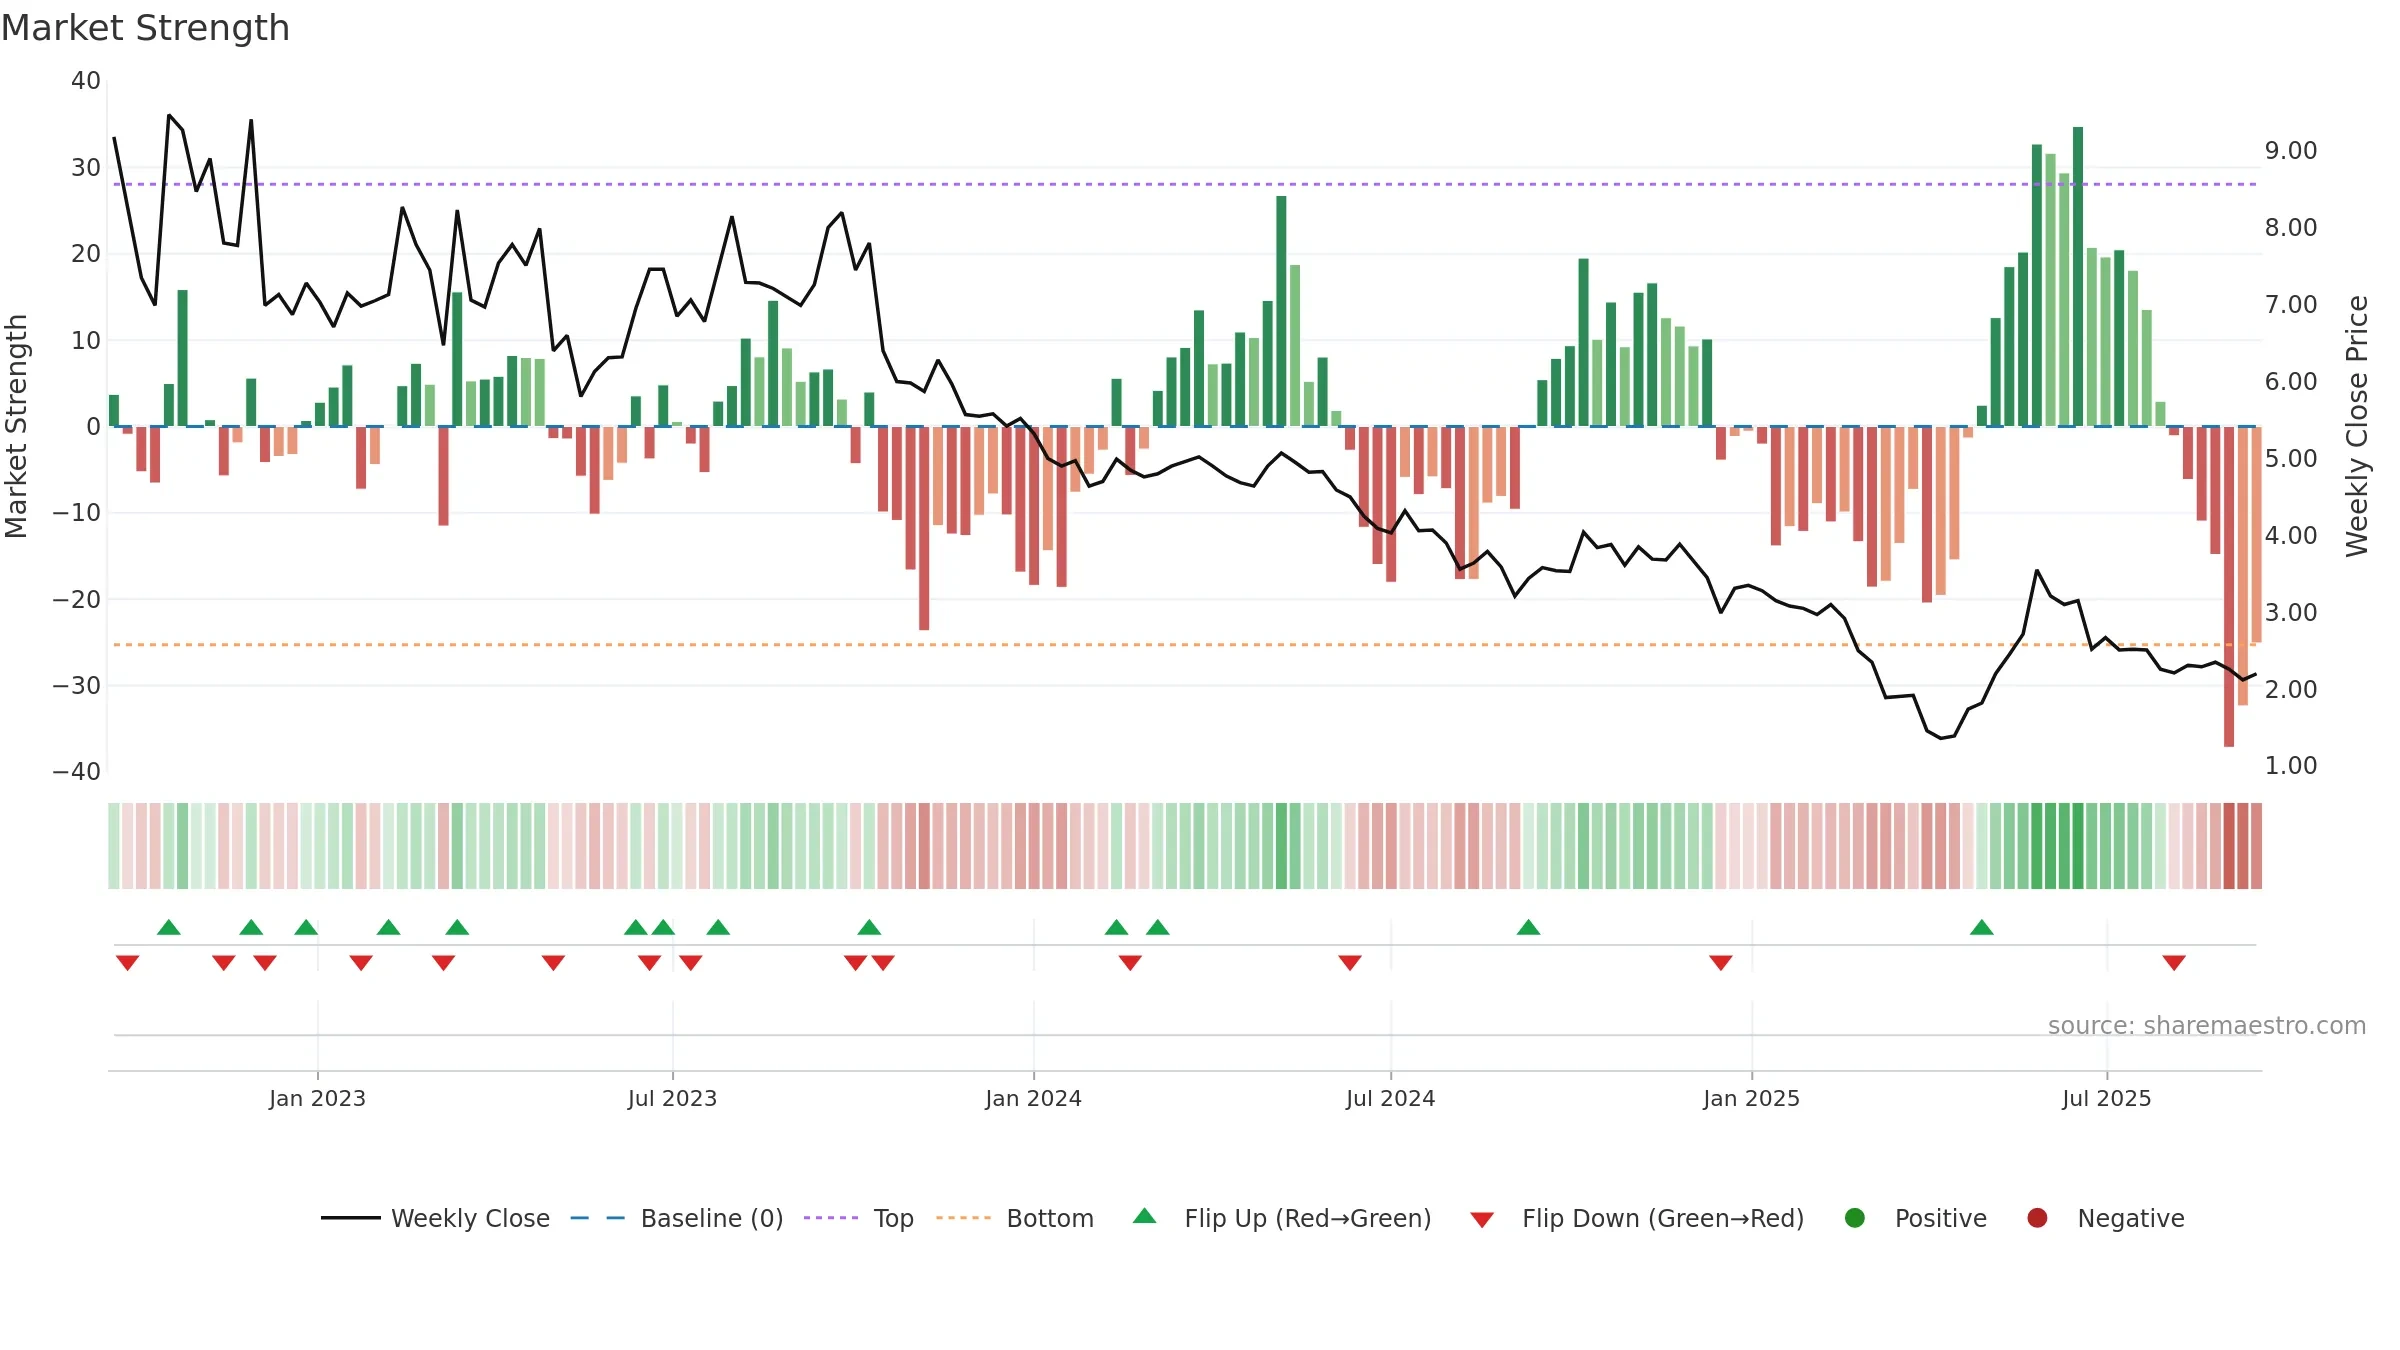
OPAL Fuels Inc. closed at 2.2000 (3.77% WoW) . Data window ends Mon, 15 Sep 2025.
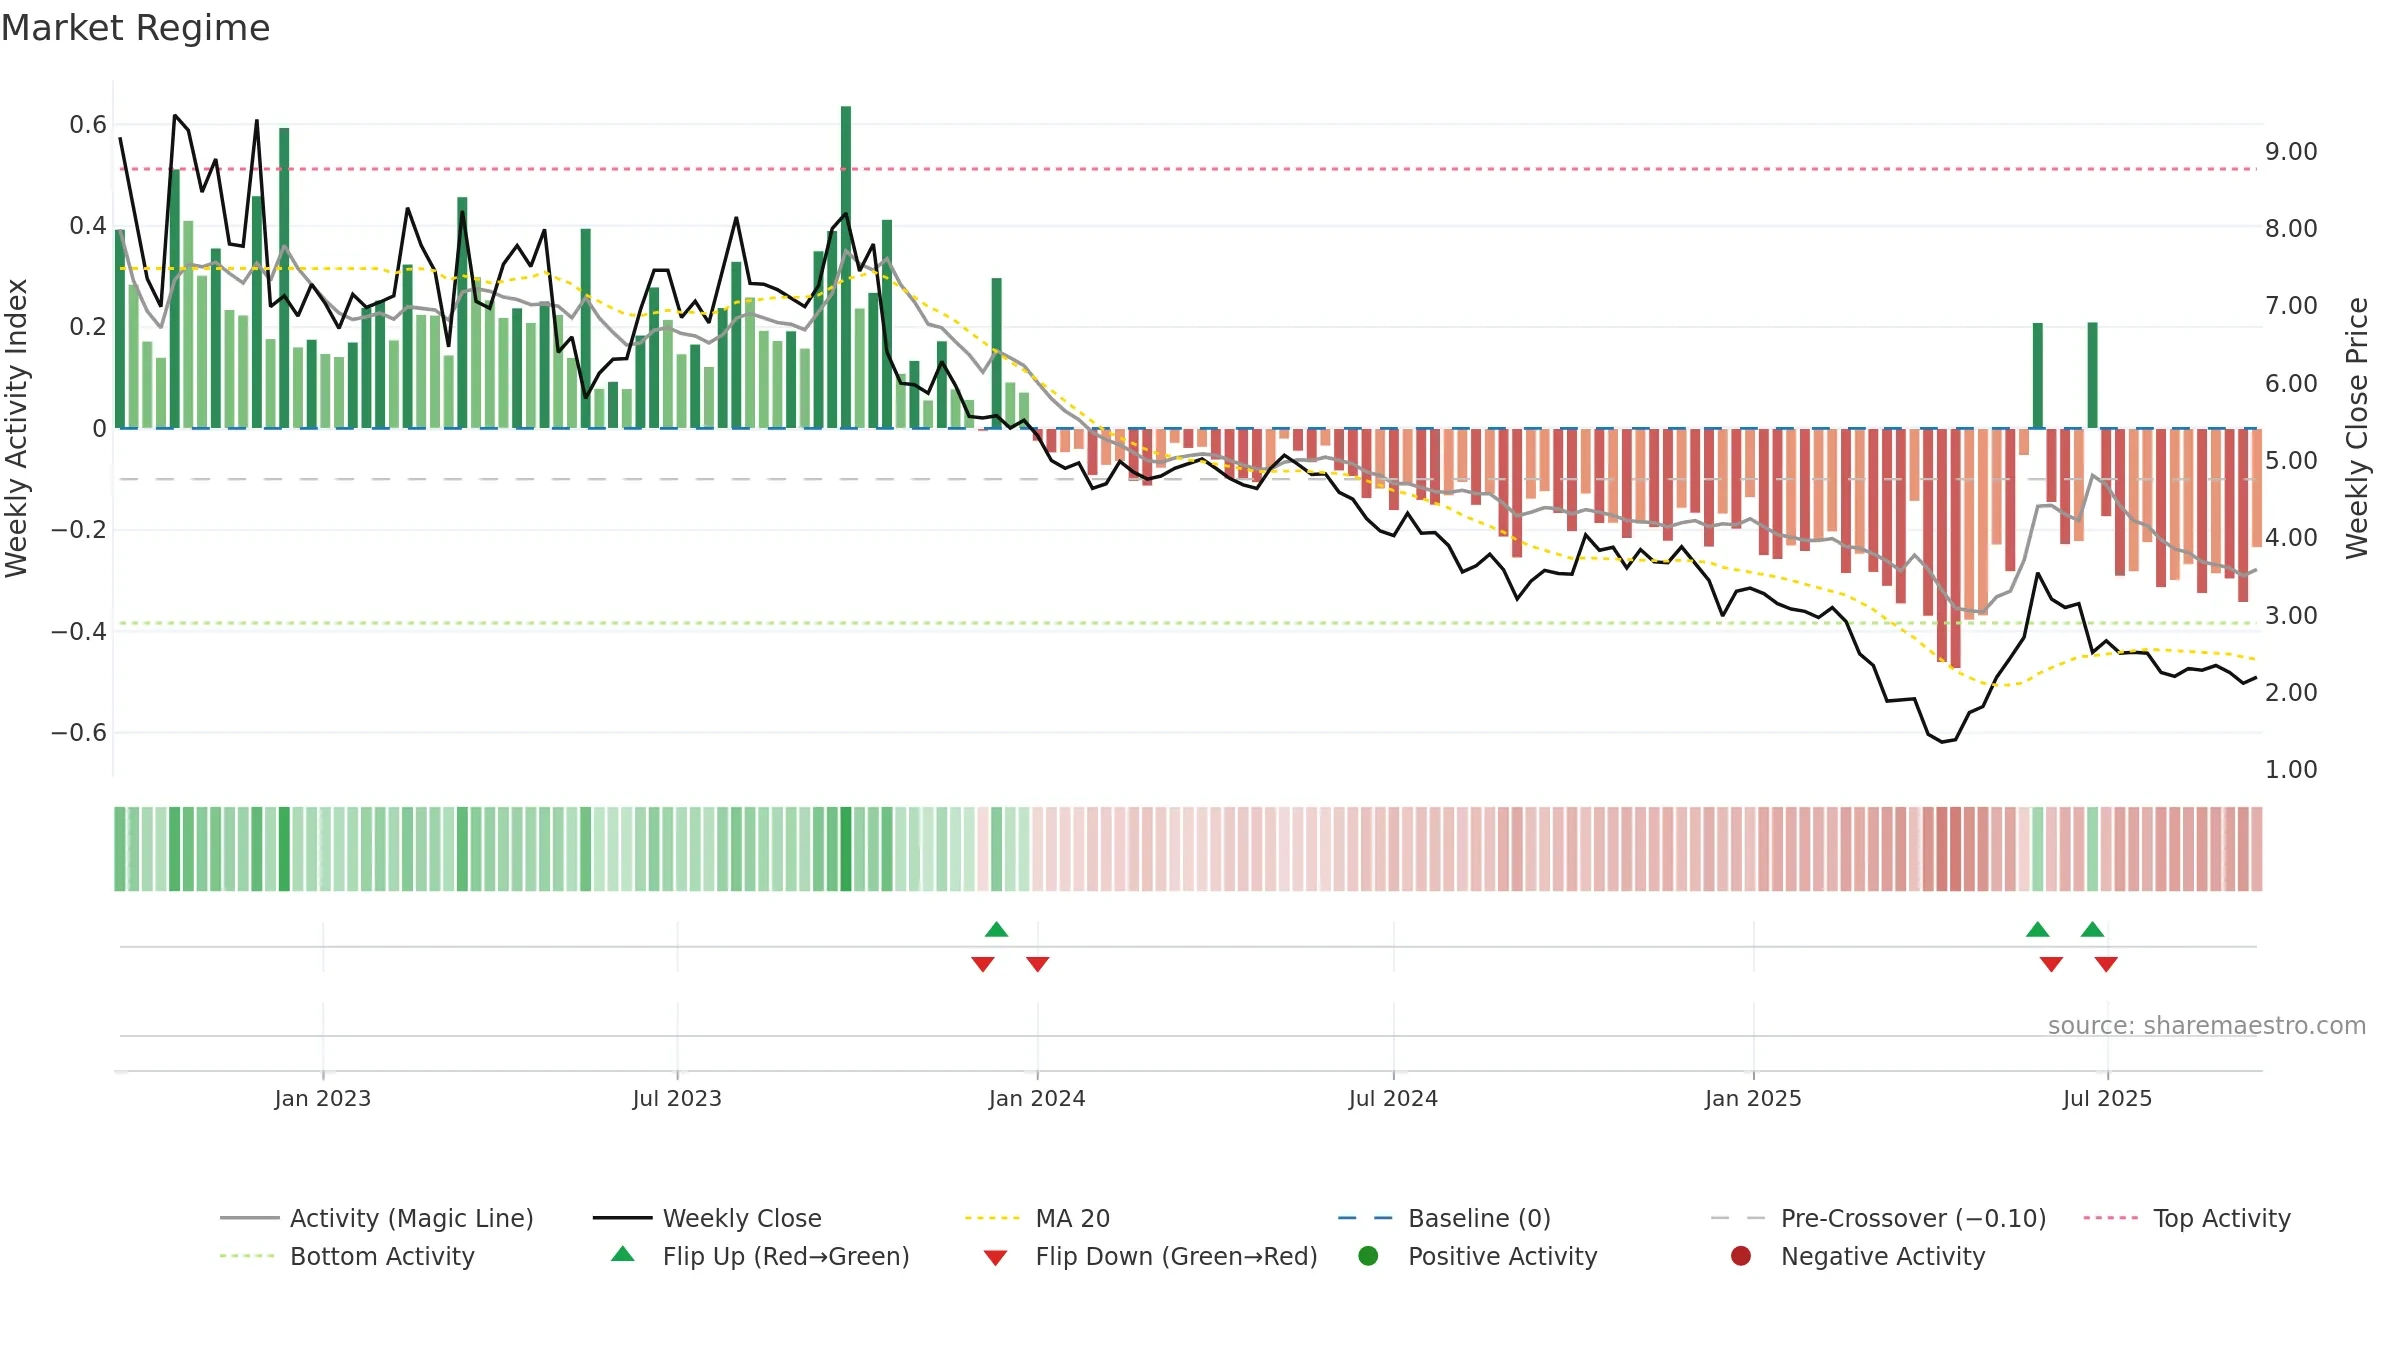
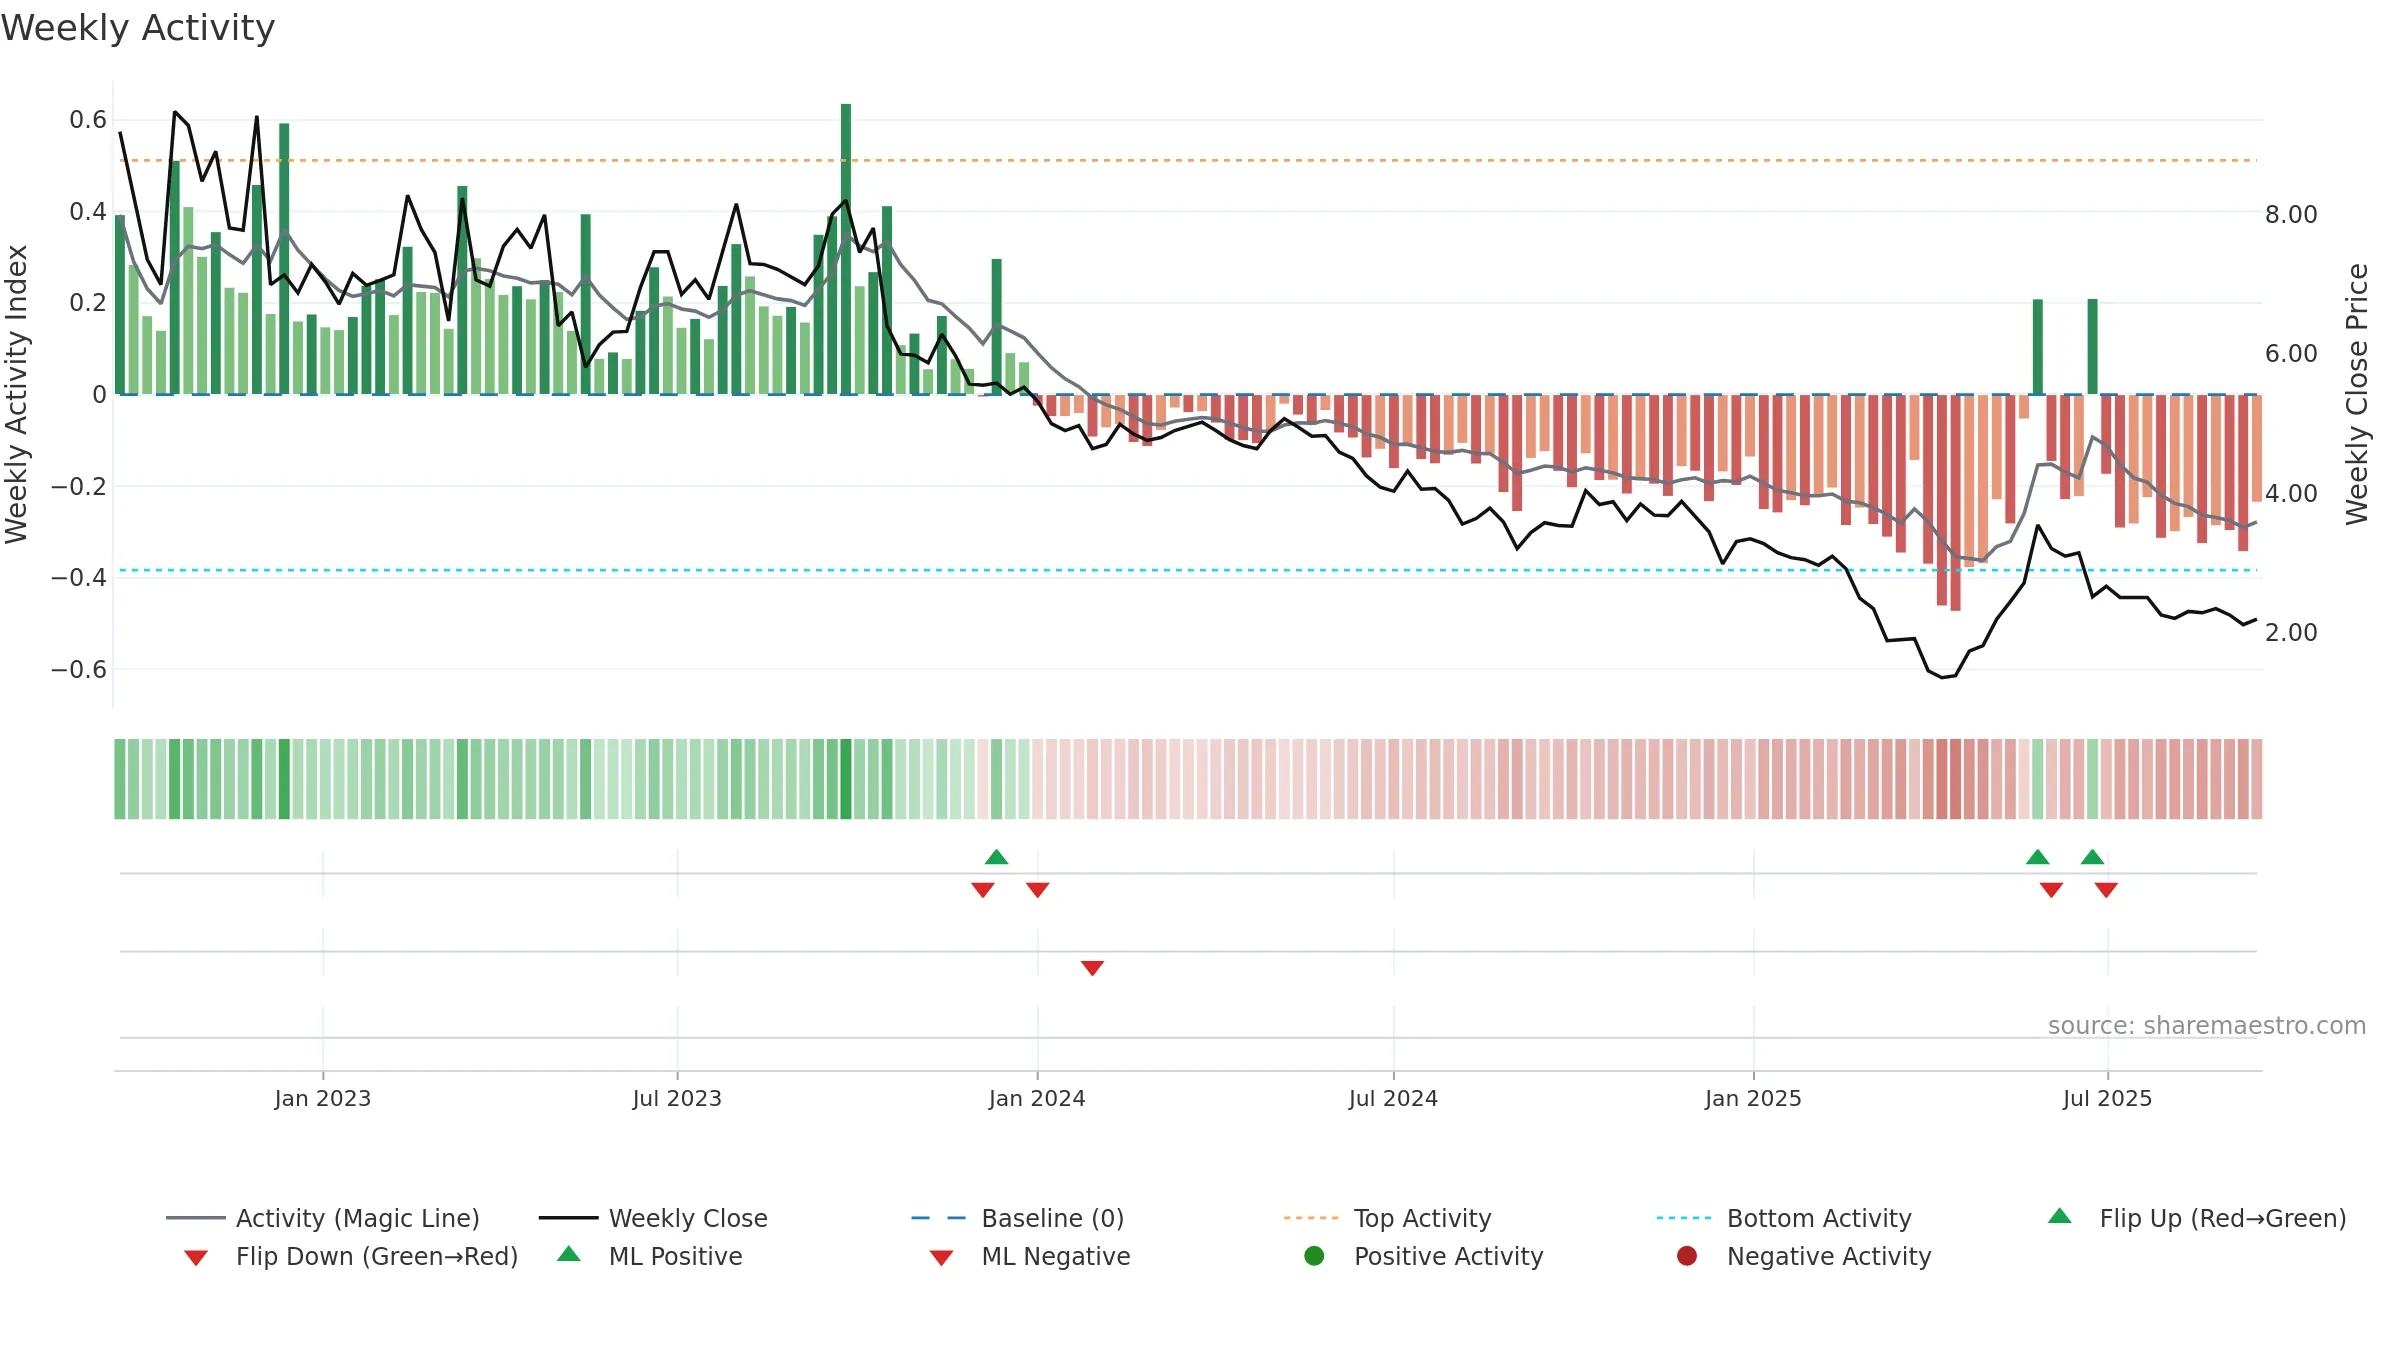
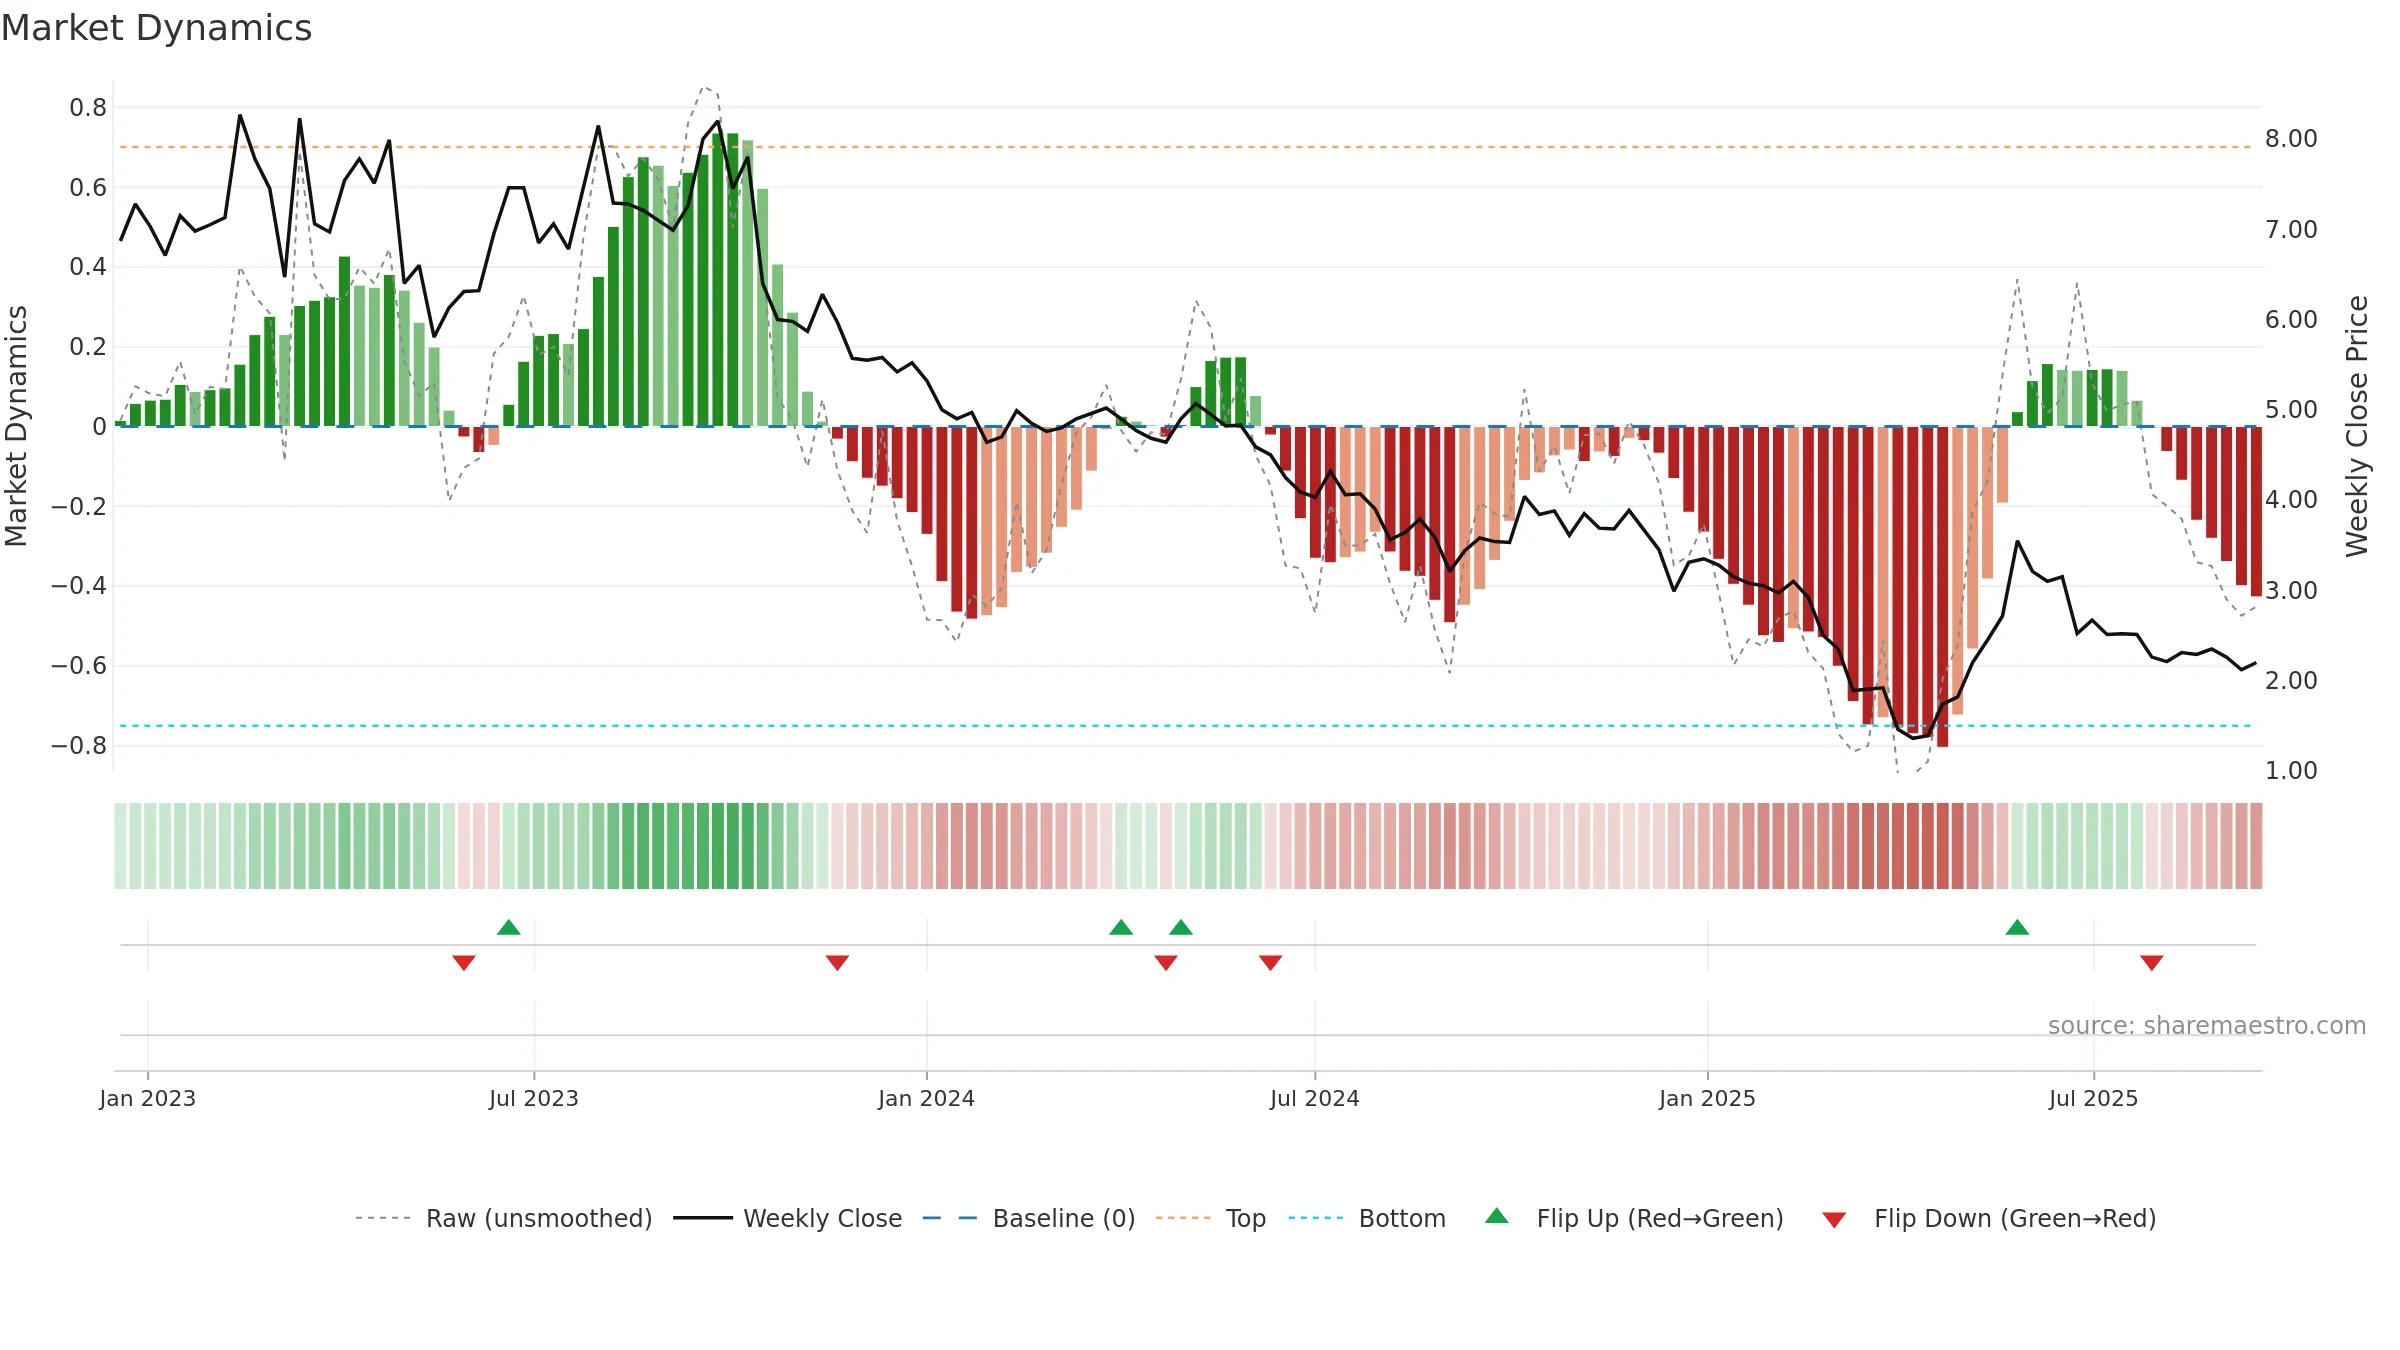
How to read this — Price slope is downward, indicating persistent supply pressure. Elevated weekly volatility increases whipsaw risk. Volume trend diverges from price — watch for fatigue or rotation. Returns are positively correlated with volume — strength tends to arrive on higher activity. Price sits below key averages, keeping pressure on the tape.
Down-slope argues for patience; rallies can fade sooner unless participation improves. Because liquidity isn’t confirming, prefer evidence of fresh demand before chasing moves.
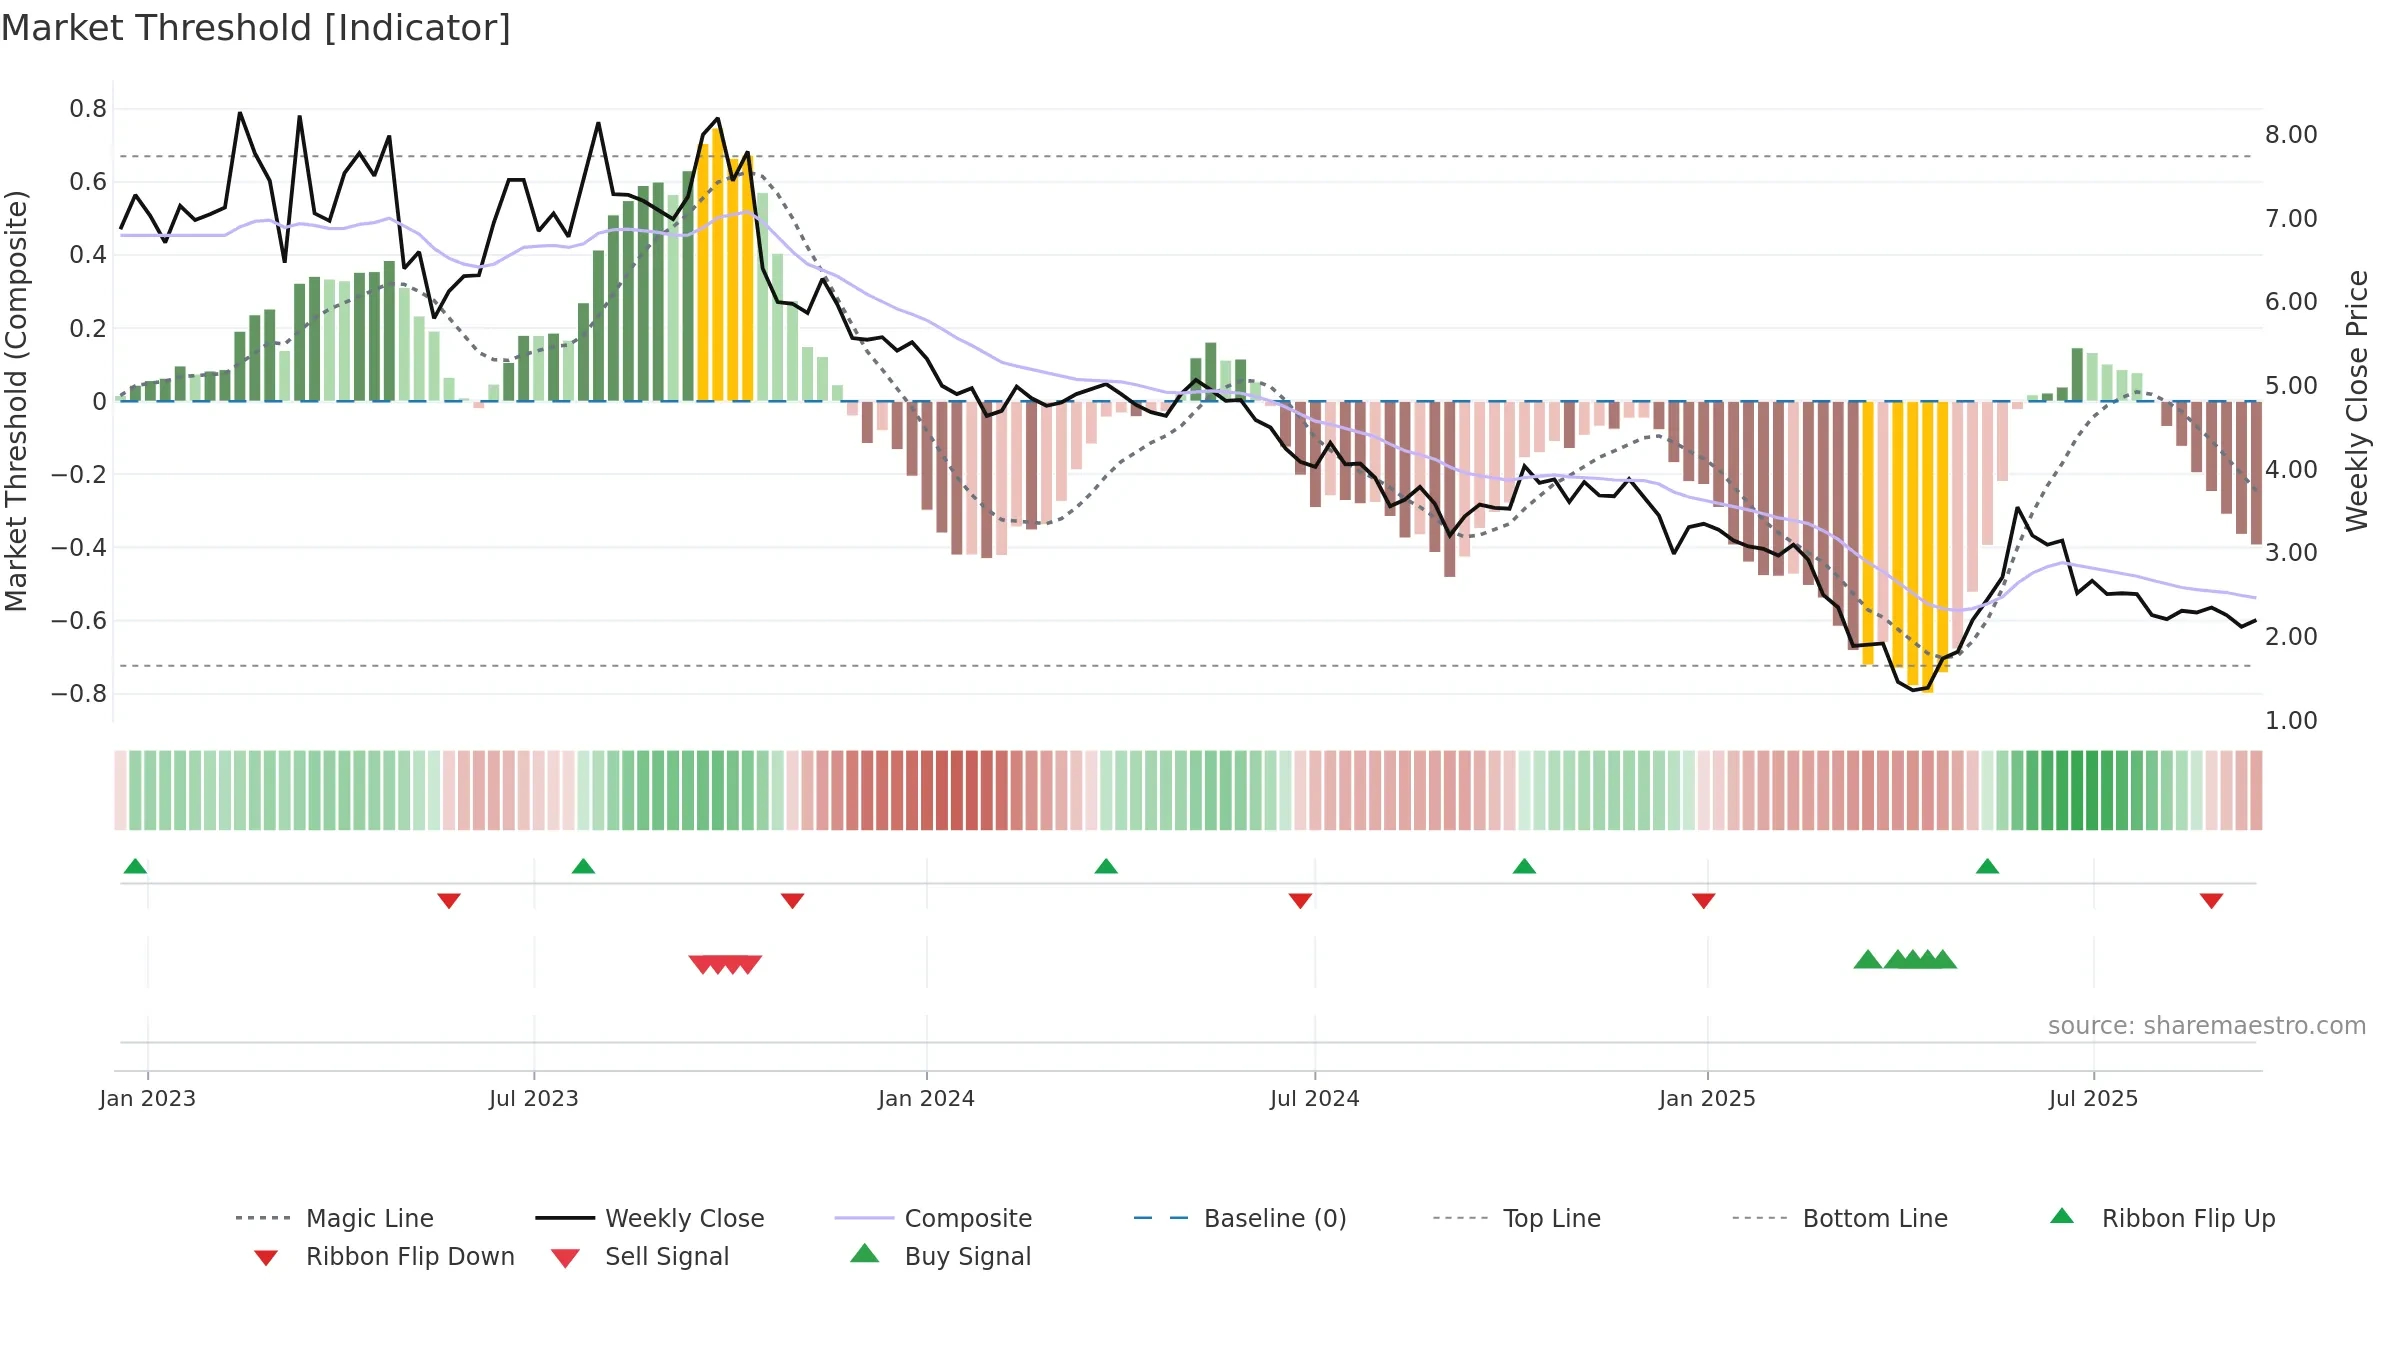
Gauge maps the trend signal to a 0–100 scale.
How to read this — Range-bound conditions; conviction is limited until a break or acceleration emerges. Sub-0.40 print confirms downside control.
Wait for a directional break or improving acceleration.
The flag is positive: favourable upside skew with supportive conditions.
Conclusion
Negative setup. ★☆☆☆☆ confidence. Price window: -2. Trend: Range / Neutral; gauge 31. In combination, liquidity diverges from price.
- Momentum is weak/falling
- Price is not above key averages
- Liquidity diverges from price
- High return volatility raises whipsaw risk
Why: Price window -2.65% over 8w. Close is -6.38% below the prior-window high. Return volatility 4.76%. Volume trend rising. Liquidity divergence with price. Trend state range / neutral. Momentum bearish and falling. Valuation stance positive.
Tip: Most metrics include a hover tooltip where they appear in the report.