Heritage Insurance Holdings, Inc.
HRTG NYSE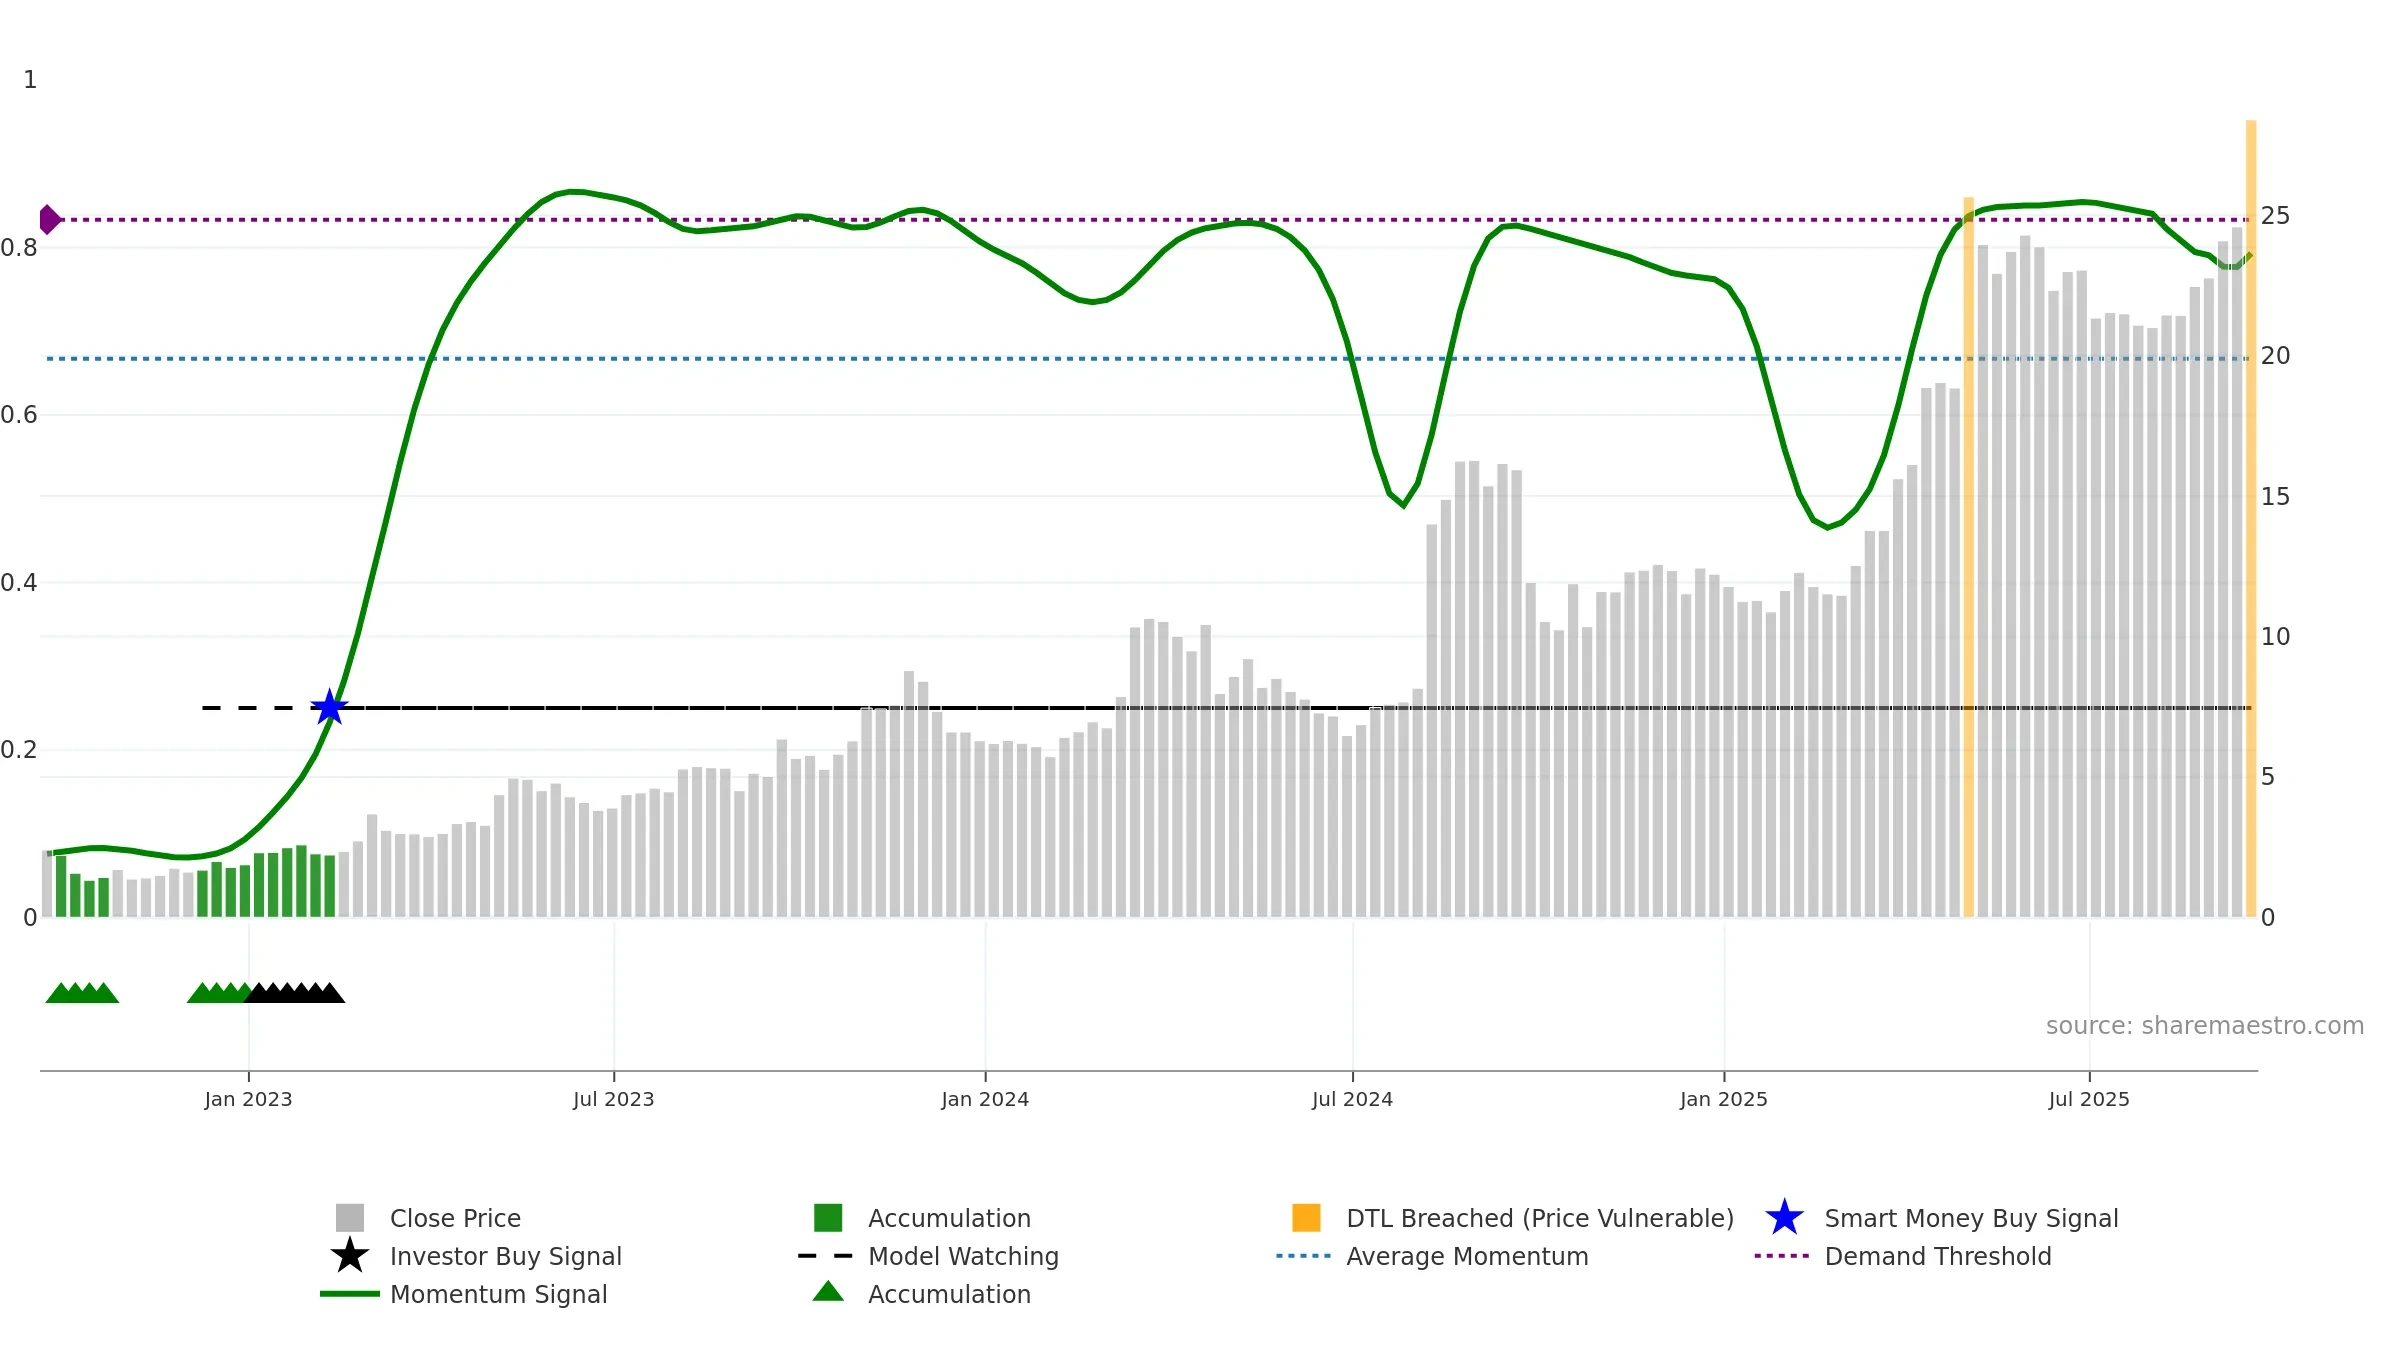
Weekly Report
Heritage Insurance Holdings, Inc. closed at 28.4000 (9.06% WoW) . Data window ends Fri, 19 Sep 2025.
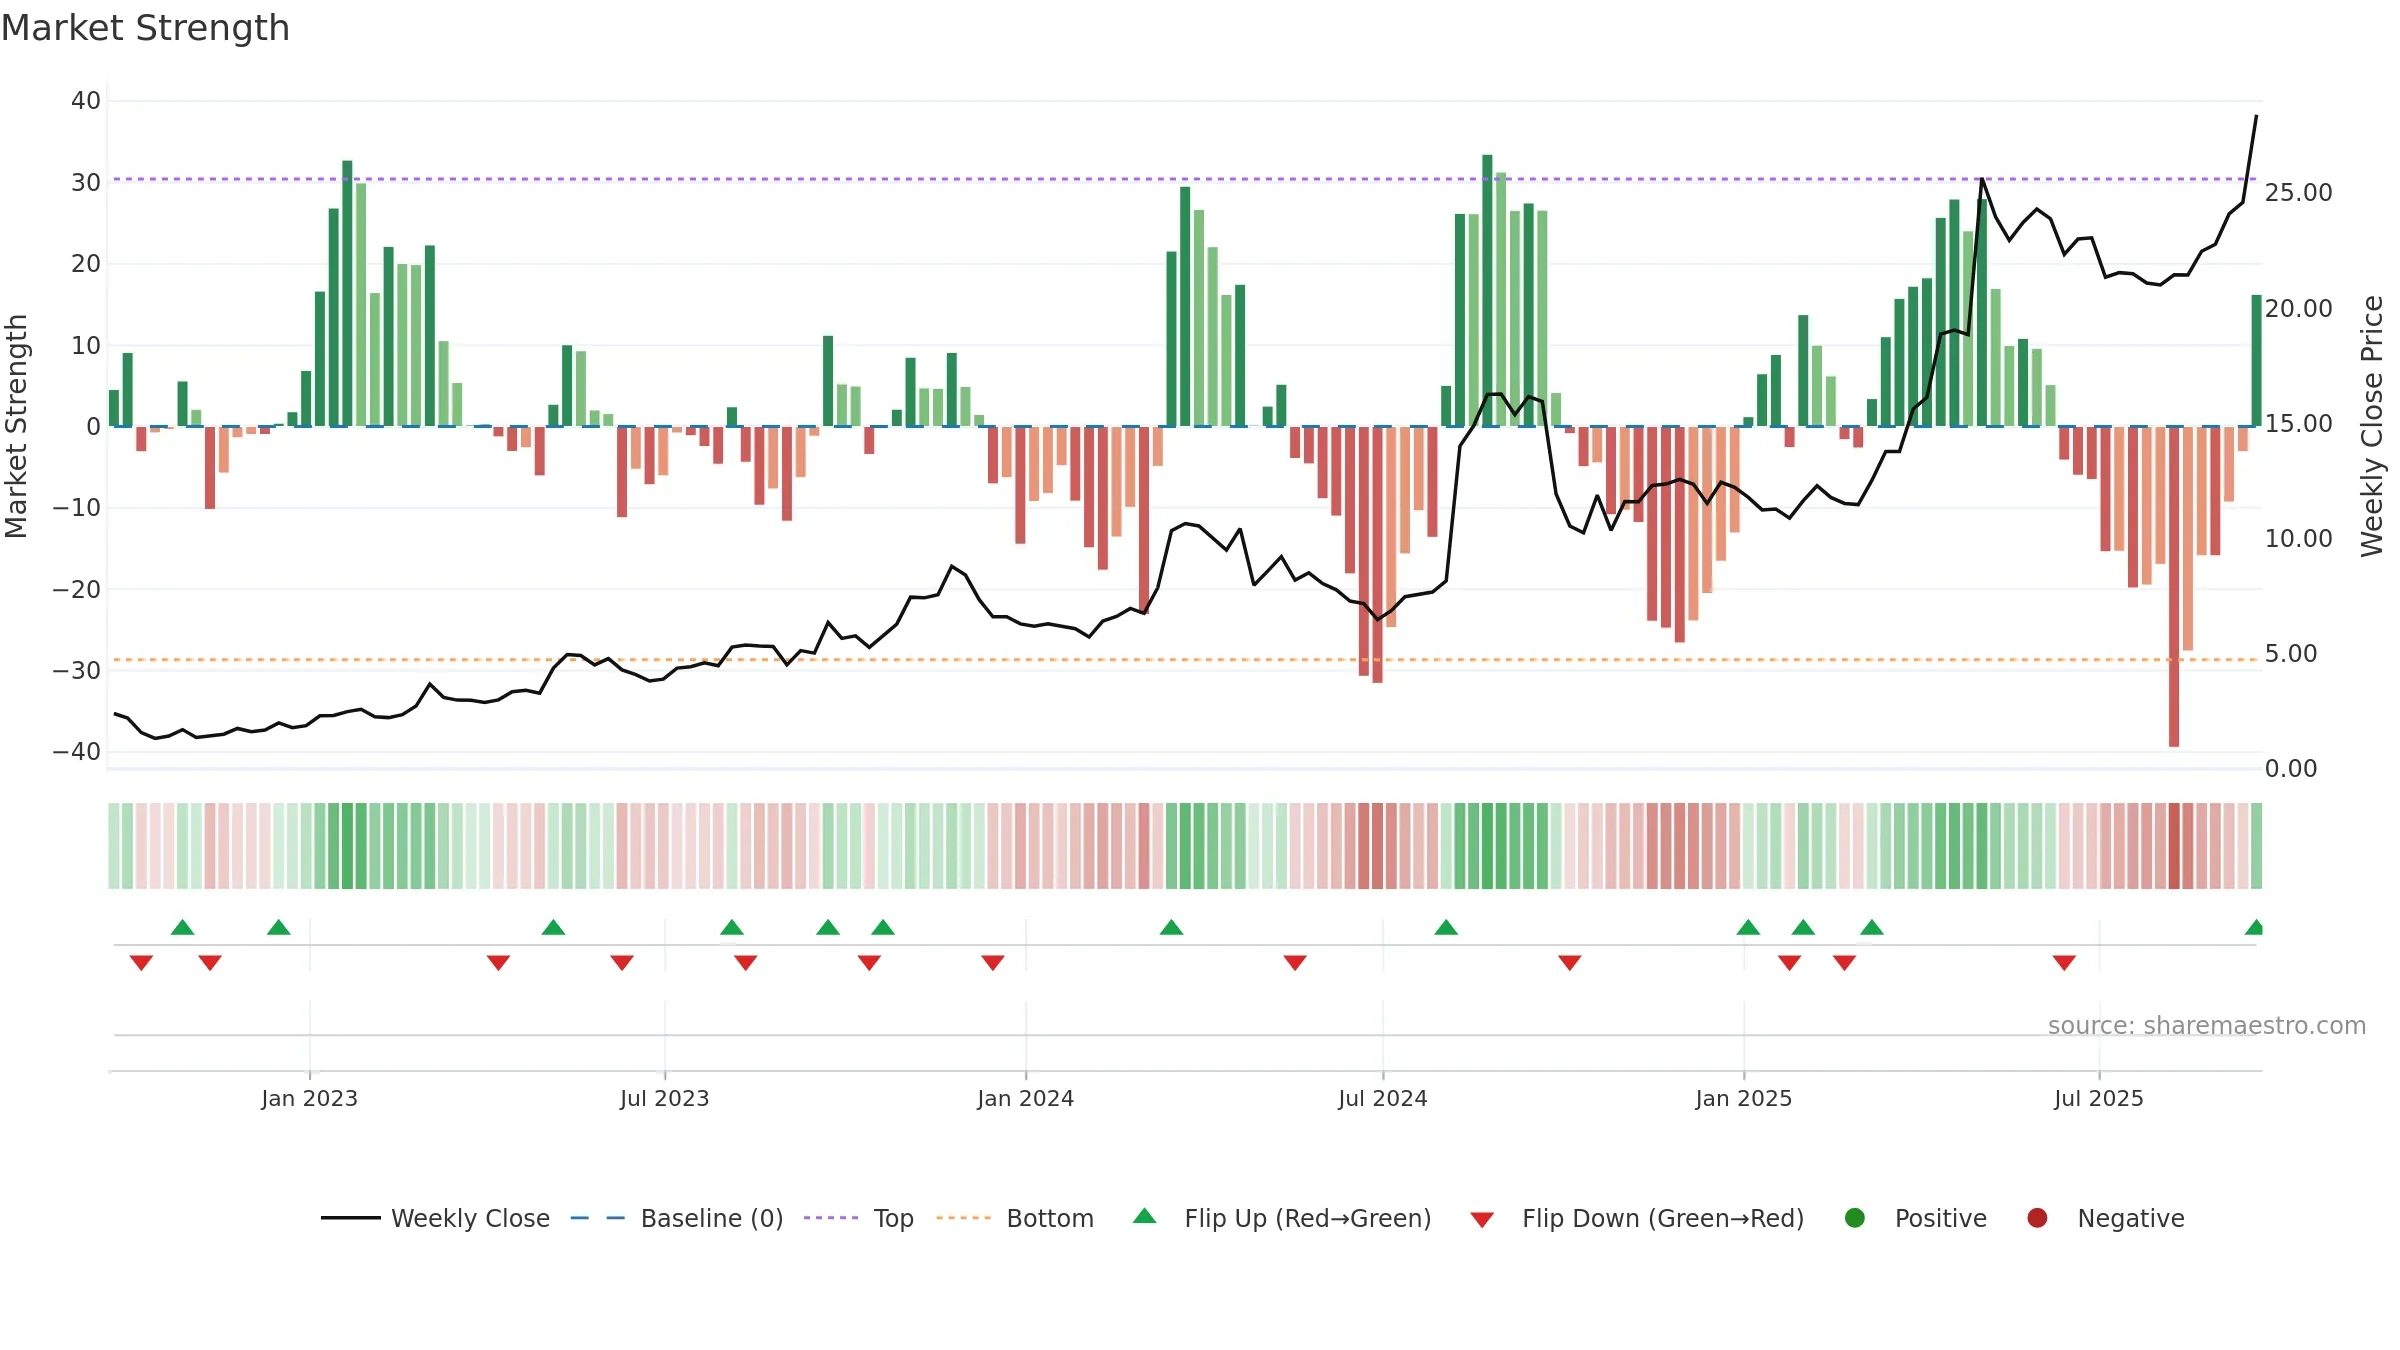
How to read this — Price slope is upward, indicating persistent buying over the window. Elevated weekly volatility increases whipsaw risk. Volume and price are moving in the same direction — a constructive confirmation. Returns are positively correlated with volume — strength tends to arrive on higher activity. Price is stretched above its baseline; consolidation risk rises if activity fades. Constructive MA stack supports the up-drift; pullbacks may find support at the 8–13 week region. Price holds above key averages, indicating constructive participation.
Up-slope supports buying interest; pullbacks may be contained if activity stays firm.
Gauge maps the trend signal to a 0–100 scale.
How to read this — Range-bound conditions; conviction is limited until a break or acceleration emerges.
Wait for a directional break or improving acceleration.
Price is above fair value; upside may be capped without catalysts.
Conclusion
Negative setup. ★★☆☆☆ confidence. Price window: 35. Trend: Range / Neutral; gauge 79. In combination, liquidity confirms the move.
- Price holds above 8w & 26w averages
- Constructive moving-average stack
- Liquidity confirms the price trend
- Solid multi-week performance
- Momentum is weak/falling
- High return volatility raises whipsaw risk
- Sellers active at elevated levels (distribution)
Why: Price window 35.17% over 8w. Close is 15.49% above the prior-window high. Return volatility 4.06%. Volume trend rising. Liquidity convergence with price. Trend state range / neutral. High-regime (0.80–1.00) downticks 3/3 (100.0%) • Distributing. MA stack constructive. Baseline deviation 1.93% (widening). Momentum bullish and falling. Valuation limited upside without catalysts.
Tip: Most metrics include a hover tooltip where they appear in the report.