Marcus & Millichap, Inc.
MMI NYSE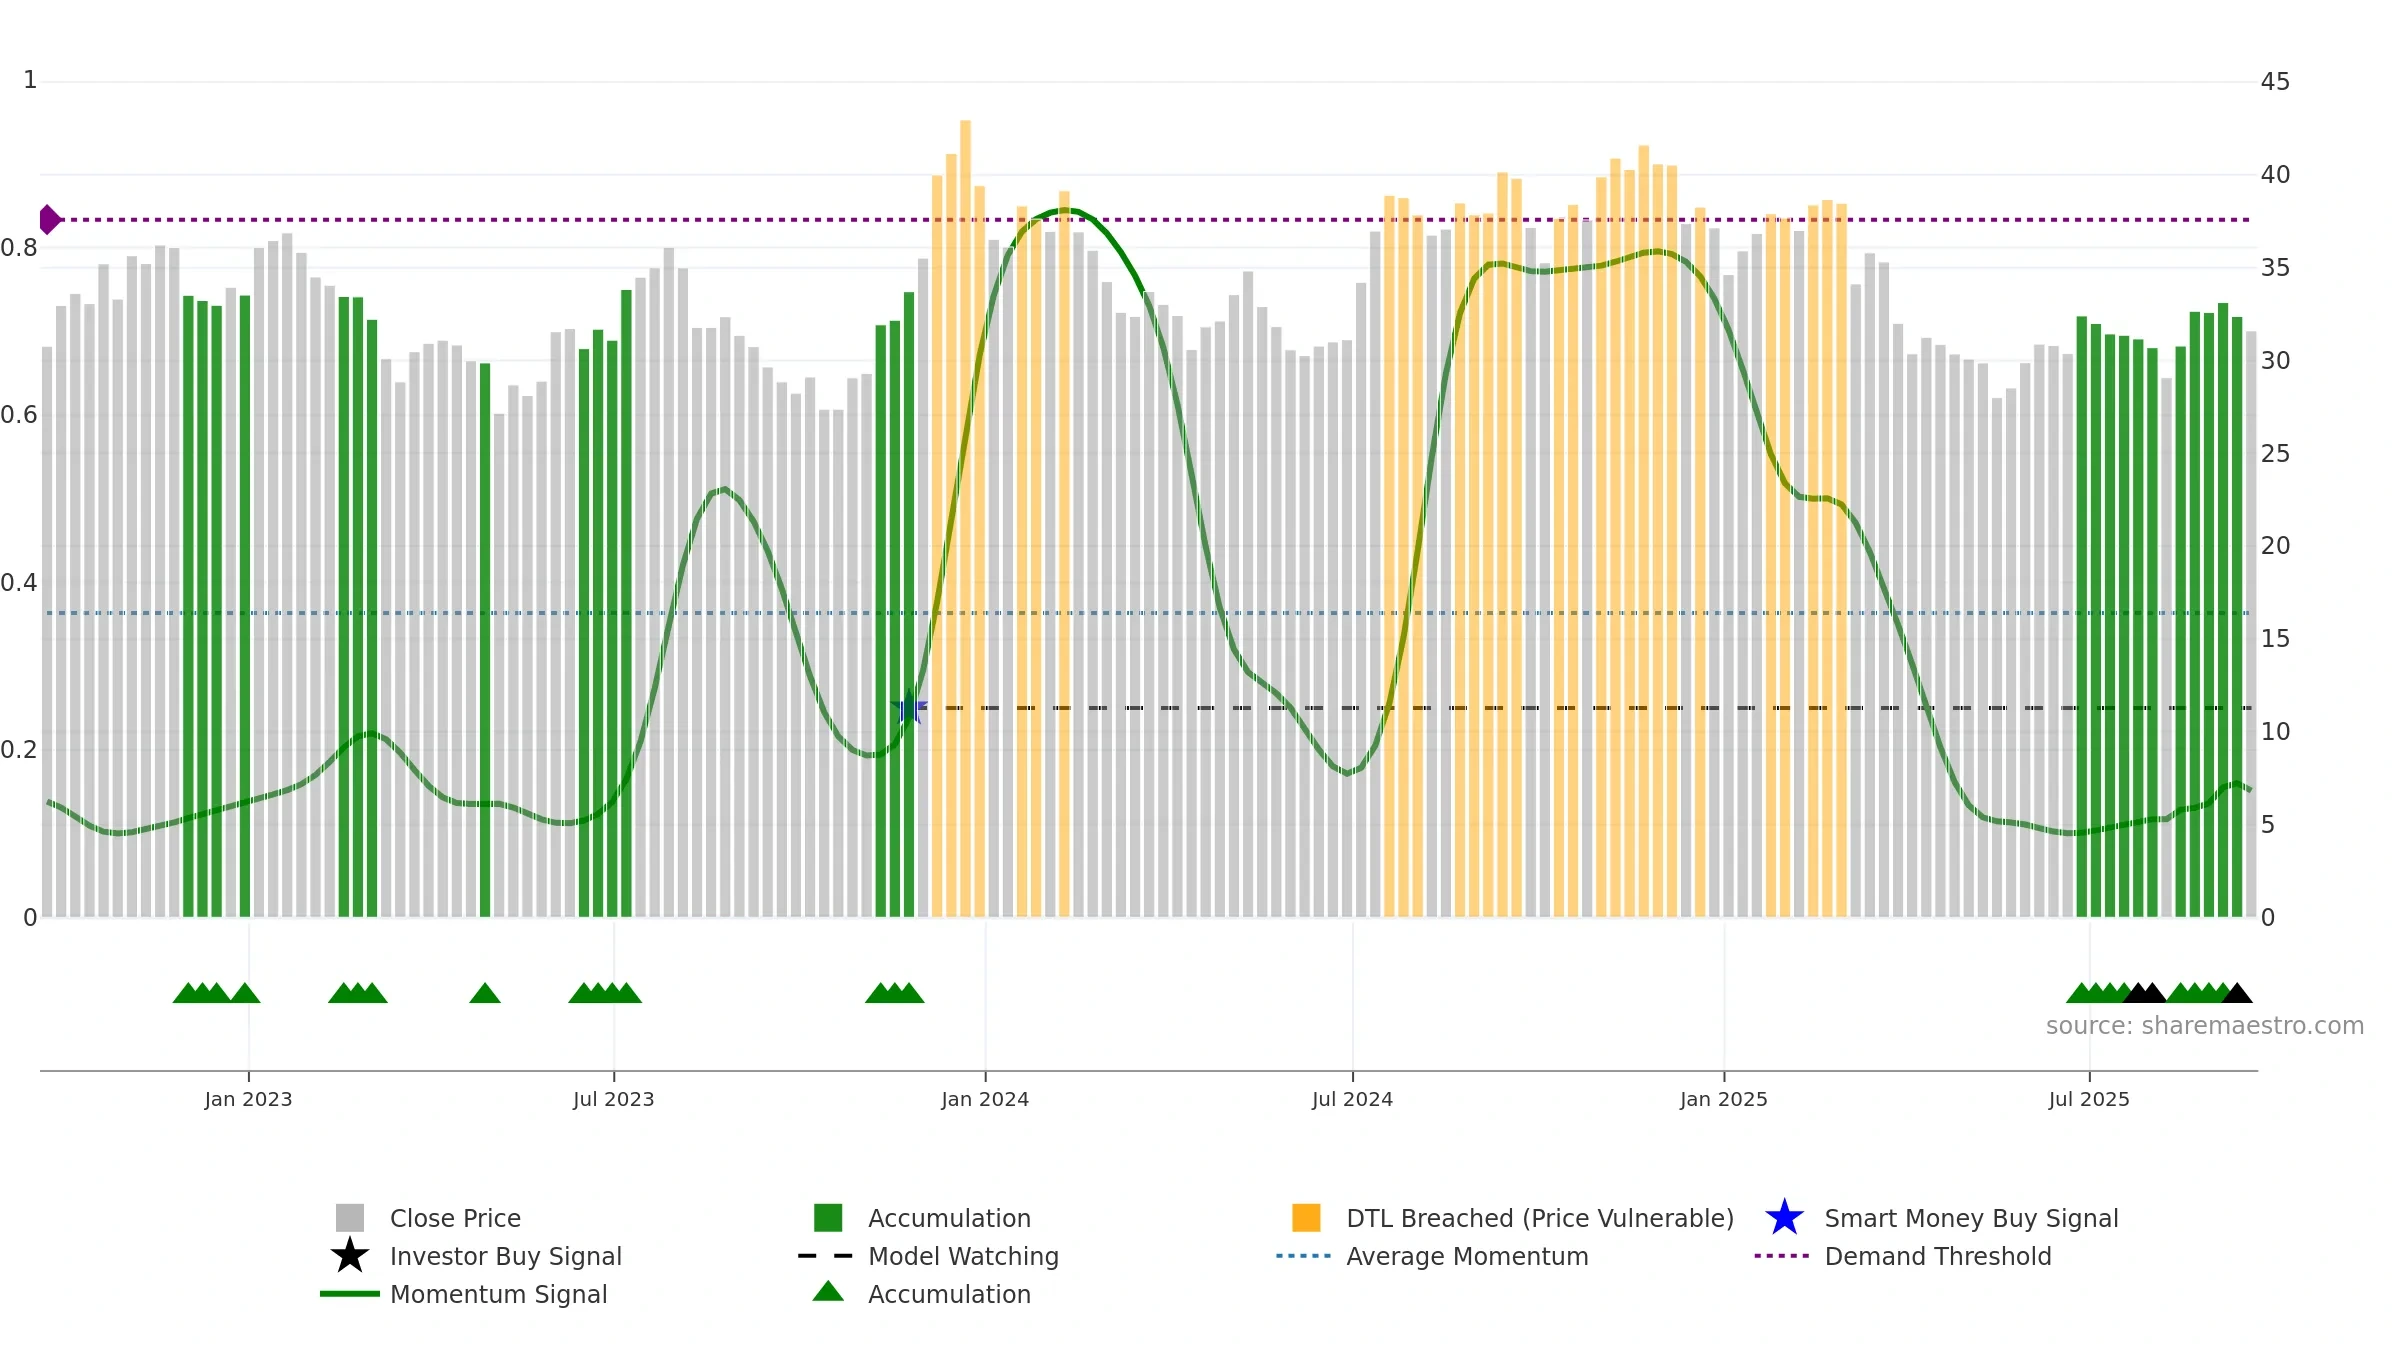
Weekly Report
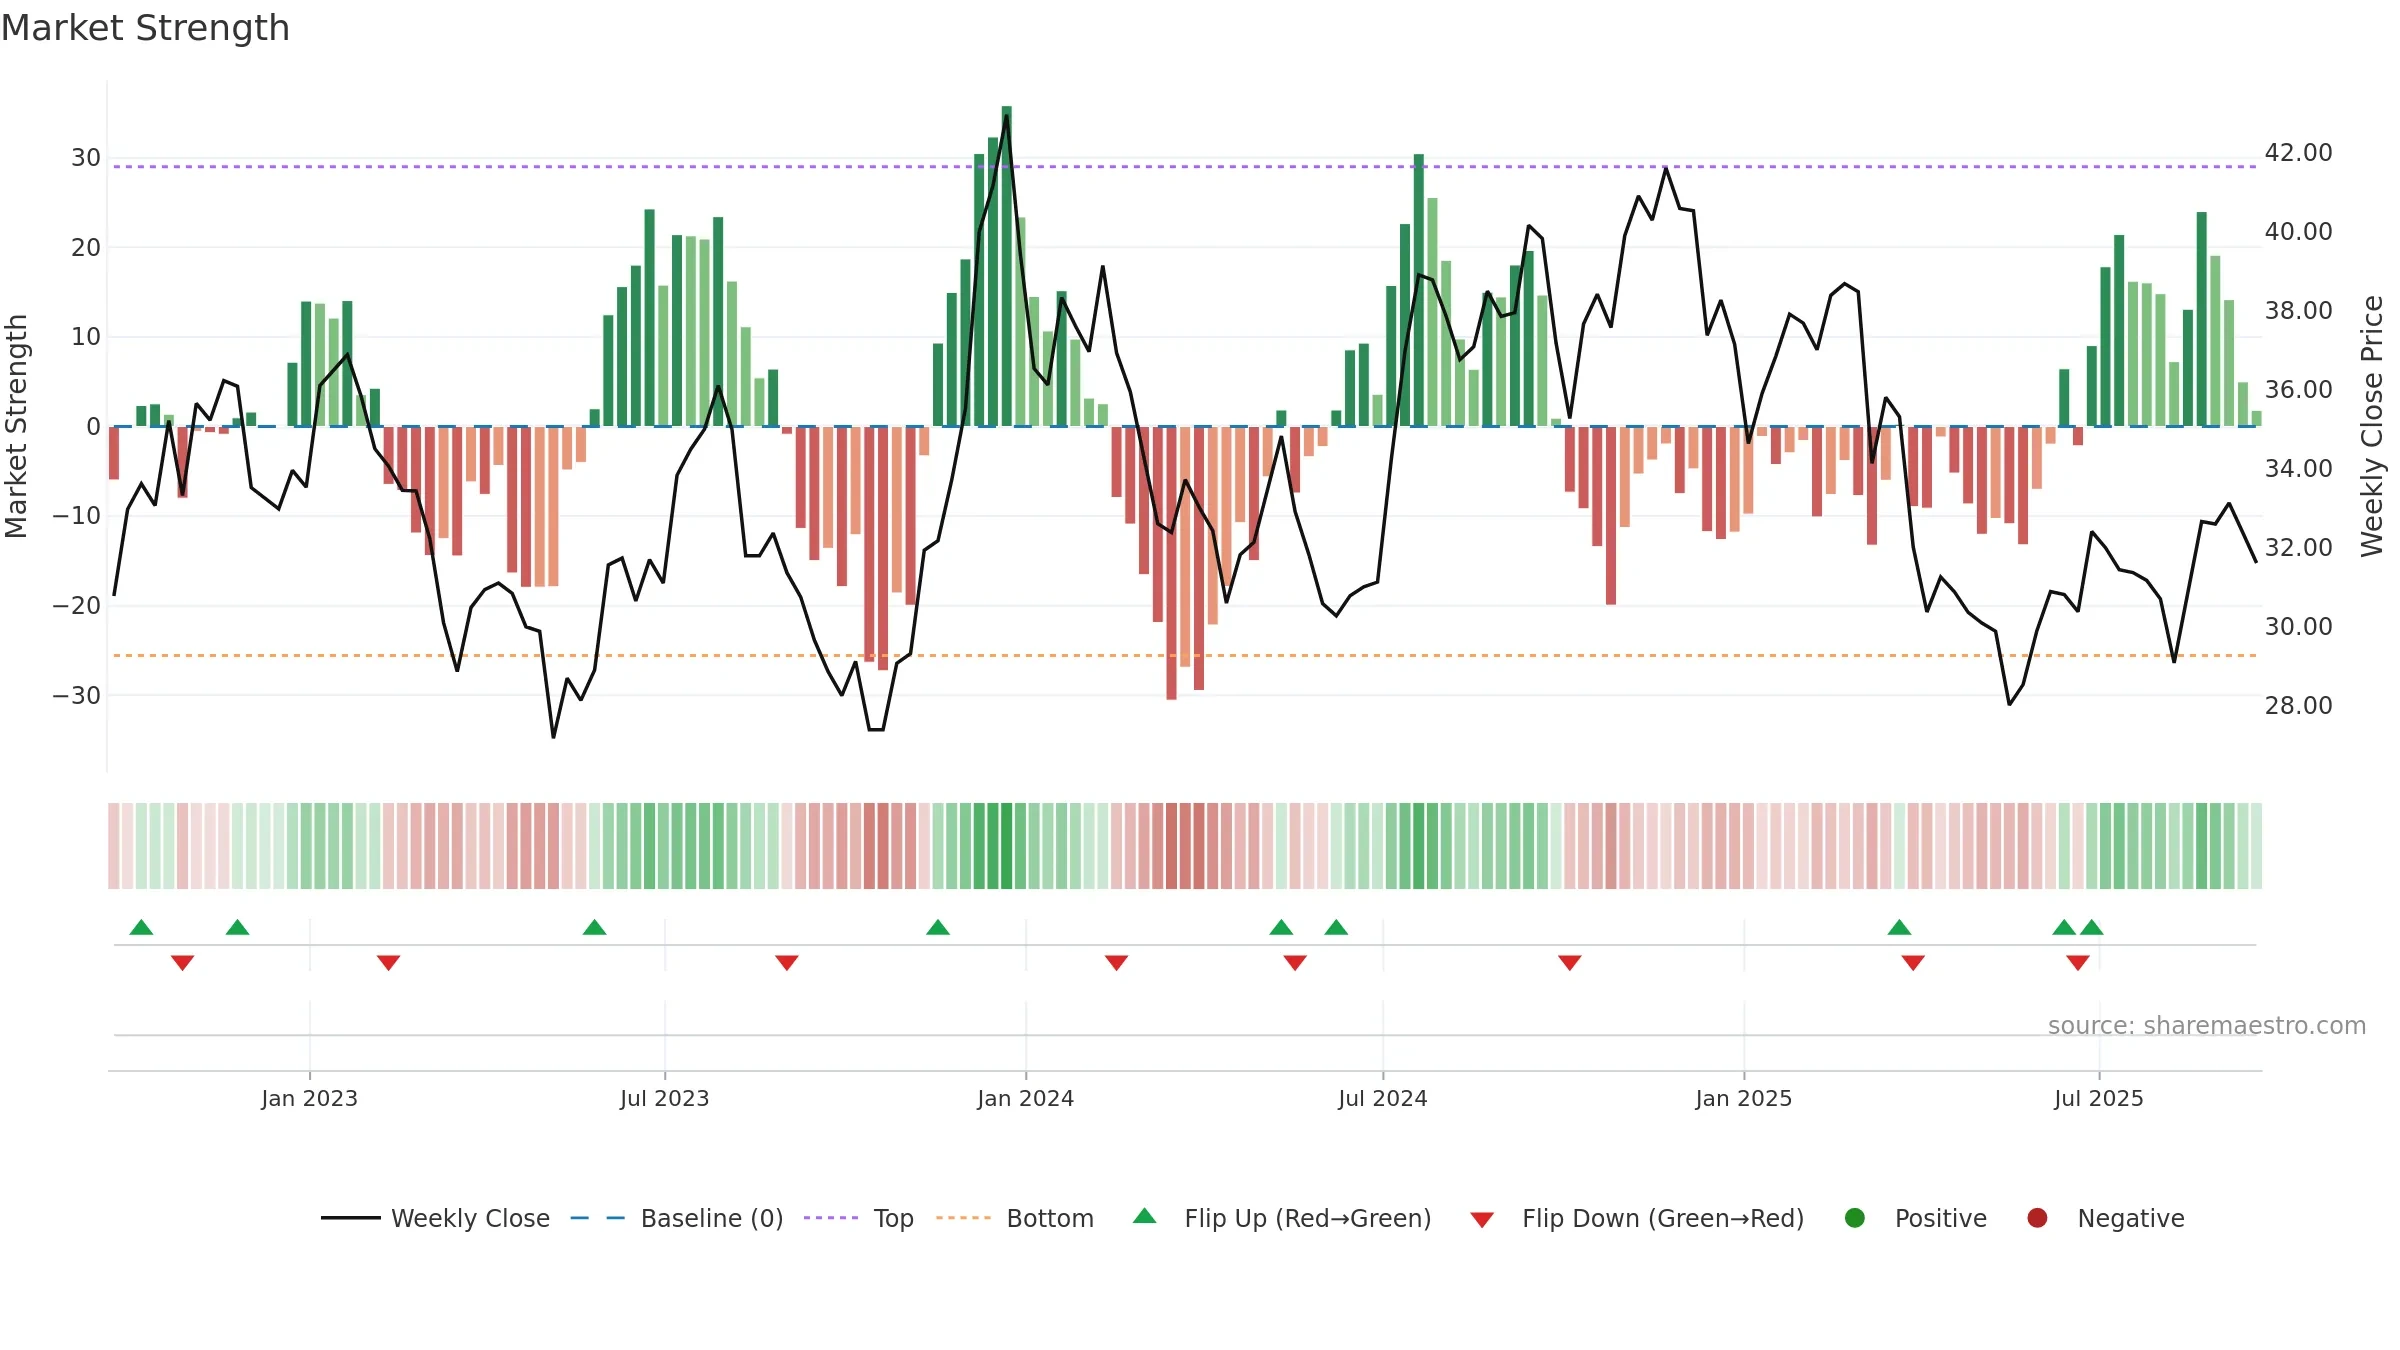
Marcus & Millichap, Inc. closed at 31.6000 (-2.38% WoW) . Data window ends Fri, 19 Sep 2025.
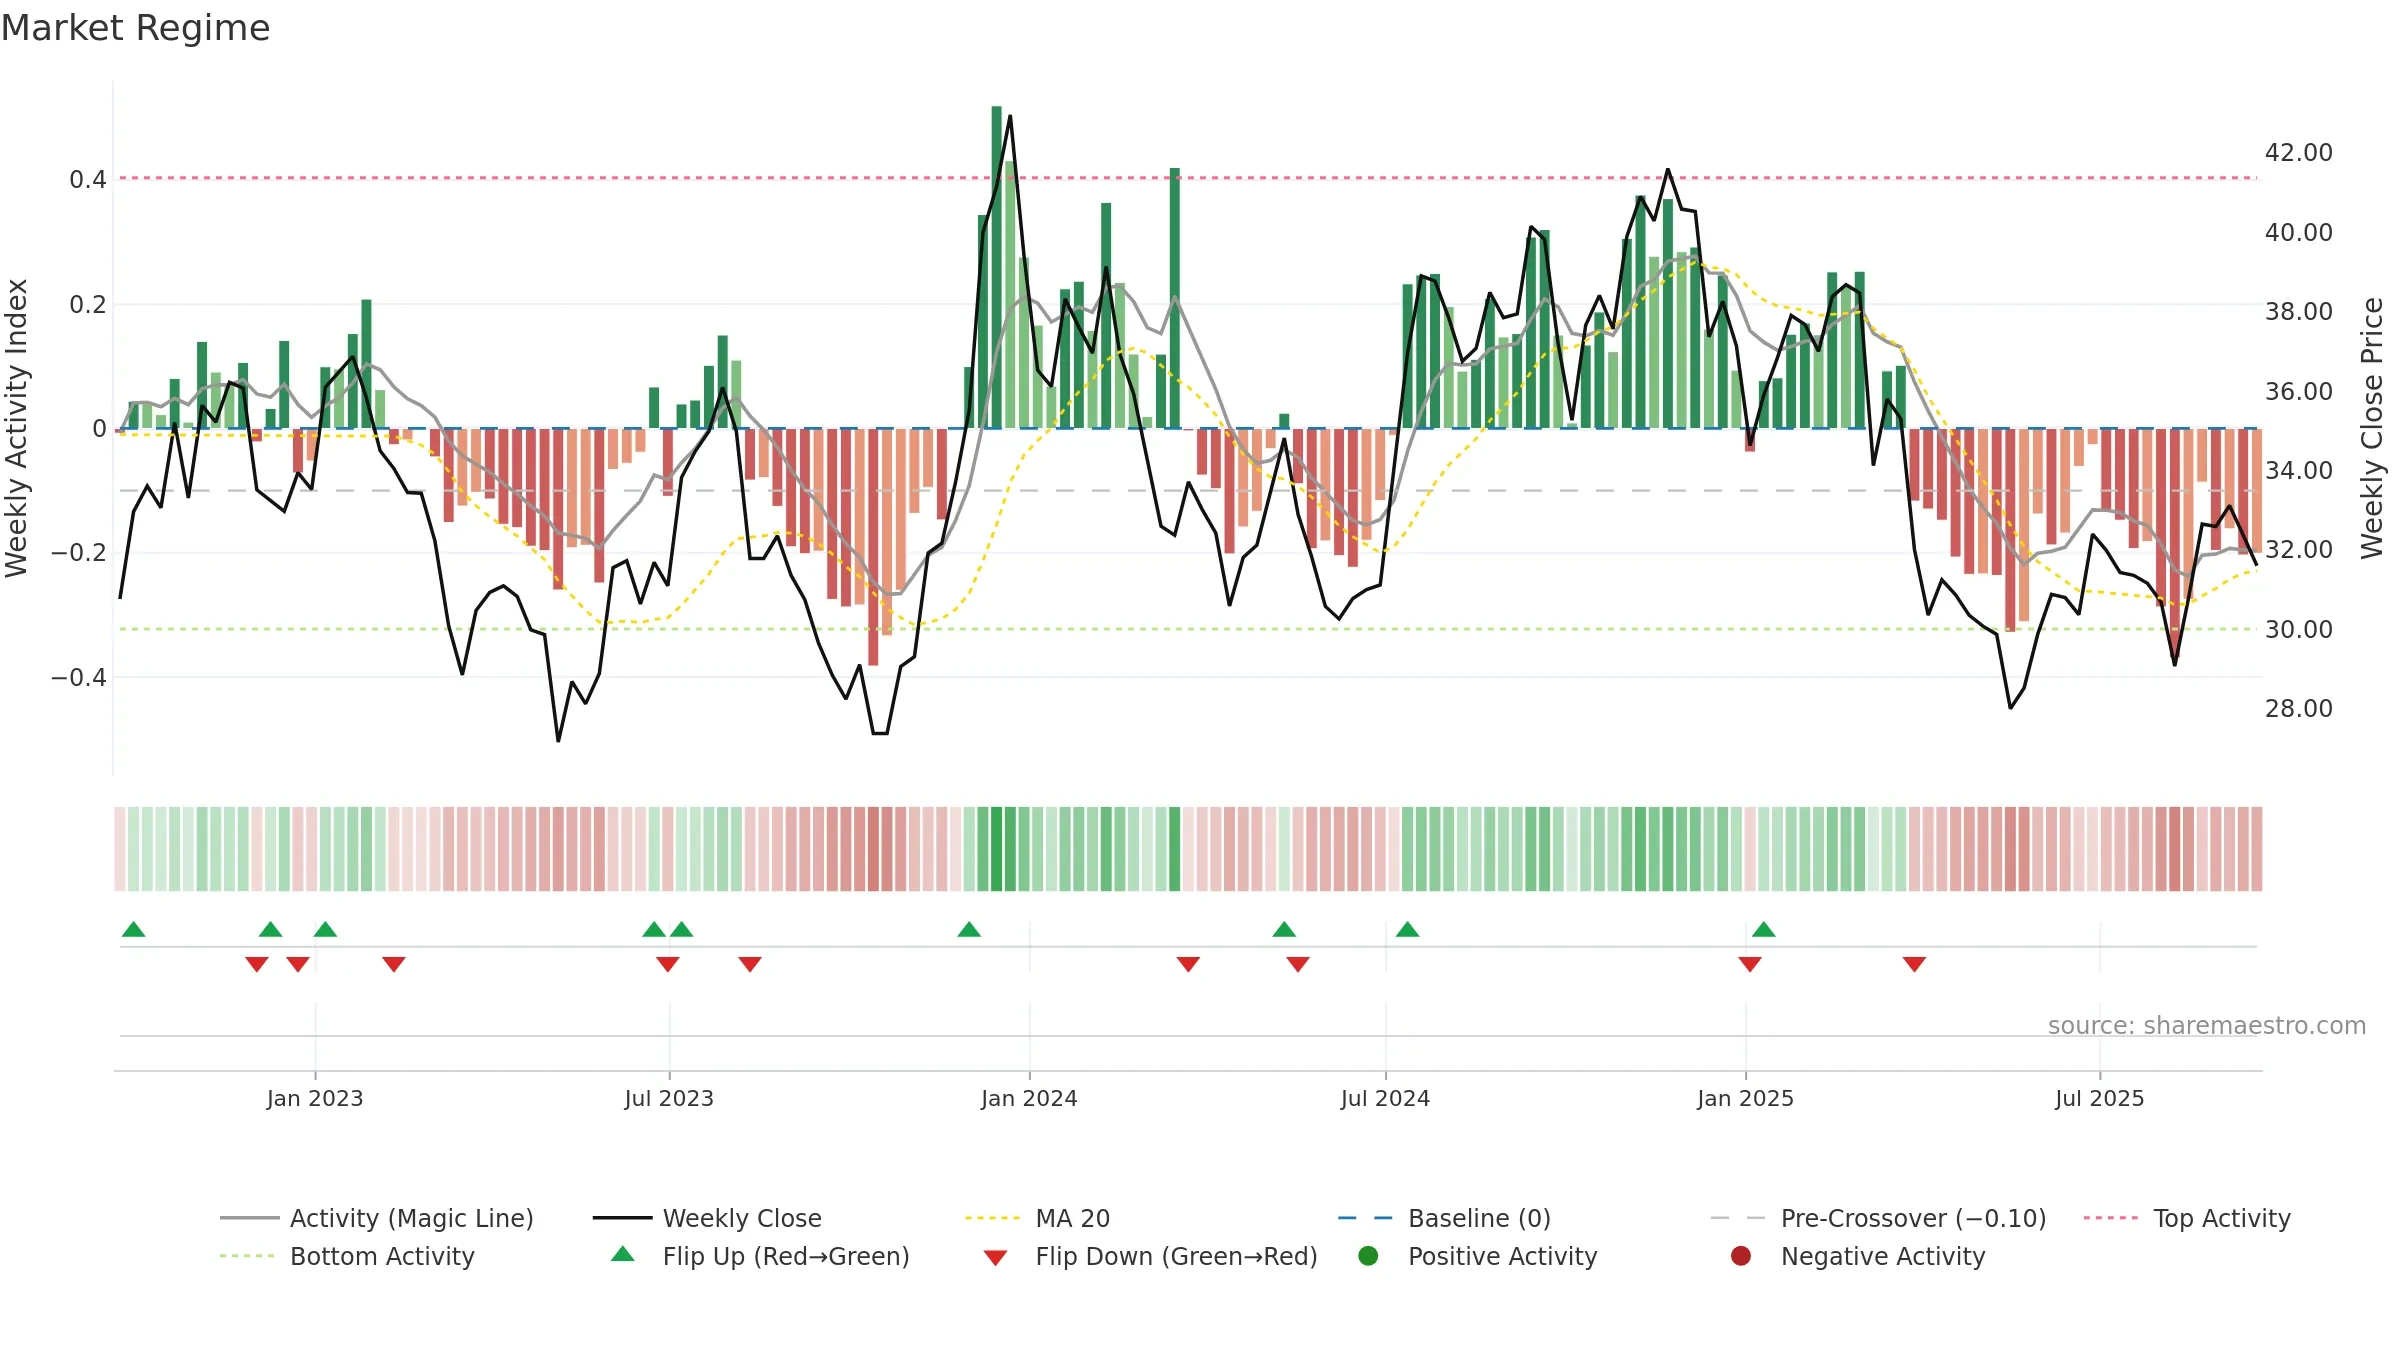
How to read this — Price slope is upward, indicating persistent buying over the window. Volume and price are moving in the same direction — a constructive confirmation. Returns are positively correlated with volume — strength tends to arrive on higher activity.
Up-slope supports buying interest; pullbacks may be contained if activity stays firm.
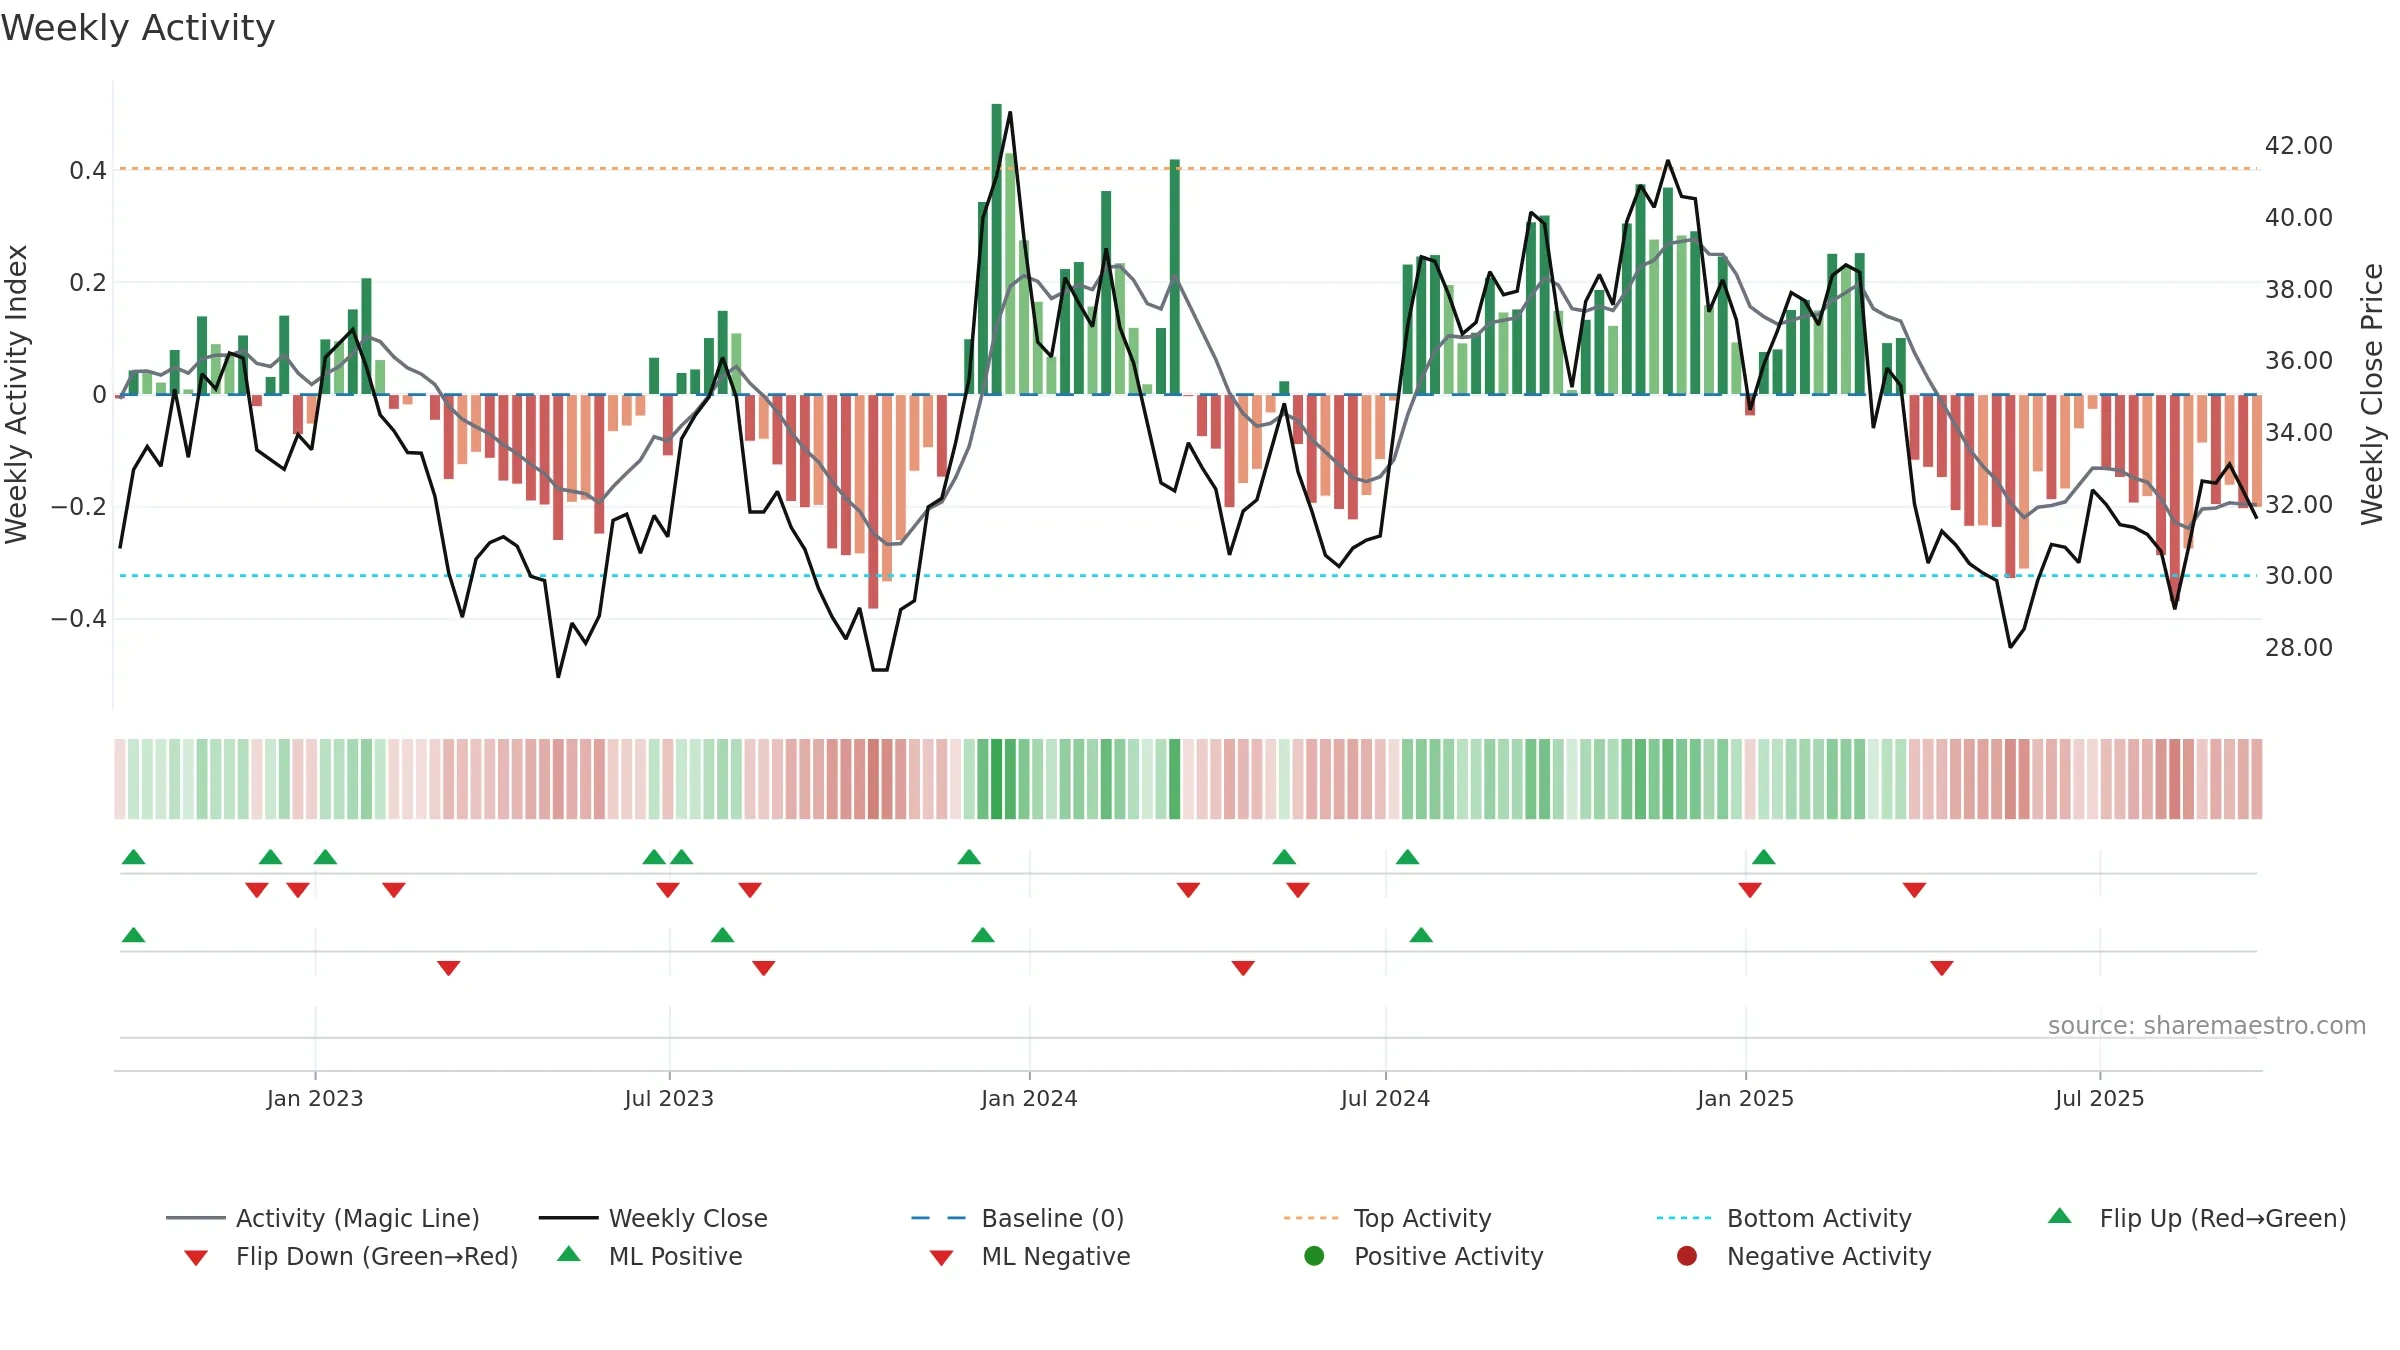
Gauge maps the trend signal to a 0–100 scale.
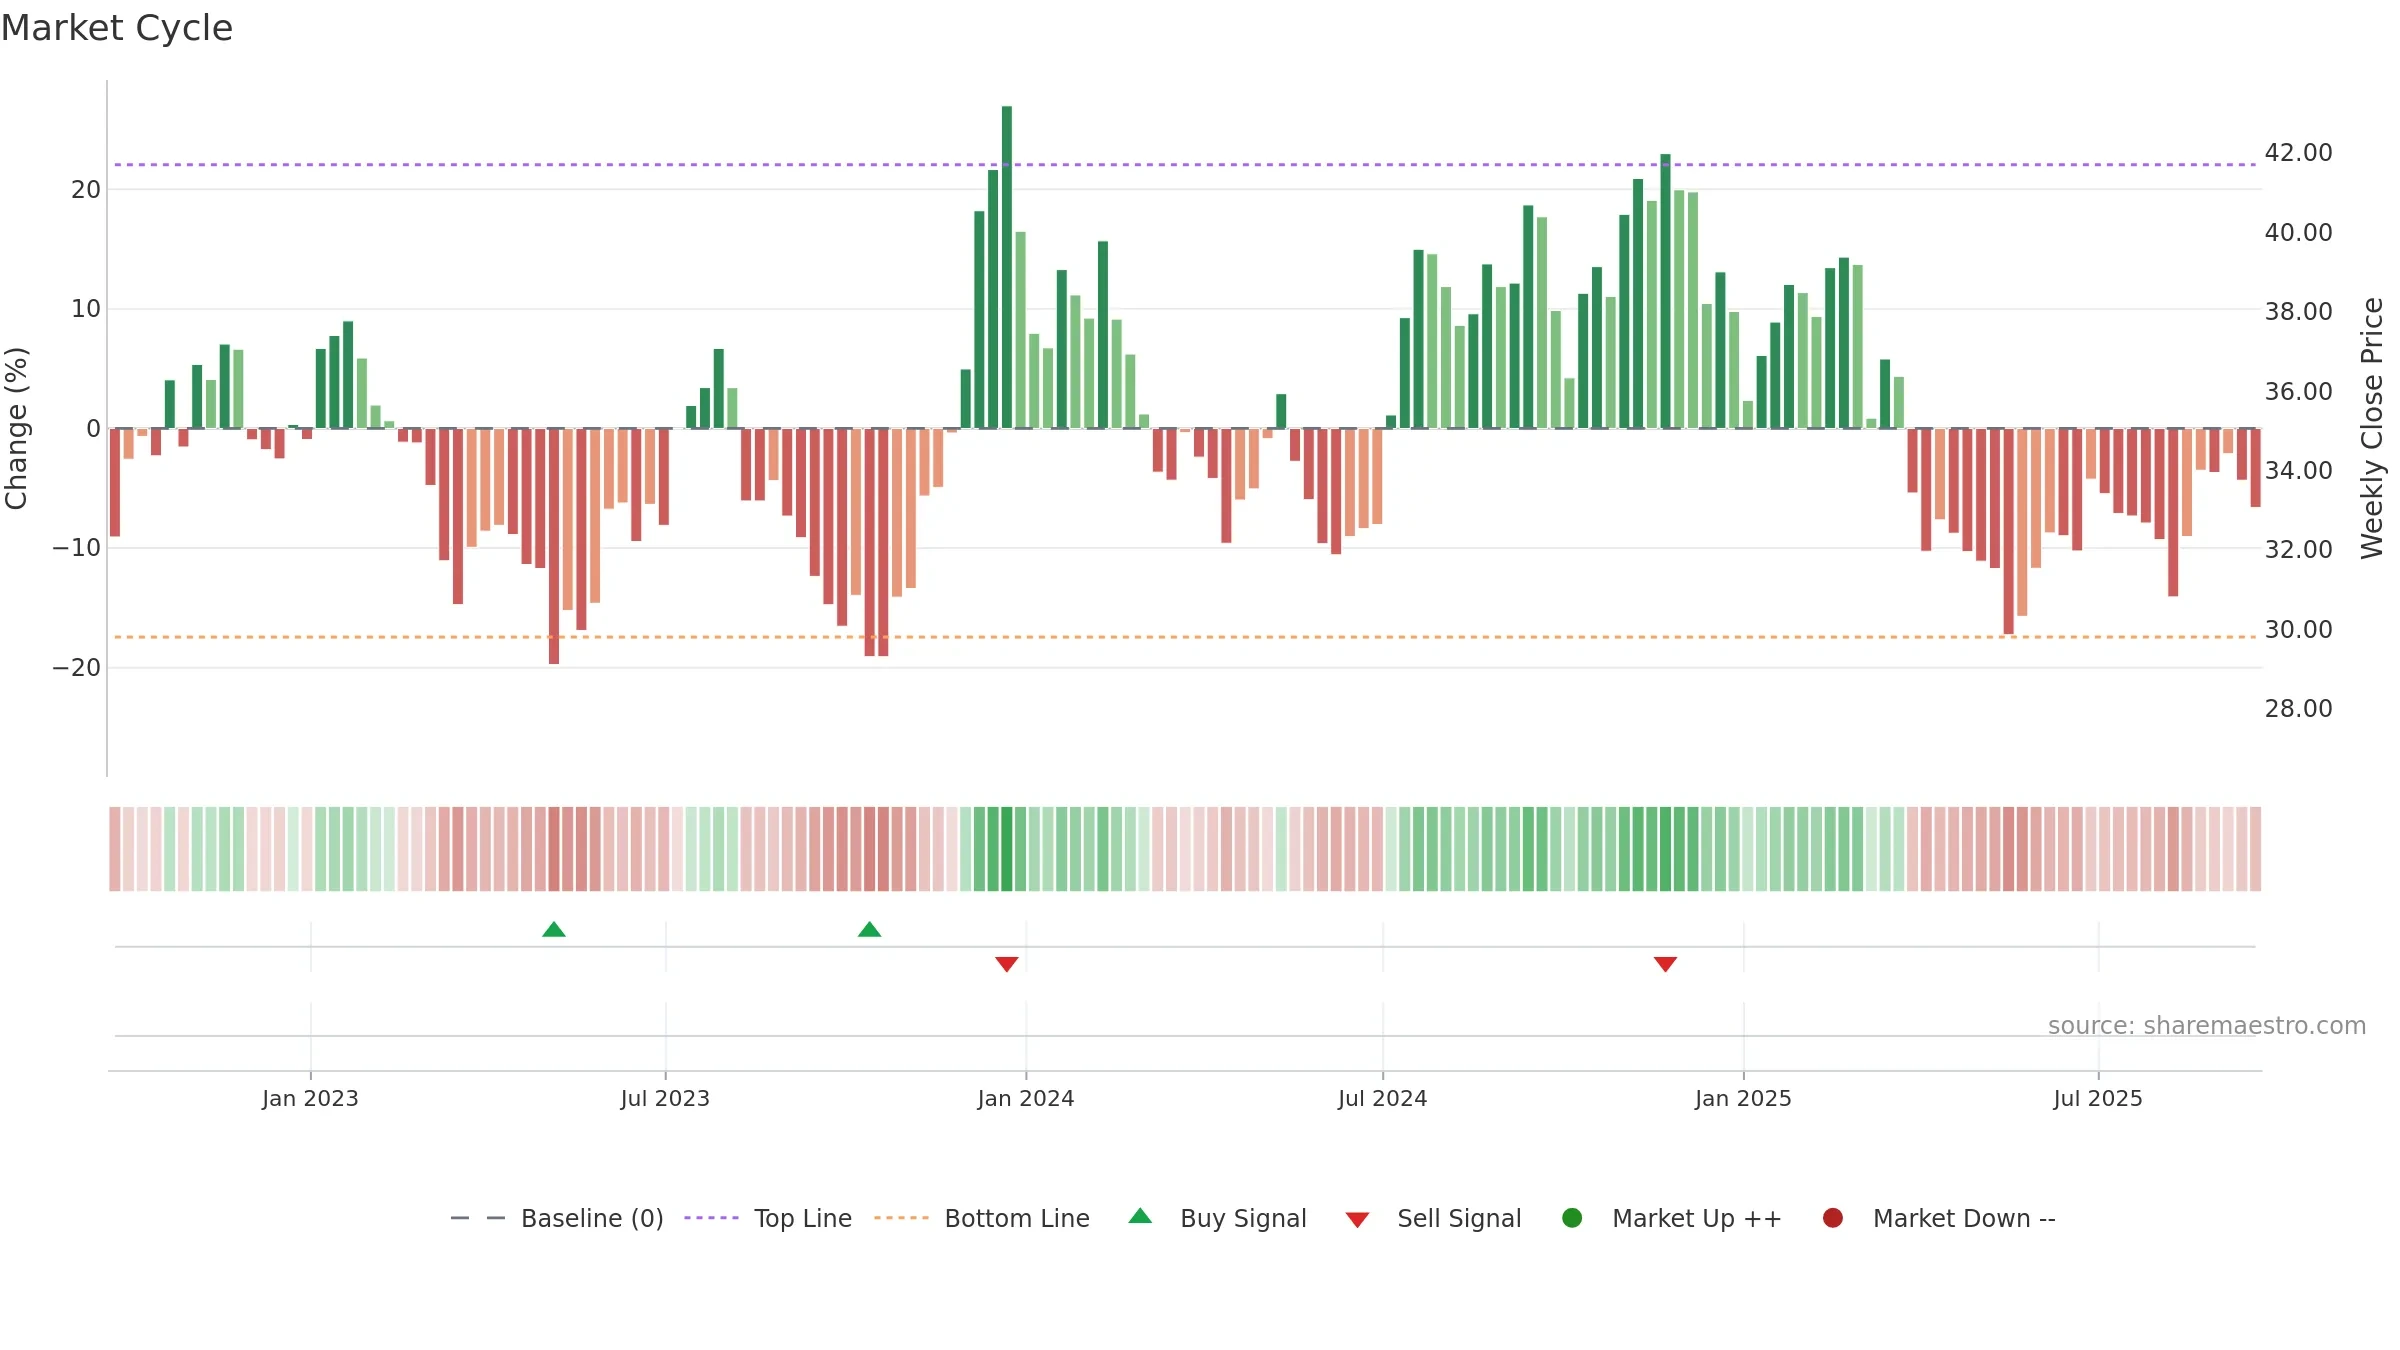
How to read this — Range-bound conditions; conviction is limited until a break or acceleration emerges.
Wait for a directional break or improving acceleration.
Conclusion
Positive setup. ★★★★☆ confidence. Price window: 2. Trend: Range / Neutral; gauge 15. In combination, liquidity confirms the move.
- Liquidity confirms the price trend
- Buyers step in at depressed levels (accumulation)
- Price is not above key averages
Why: Price window 2.97% over 8w. Close is -4.59% below the prior-window high. Return volatility 2.11%. Volume trend rising. Liquidity convergence with price. Trend state range / neutral. Low-regime (≤0.25) upticks 5/7 (71.0%) • Accumulating. Momentum neutral and rising.
Tip: Most metrics include a hover tooltip where they appear in the report.