John B. Sanfilippo & Son, Inc.
JBSS NASDAQ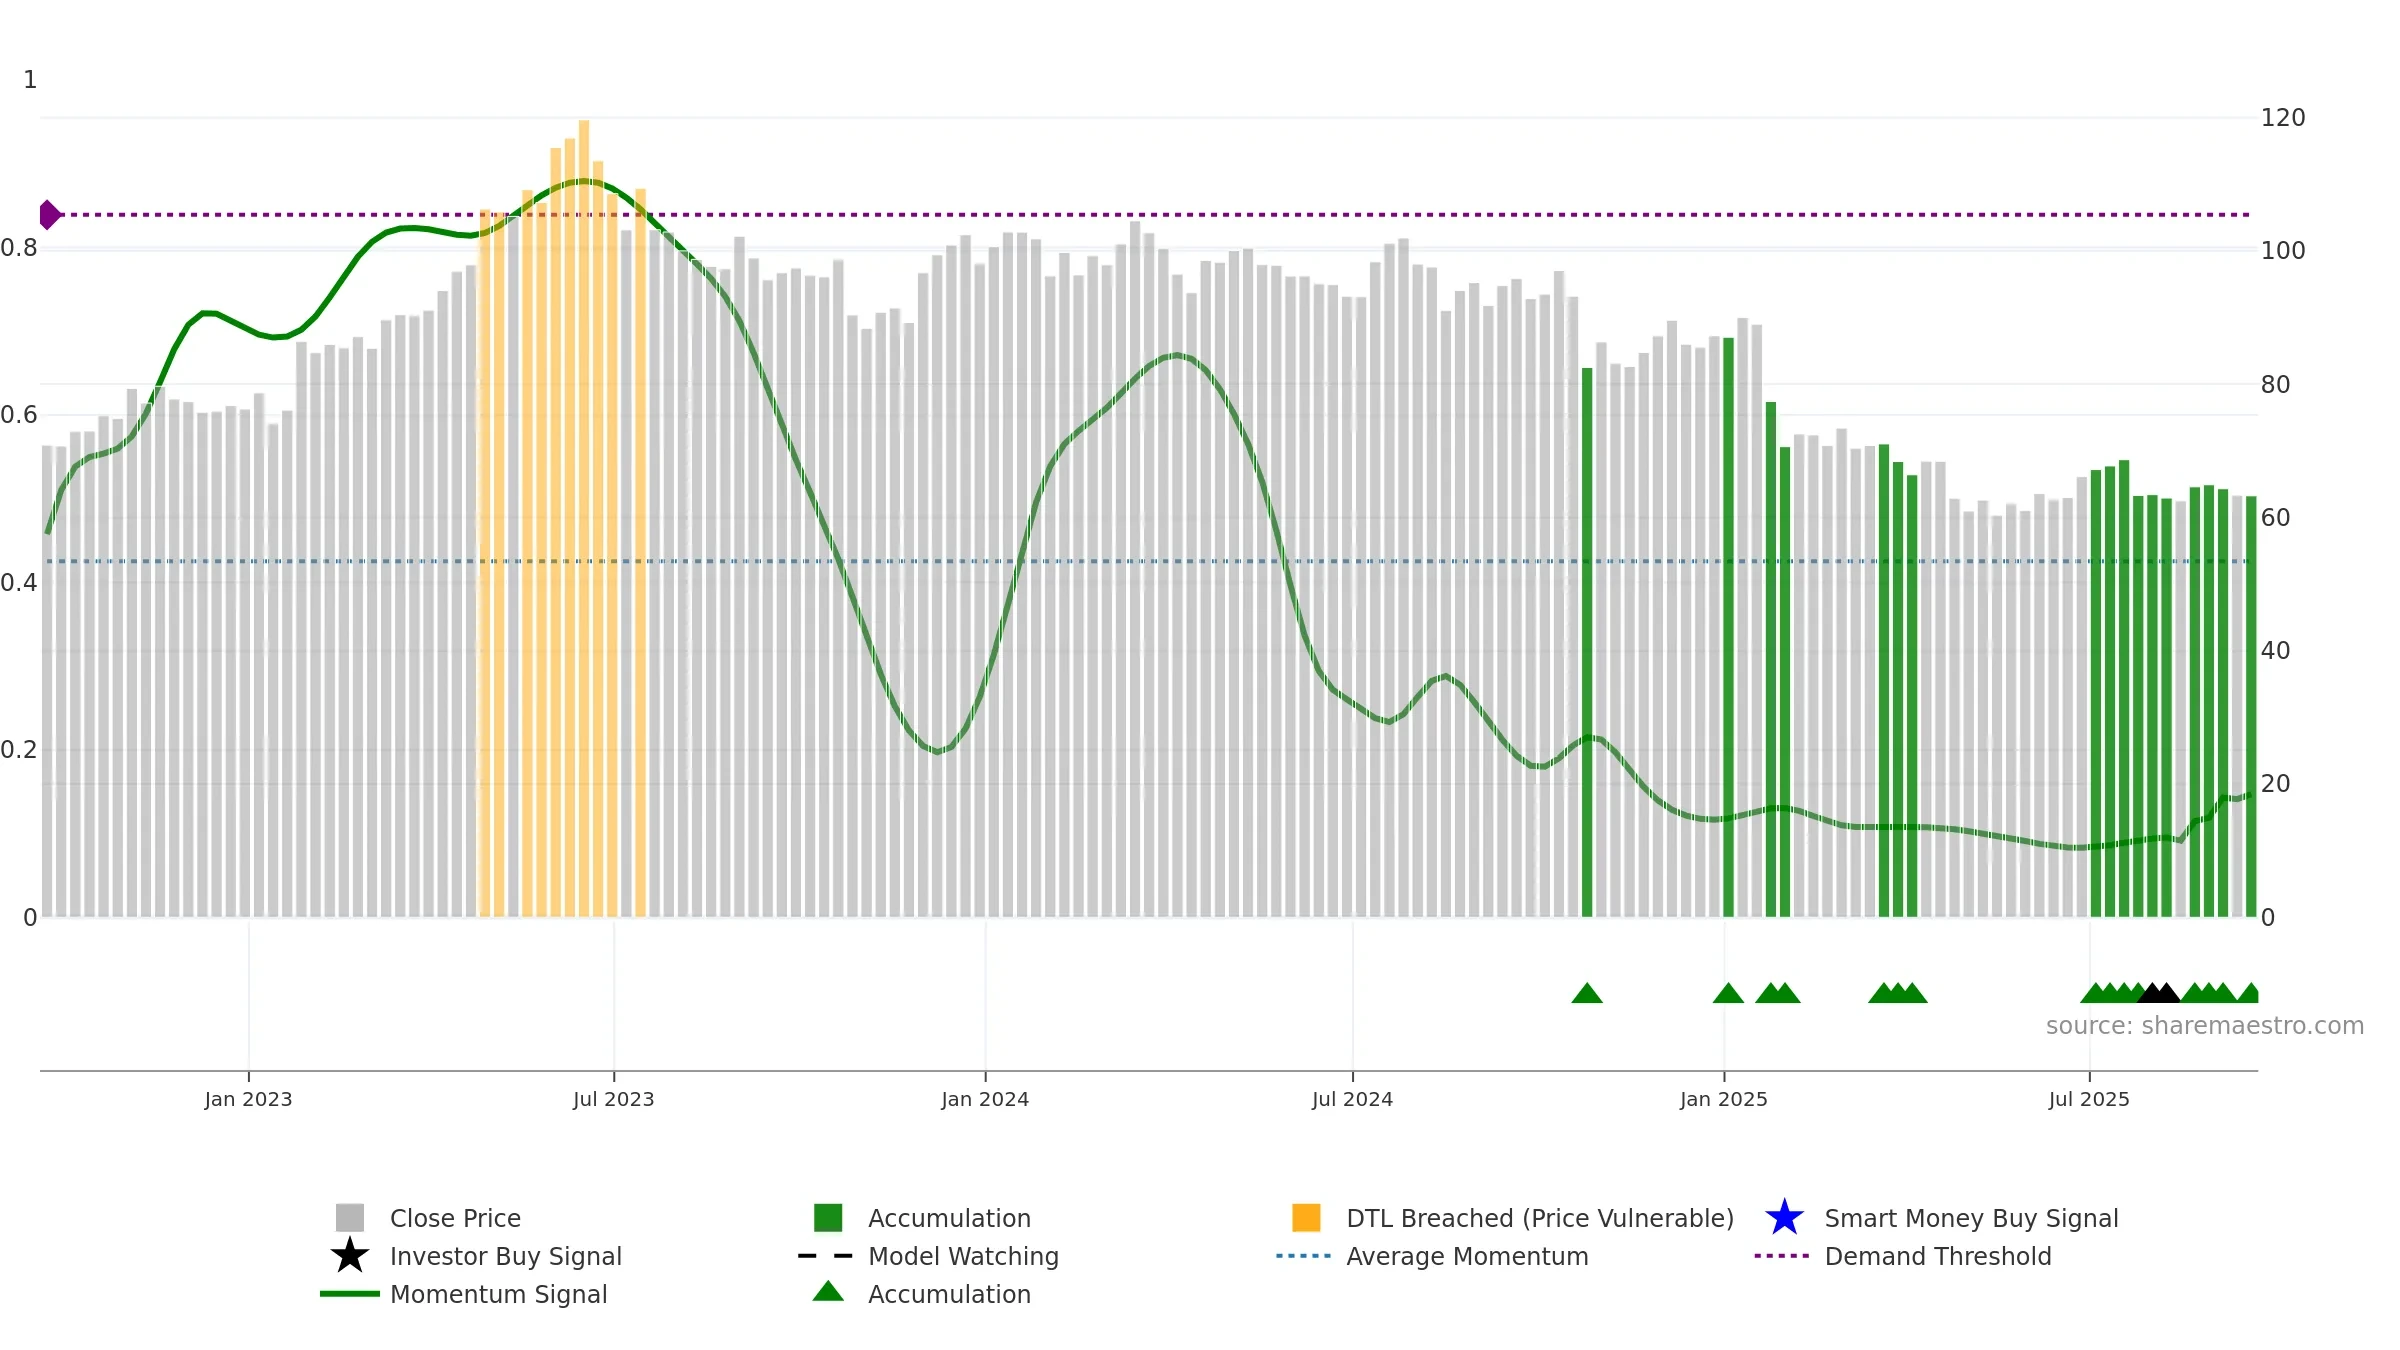
Weekly Report
John B. Sanfilippo & Son, Inc. closed at 63.2400 (-2.03% WoW) . Data window ends Fri, 19 Sep 2025.
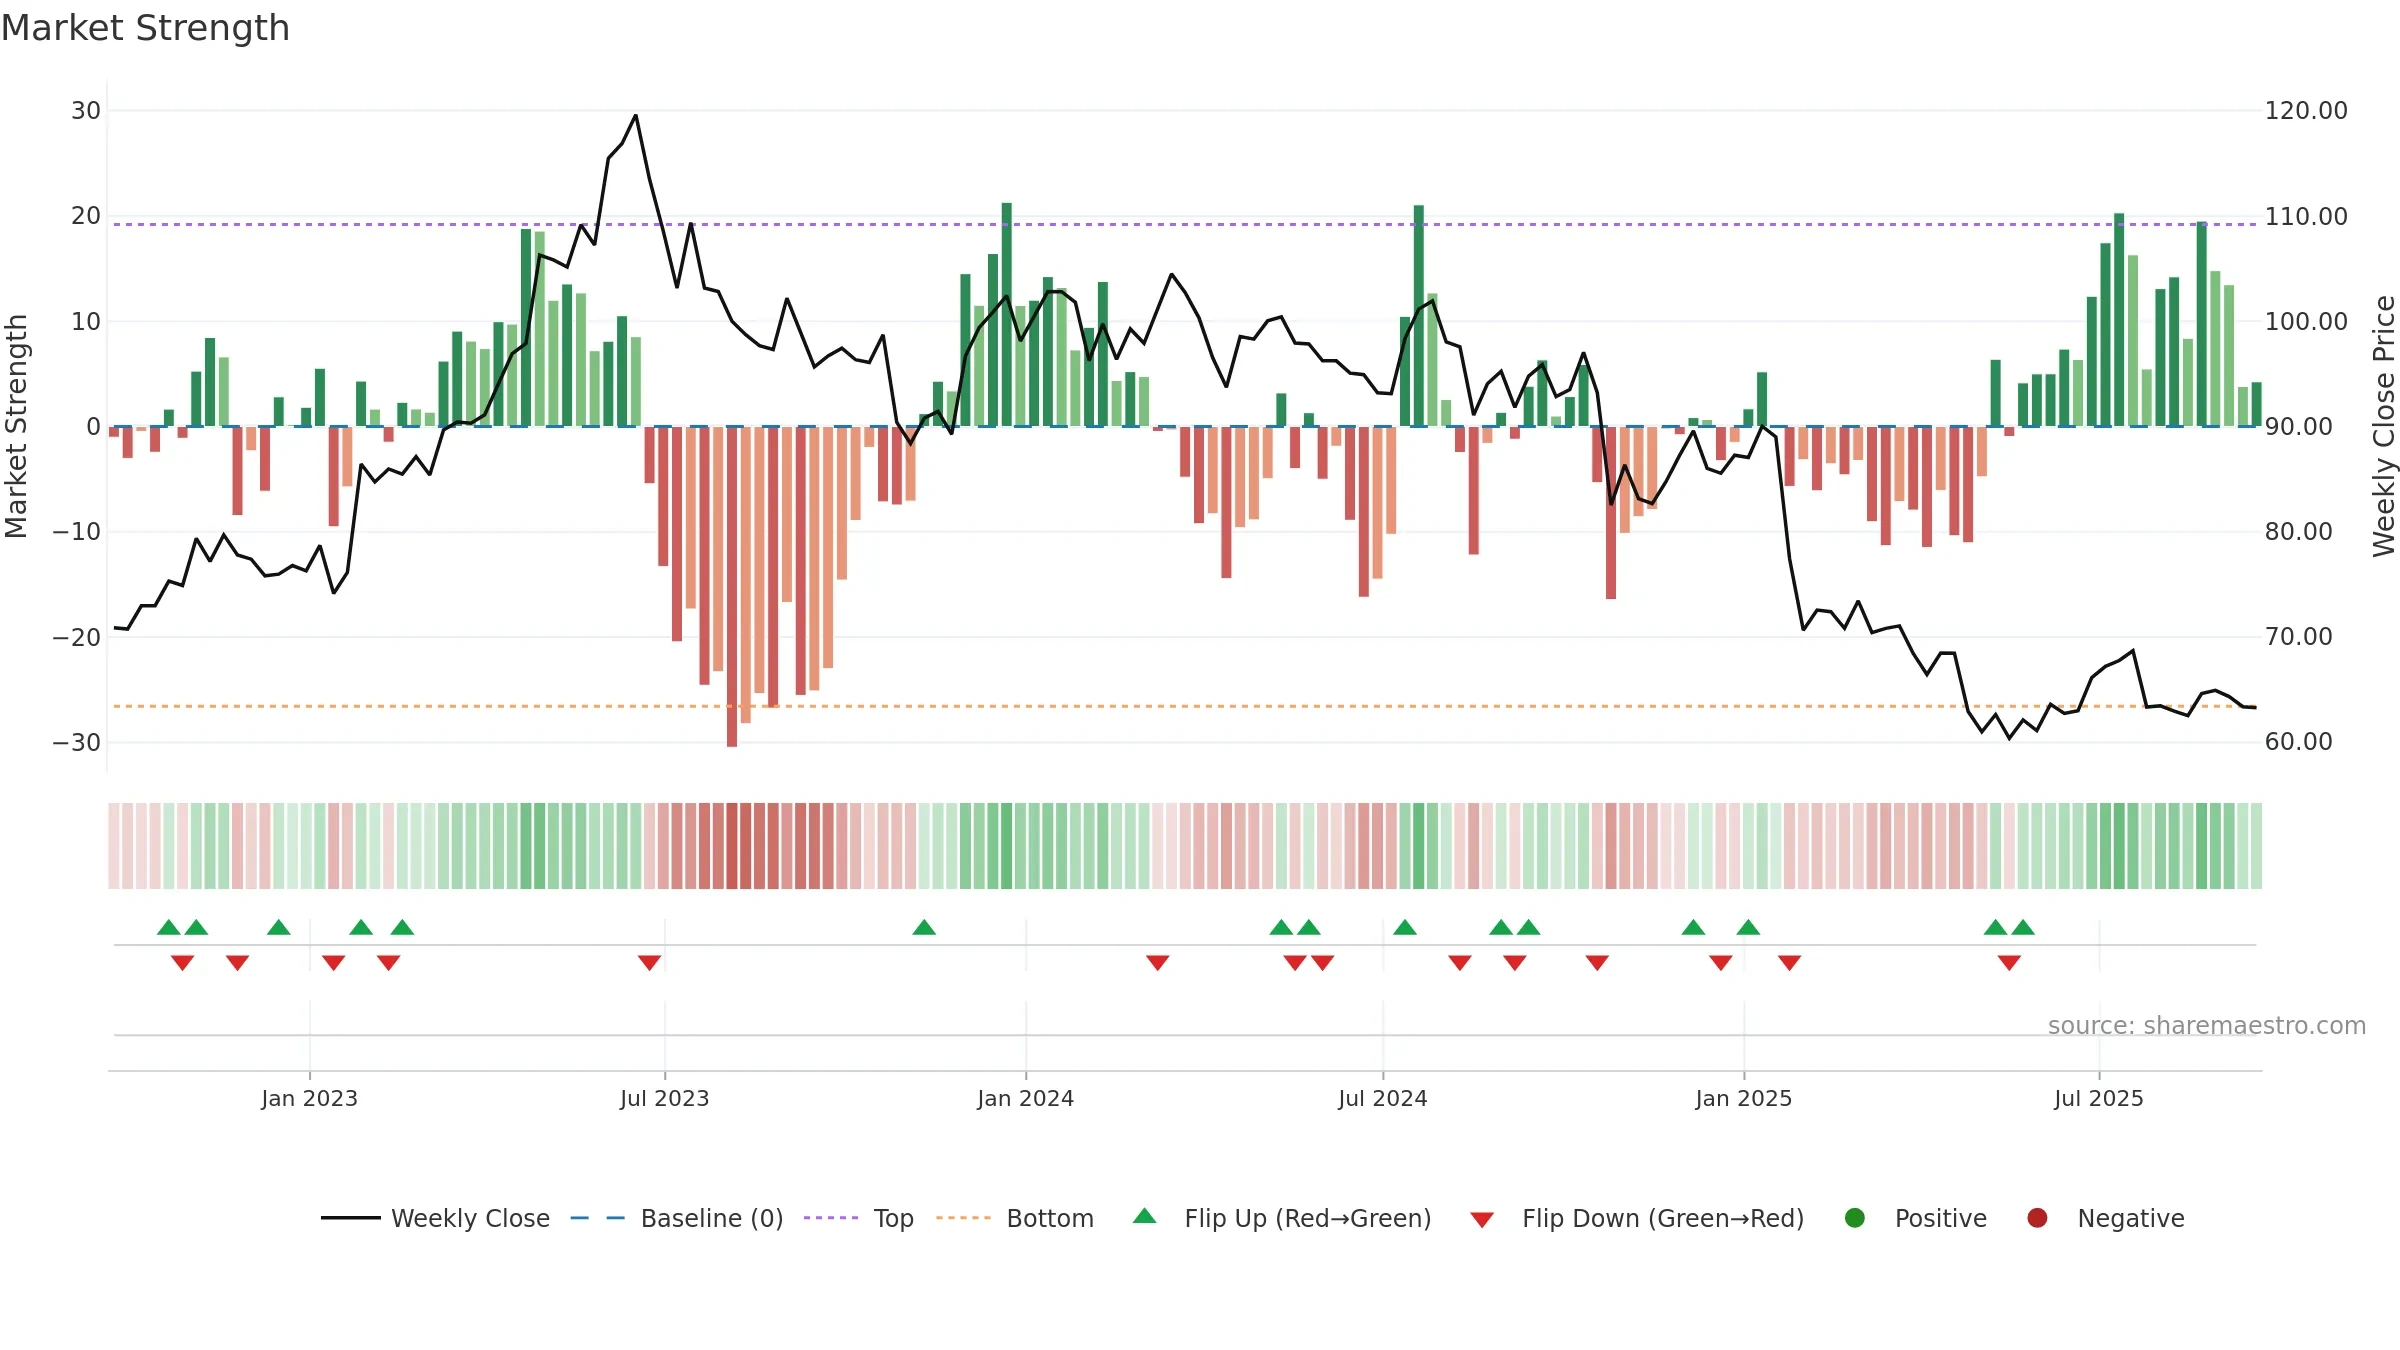
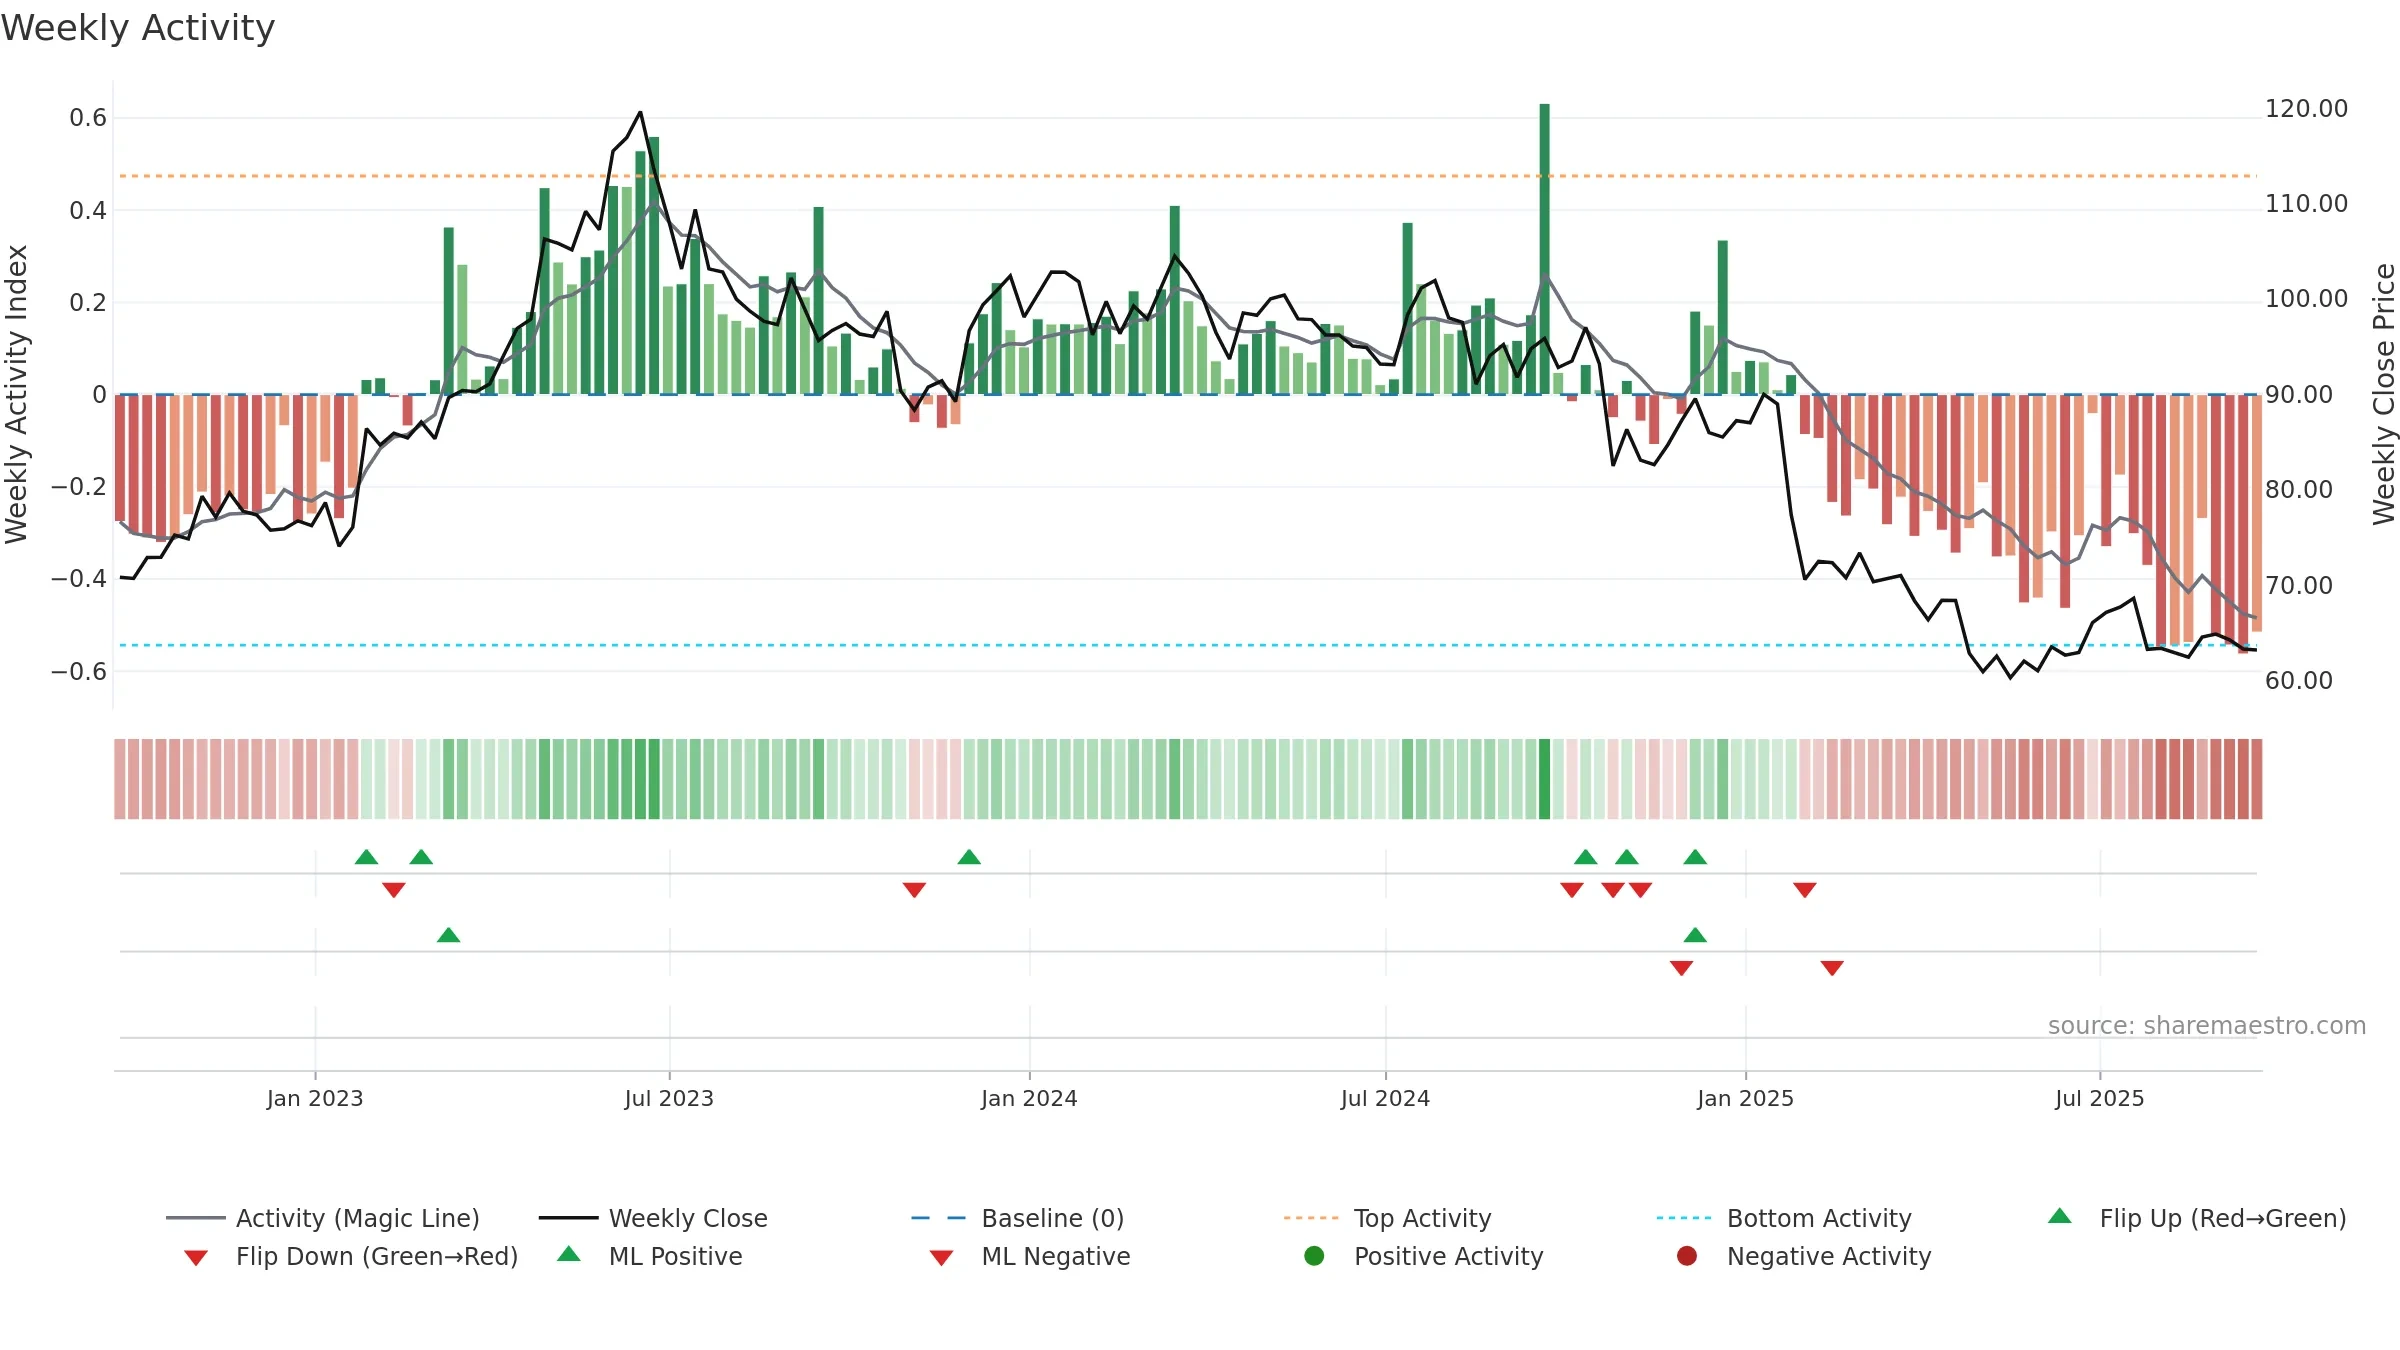
How to read this — Price slope is upward, indicating persistent buying over the window. Low weekly volatility favours steadier follow-through. Volume trend diverges from price — watch for fatigue or rotation. Price is extended below its baseline; rebounds can be sharp if demand improves. Distance to baseline is narrowing — reverting closer to its fair-value track. Price sits below key averages, keeping pressure on the tape.
Up-slope supports buying interest; pullbacks may be contained if activity stays firm. Because liquidity isn’t confirming, prefer evidence of fresh demand before chasing moves.
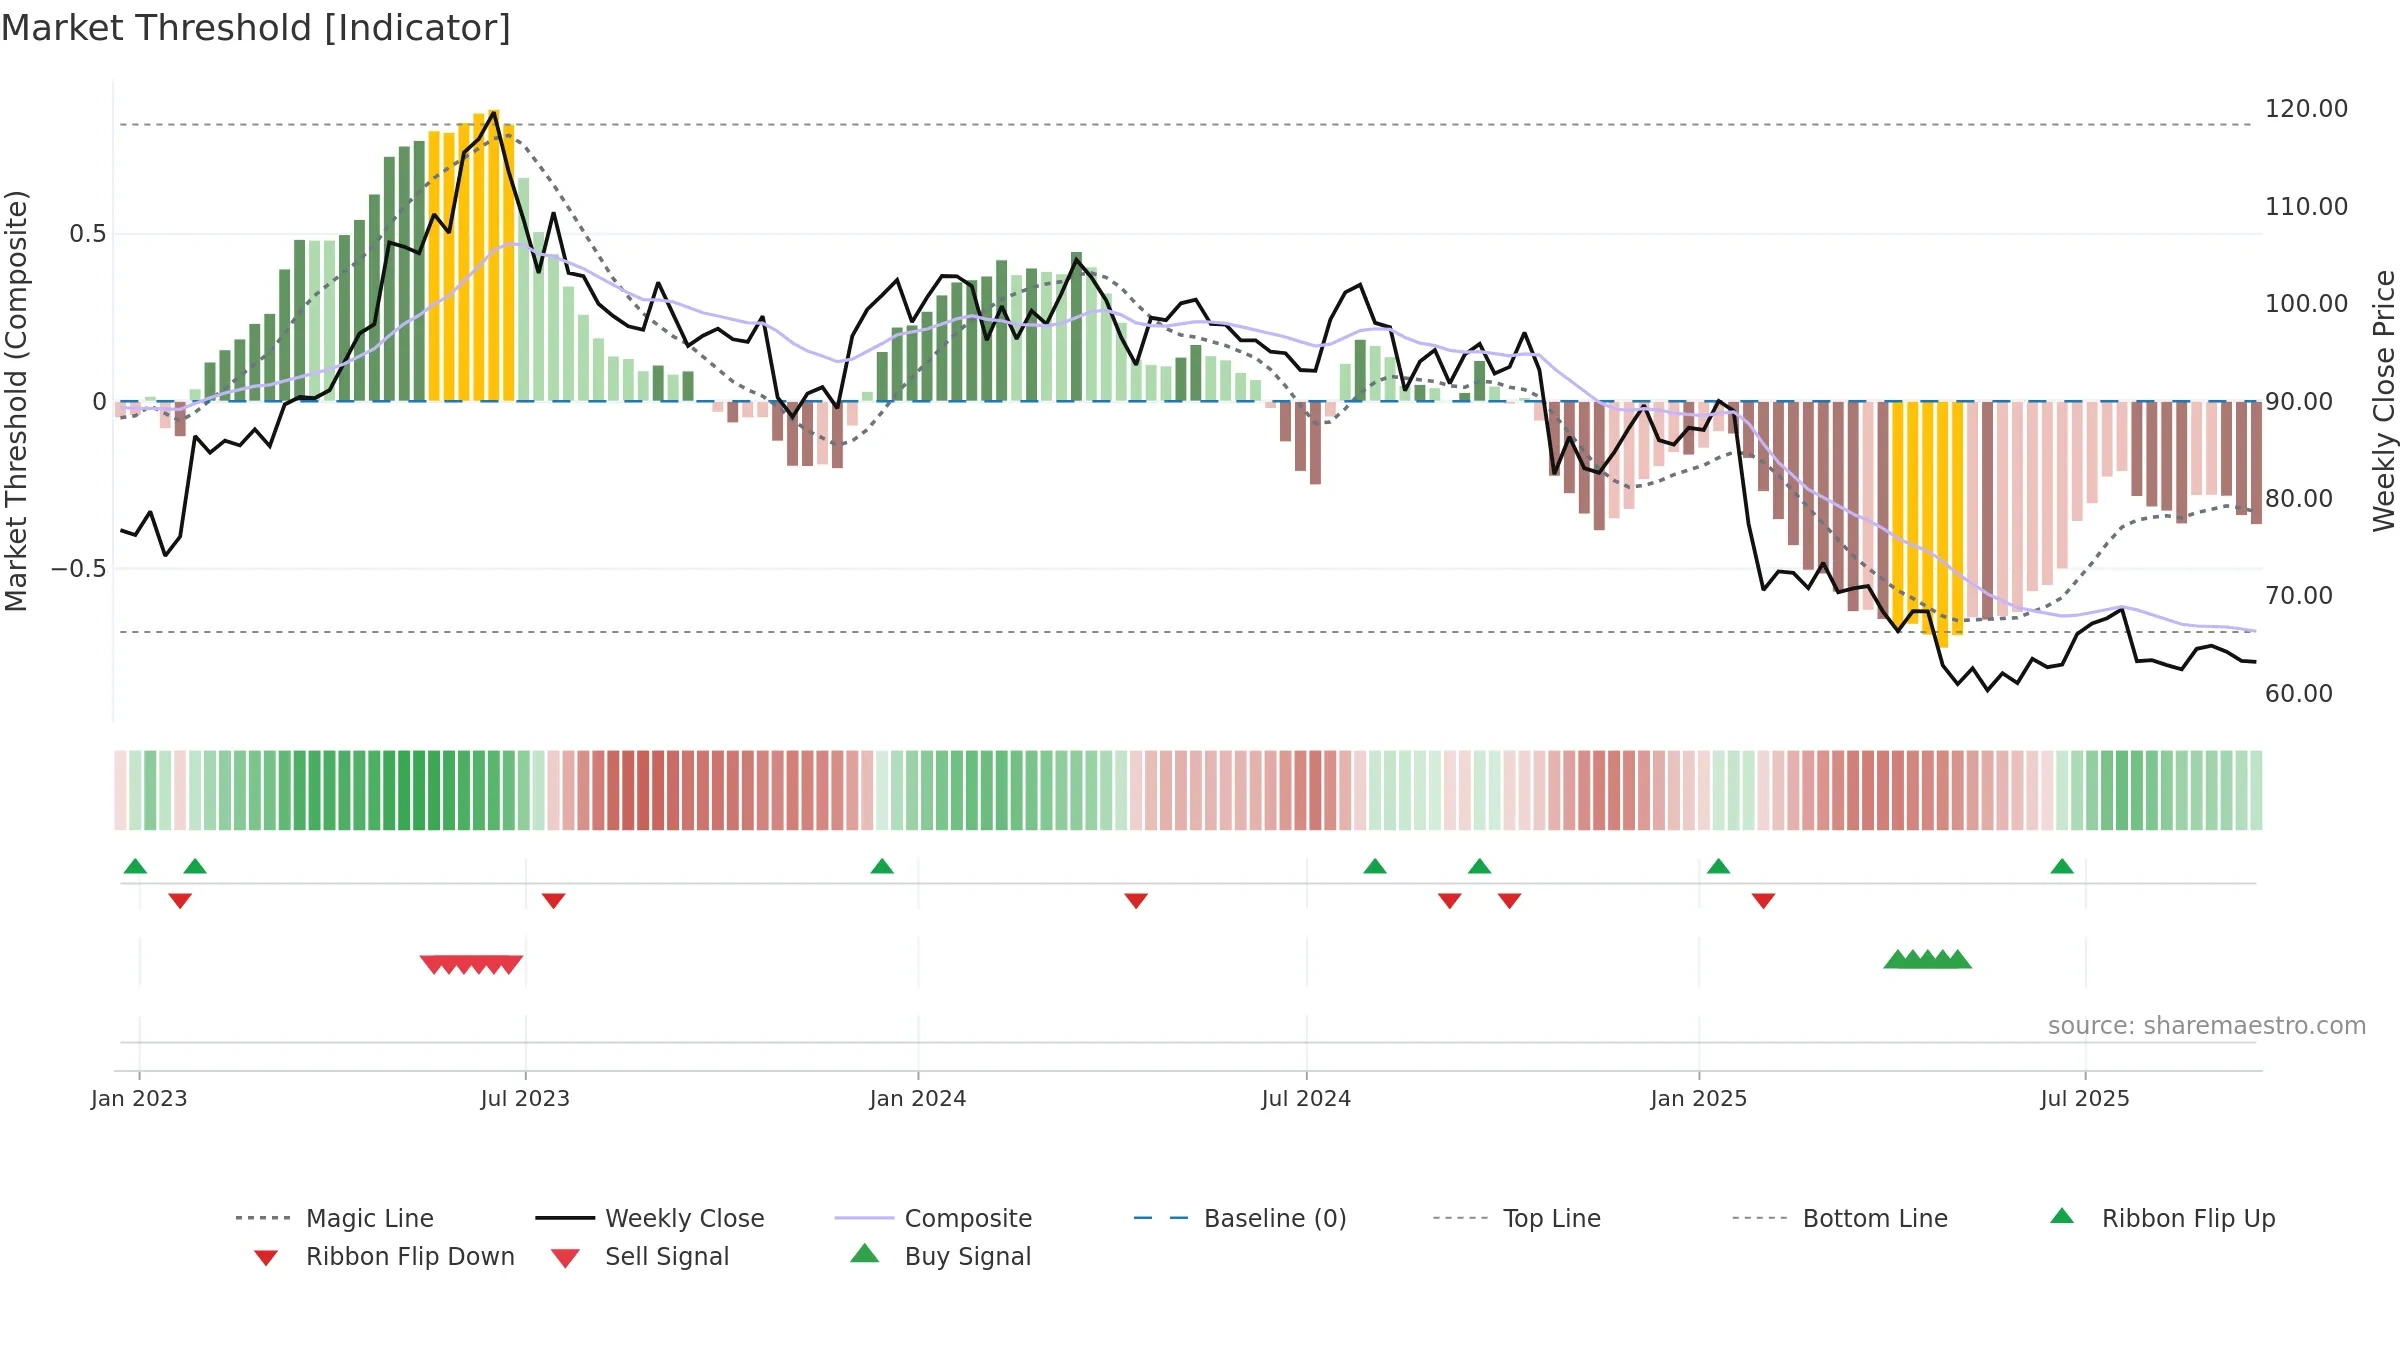
Gauge maps the trend signal to a 0–100 scale.
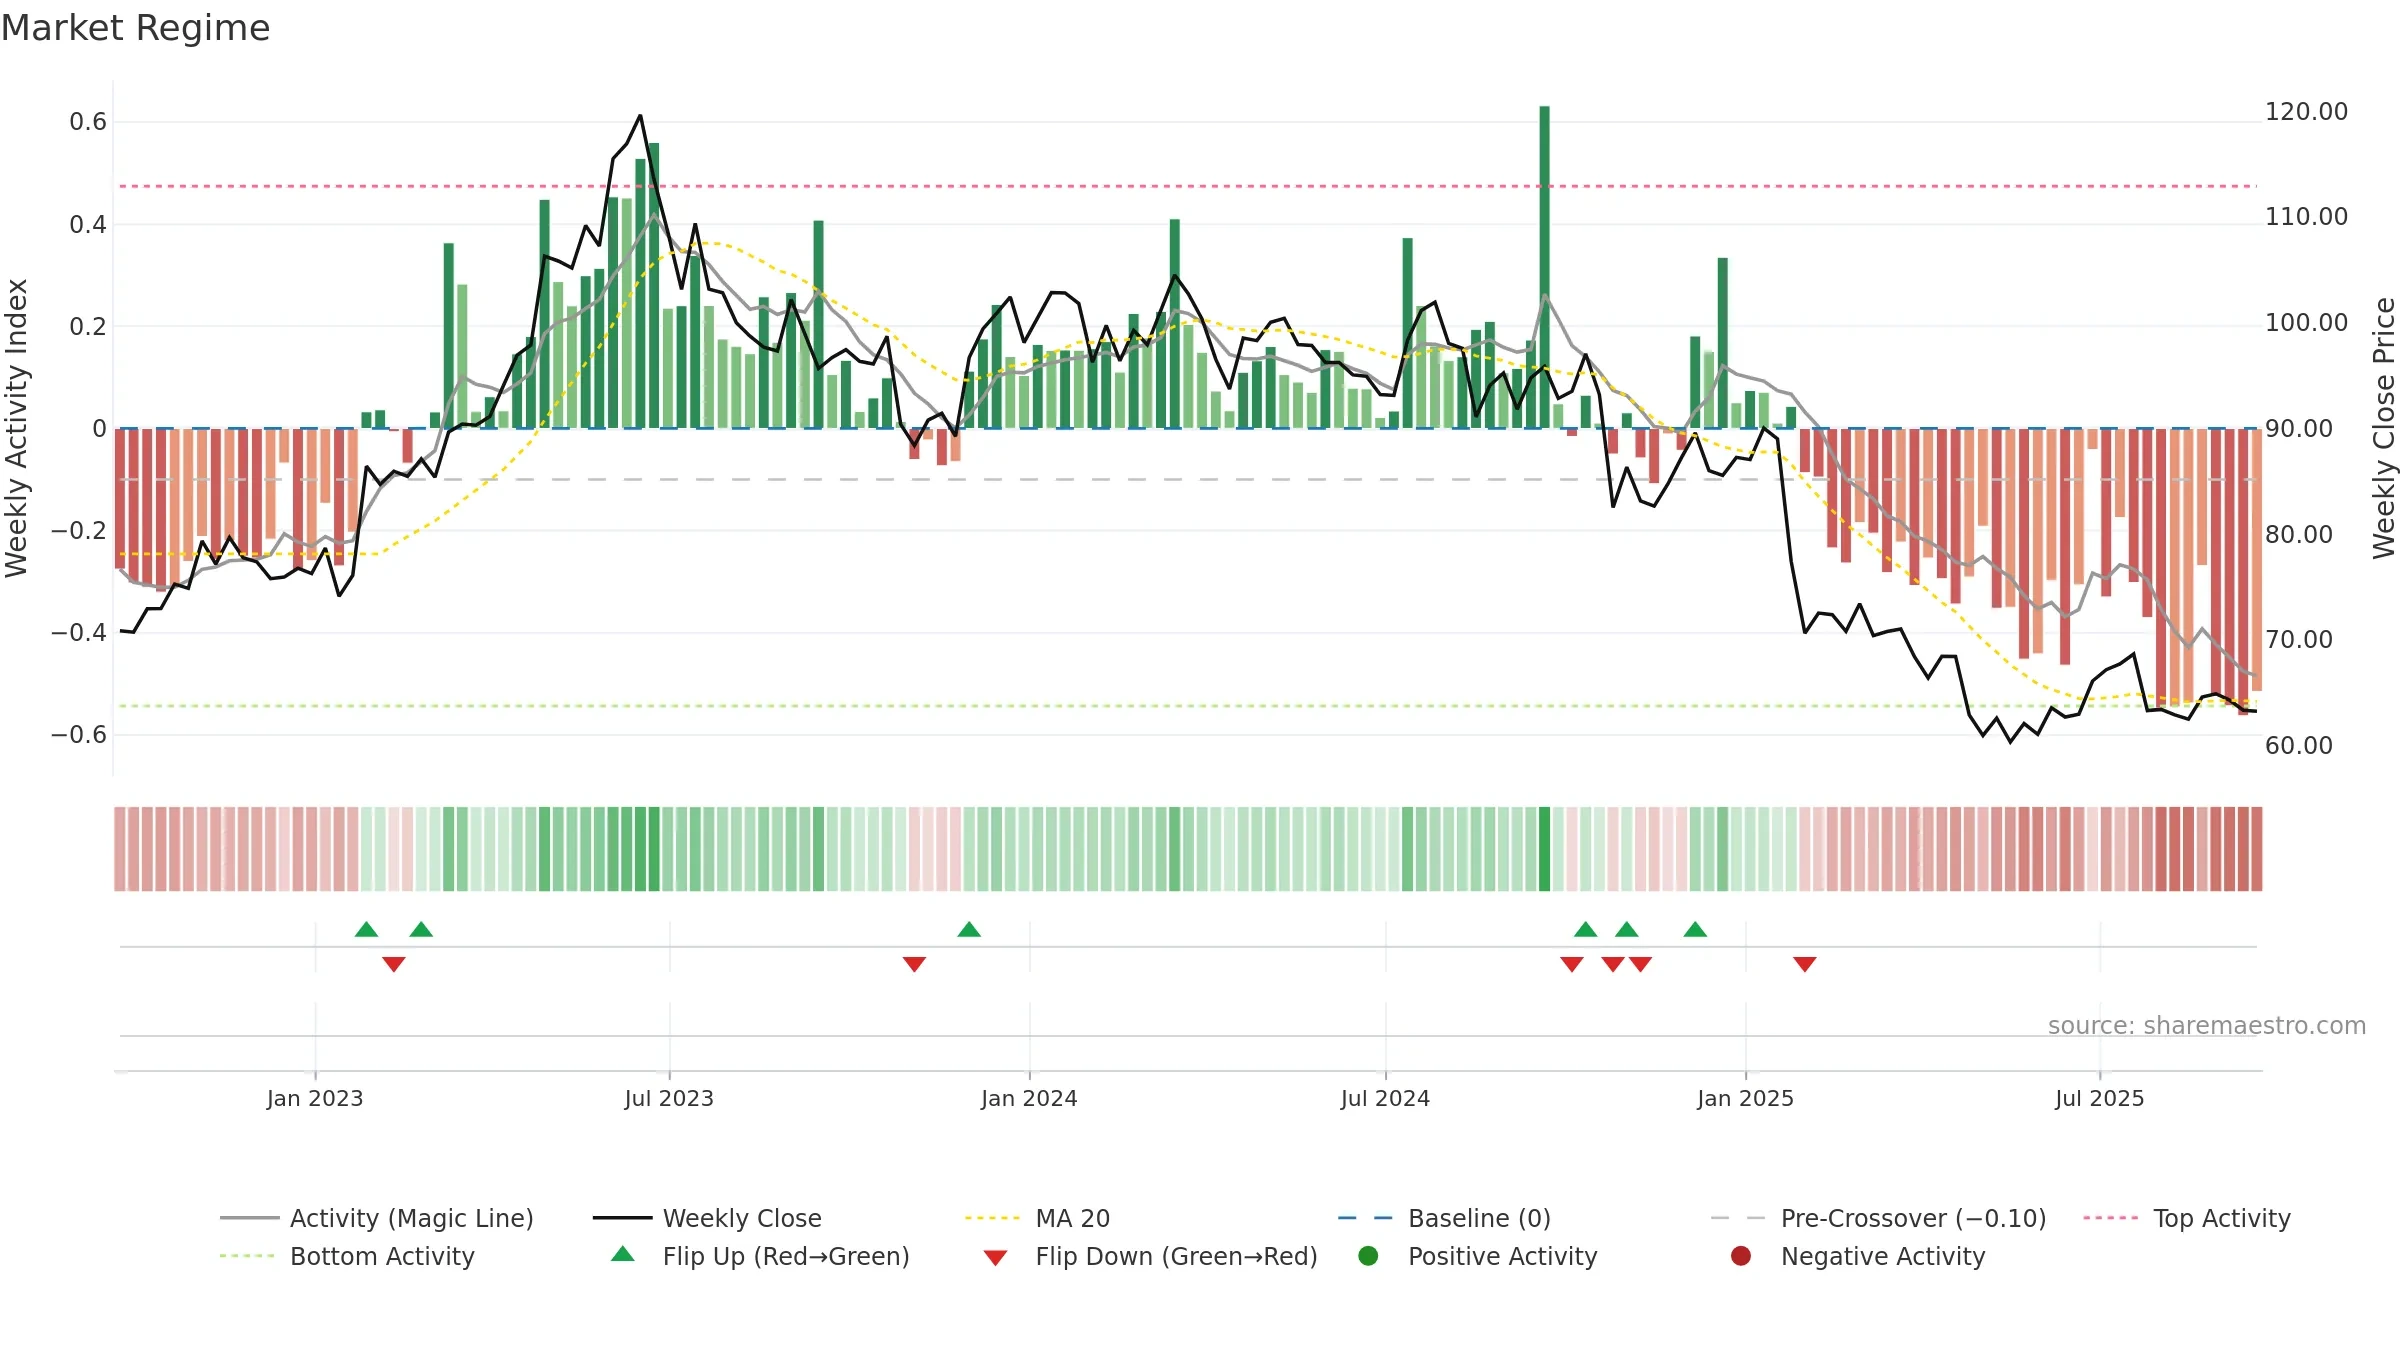
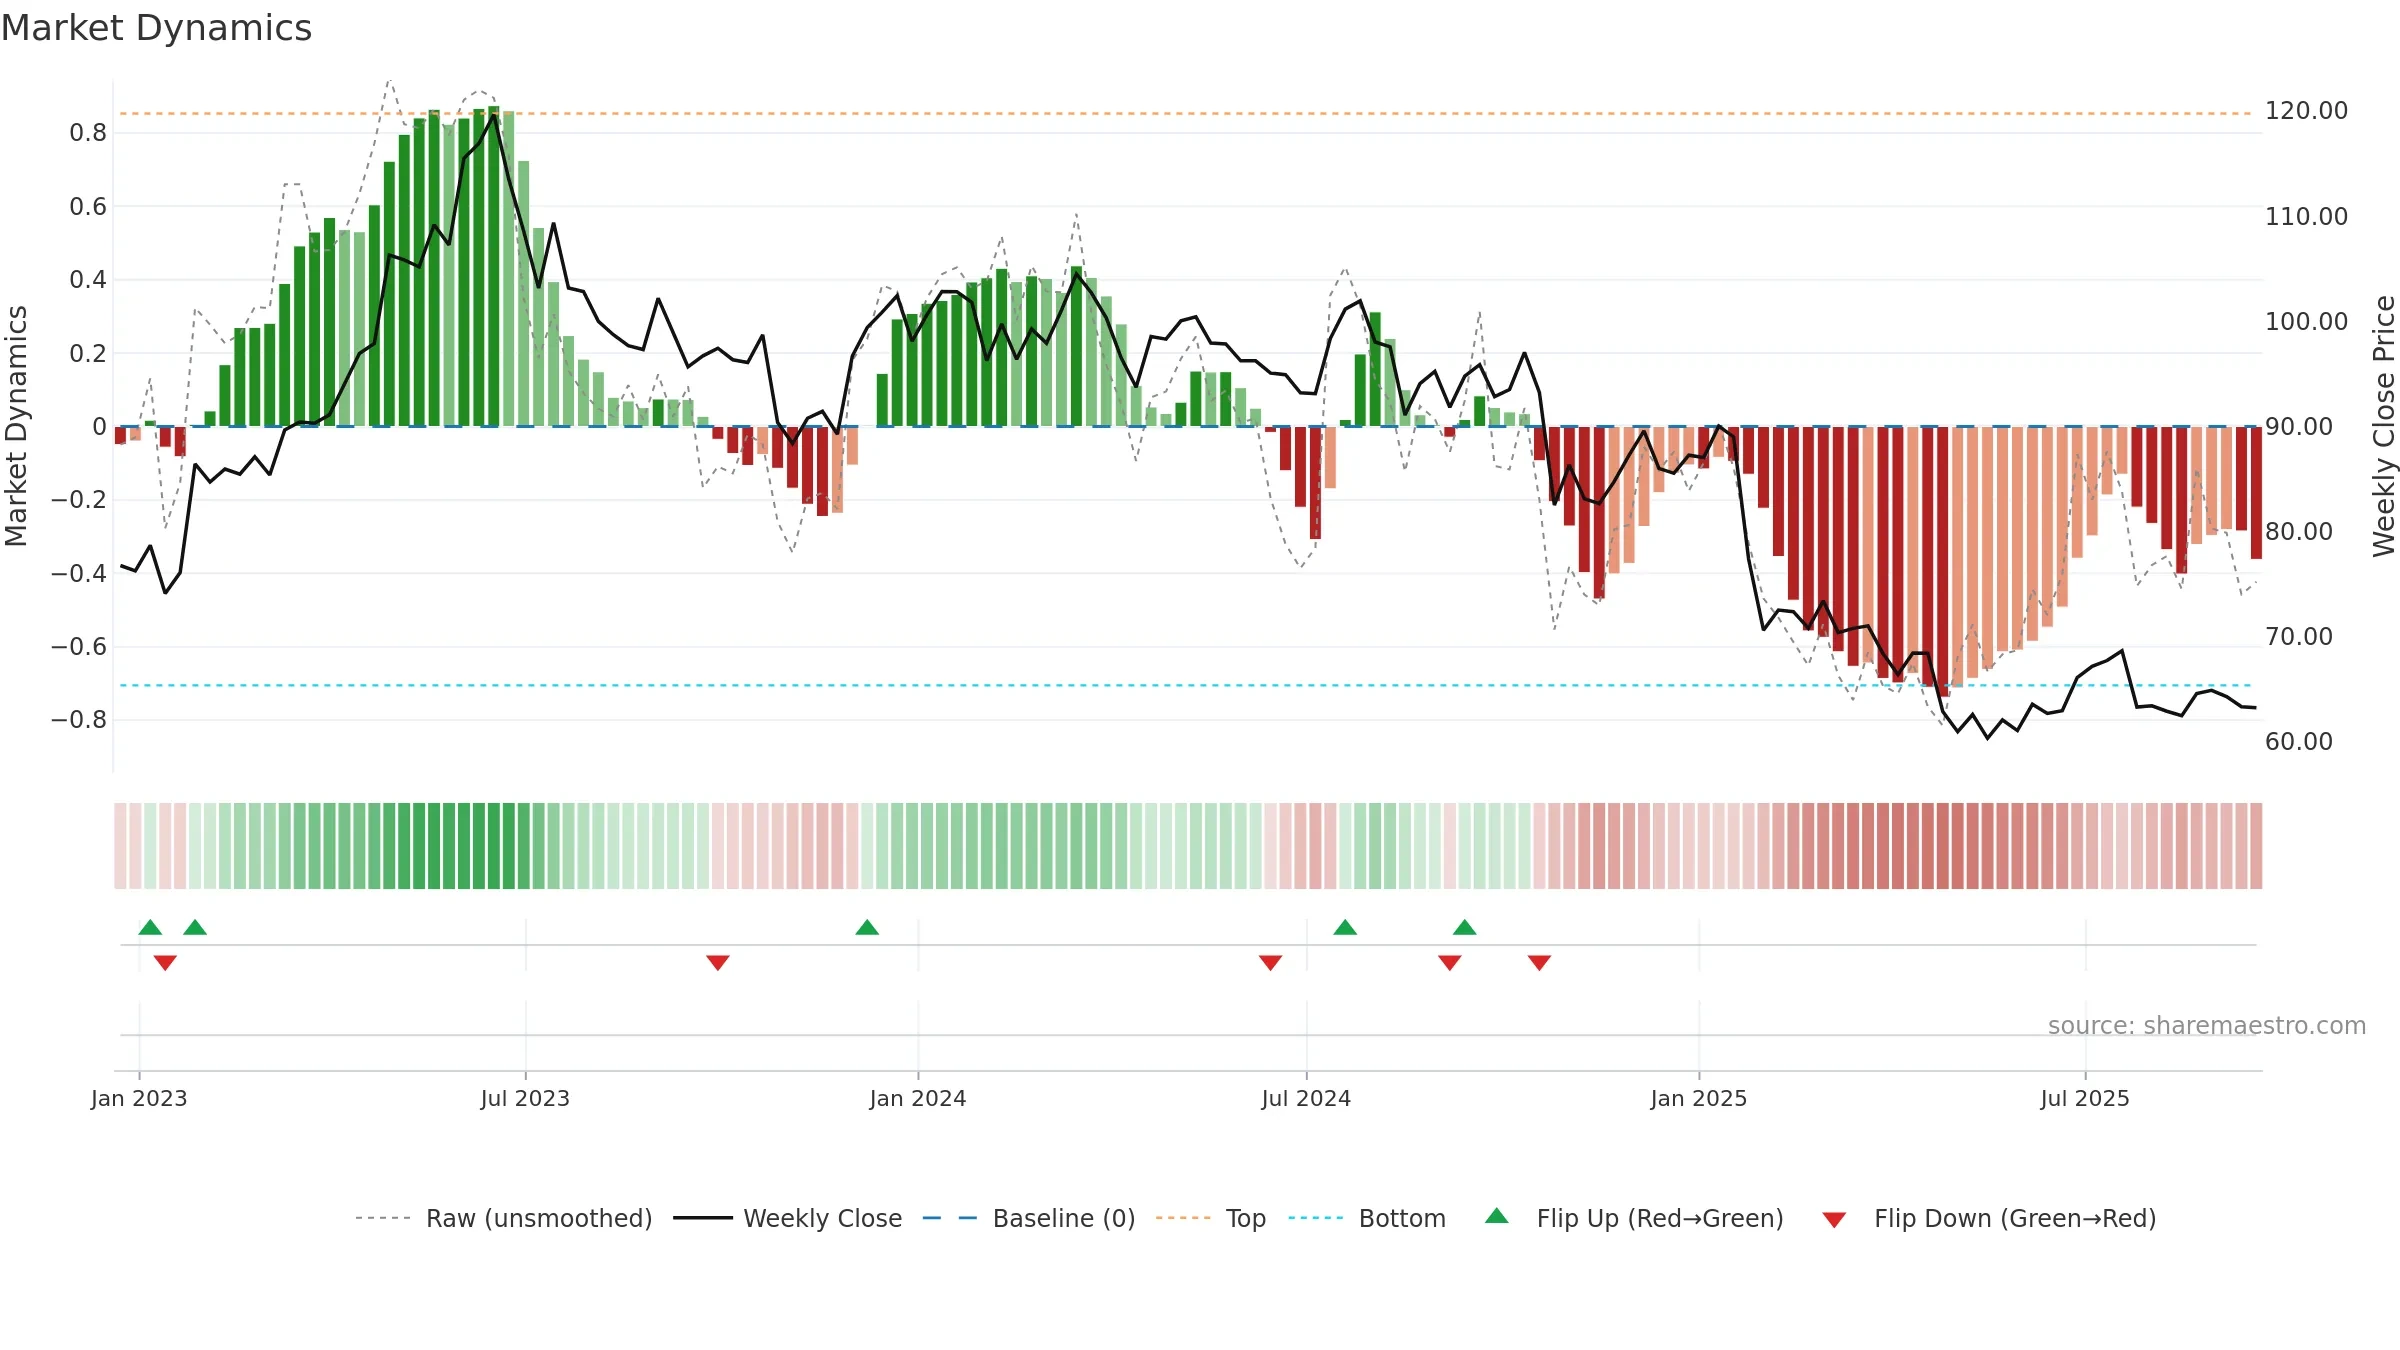
How to read this — Bearish backdrop but short-term momentum is improving; confirmation still needed.
Early improvement — look for a reclaim of 0.50→0.60 to validate.
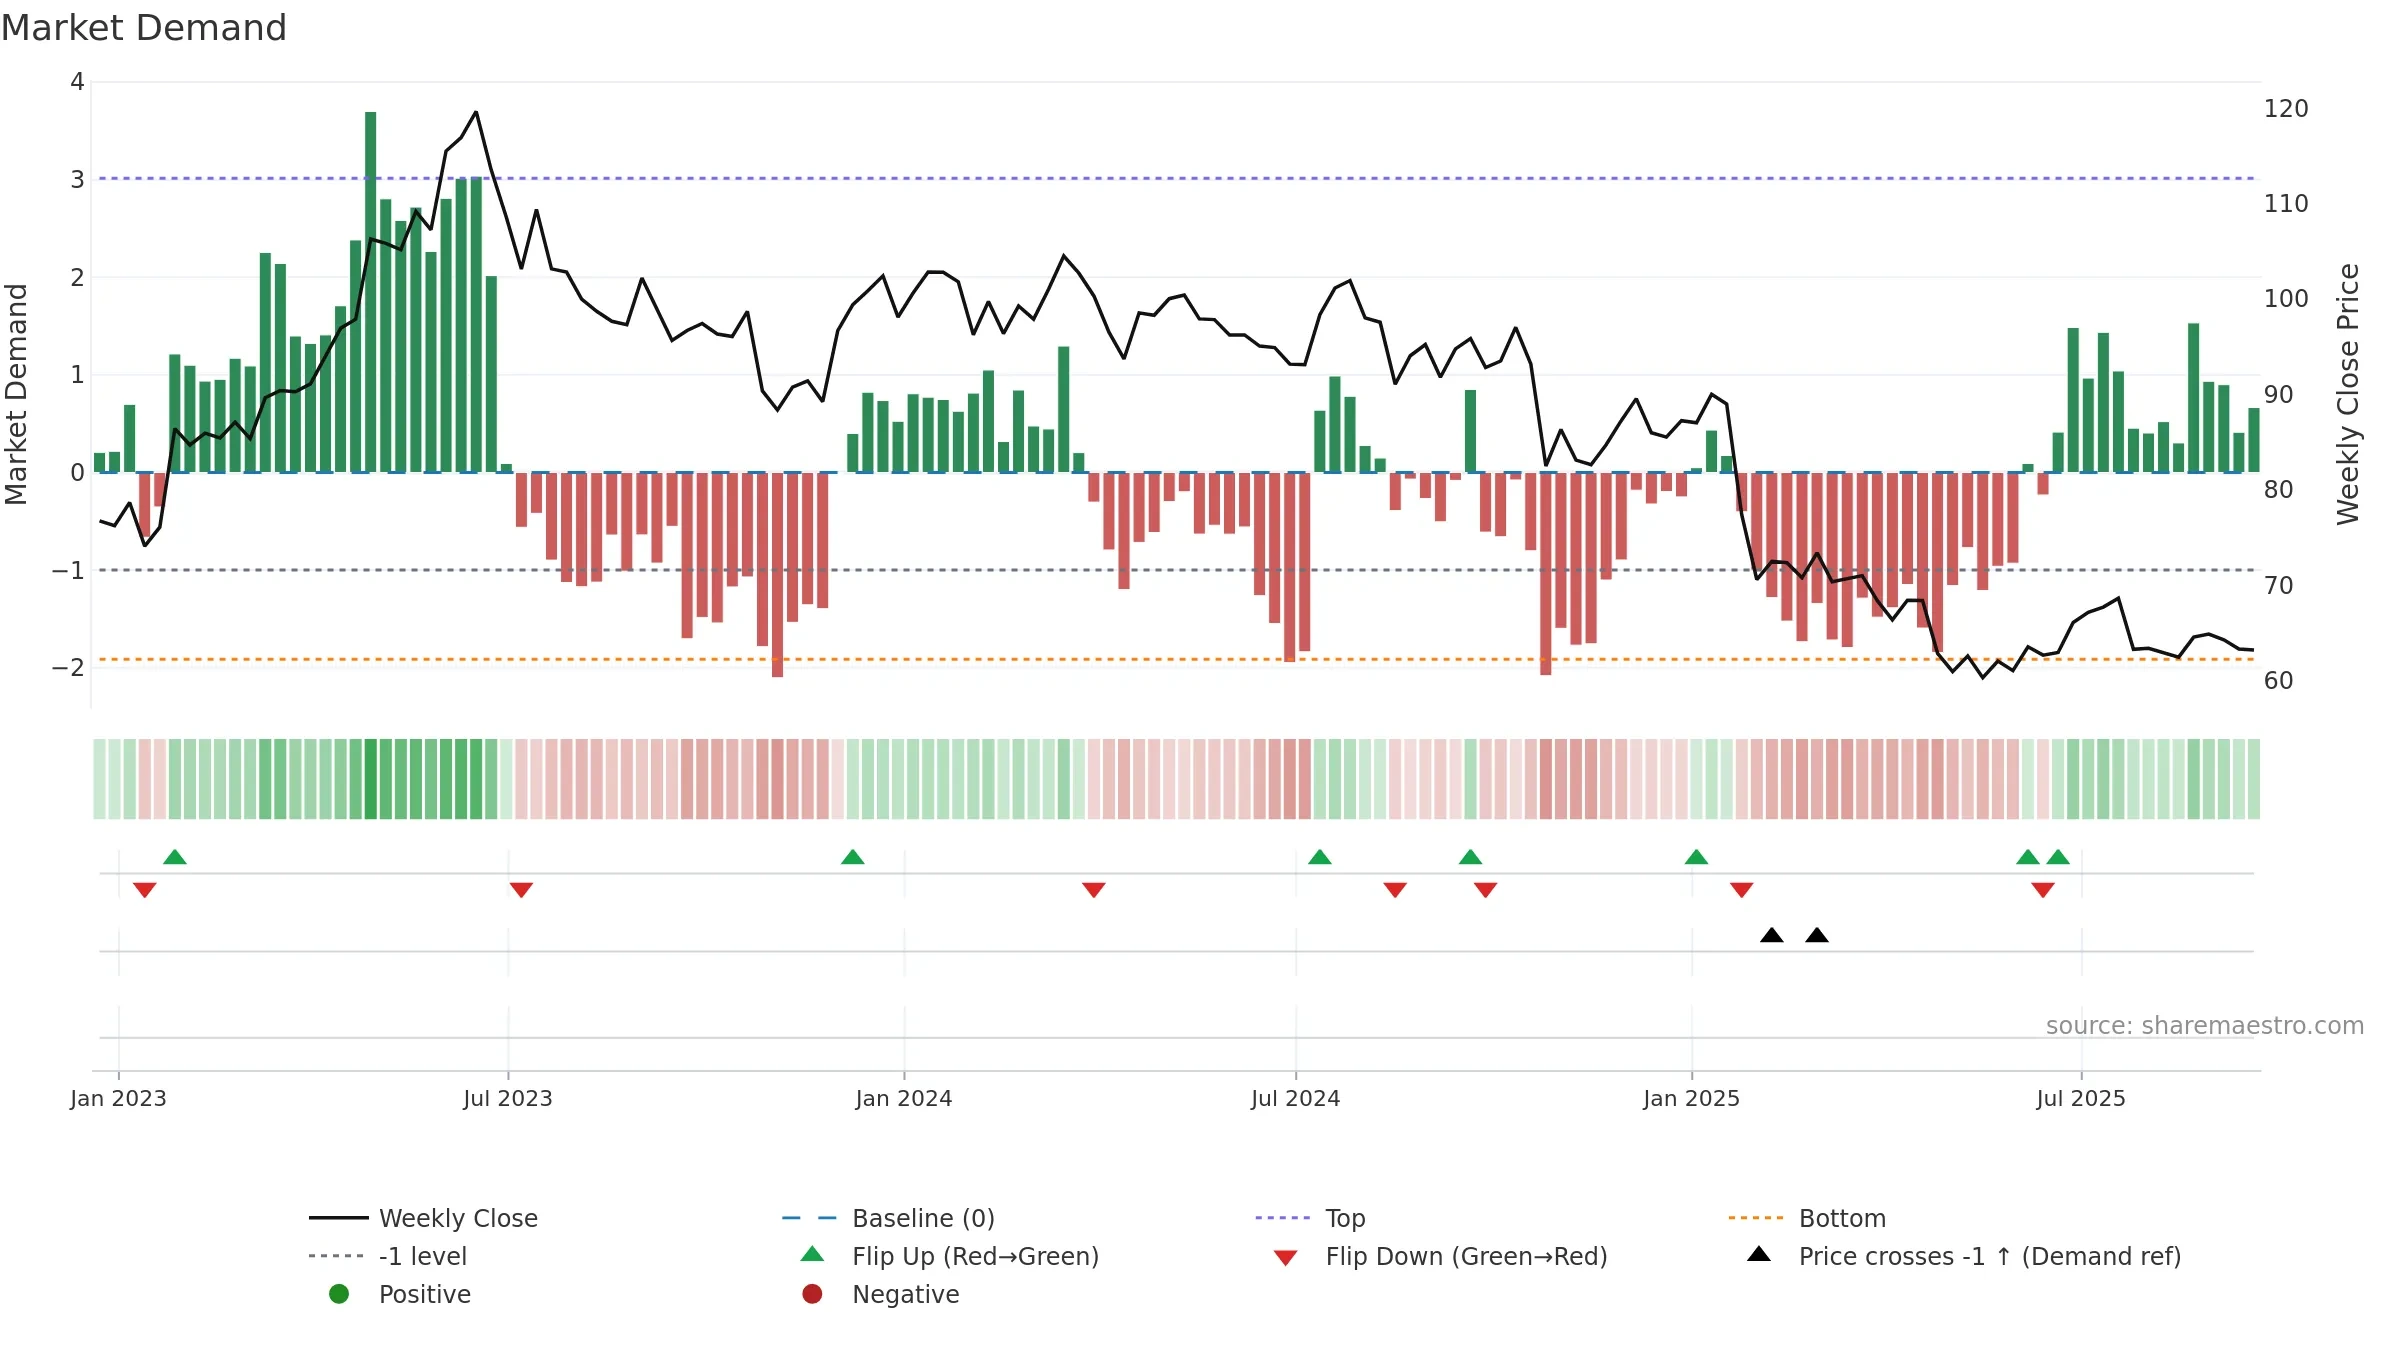
Price is above fair value; upside may be capped without catalysts.
Conclusion
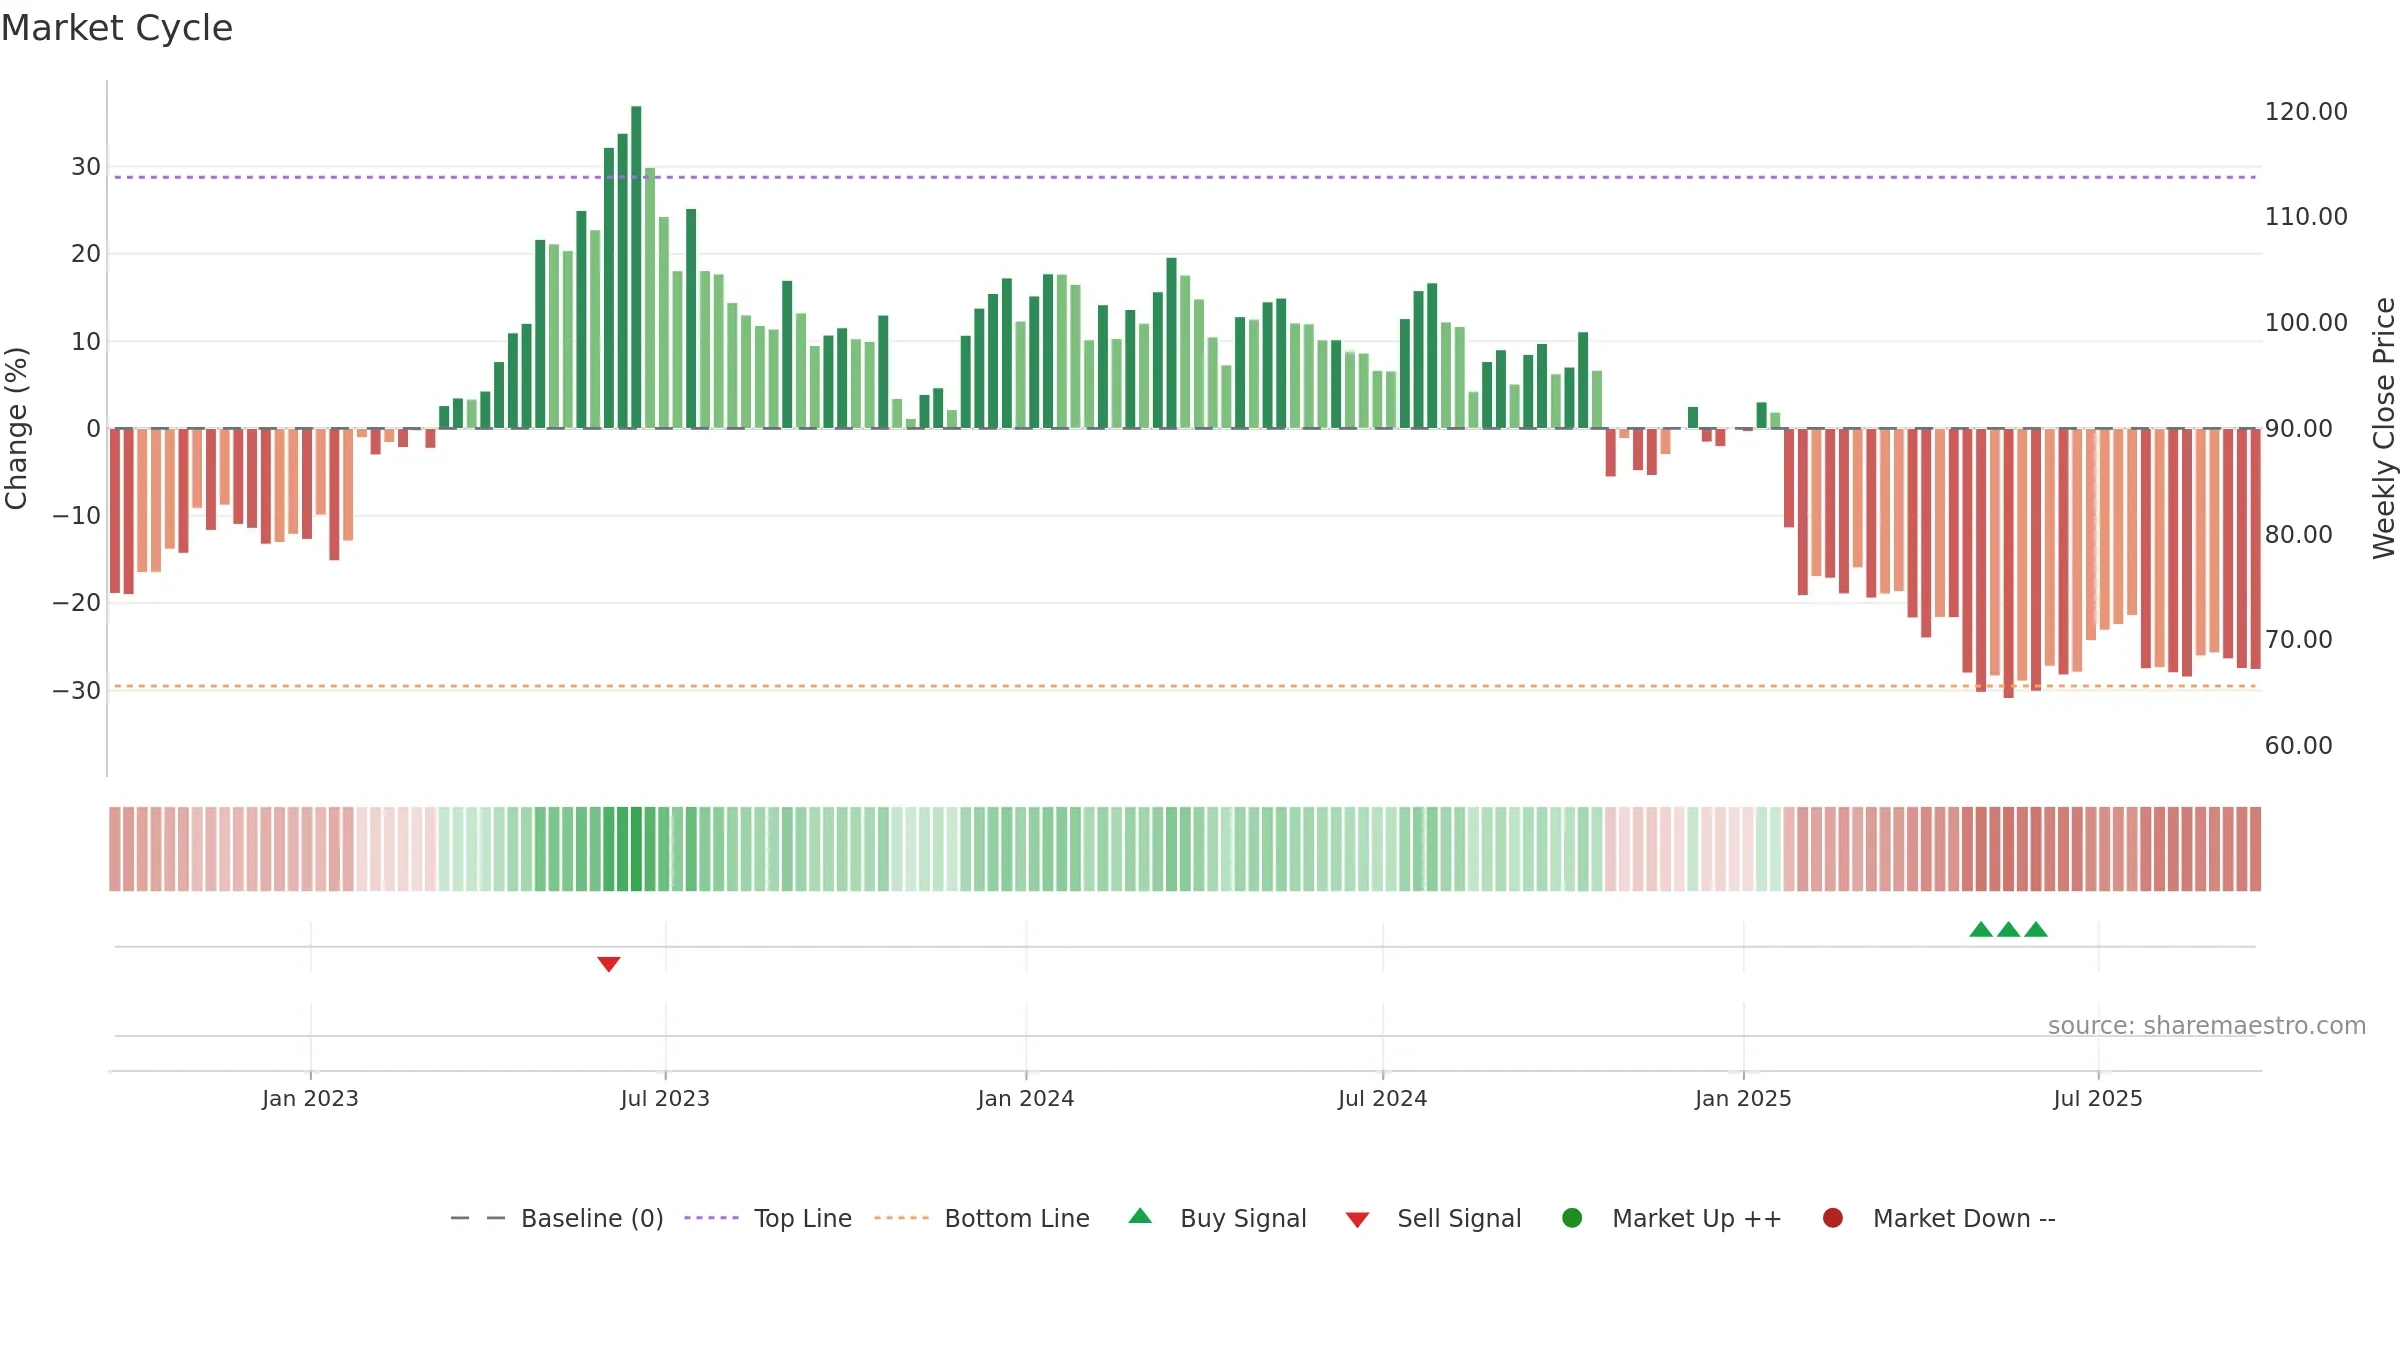
Neutral setup. ★★★☆☆ confidence. Price window: -0. Trend: Bottoming Attempt; gauge 14. In combination, liquidity diverges from price.
- Early improvement from bearish zone (bottoming attempt)
- Low return volatility supports durability
- Buyers step in at depressed levels (accumulation)
- Price is not above key averages
- Liquidity diverges from price
- Negative multi-week performance
Why: Price window -0.28% over 8w. Close is -2.56% below the prior-window high. Return volatility 0.96%. Volume trend falling. Liquidity divergence with price. Trend state bottoming attempt. Low-regime (≤0.25) upticks 5/7 (71.0%) • Accumulating. Momentum neutral and rising. Valuation limited upside without catalysts.
Tip: Most metrics include a hover tooltip where they appear in the report.