The Middleby Corporation
MIDD NASDAQ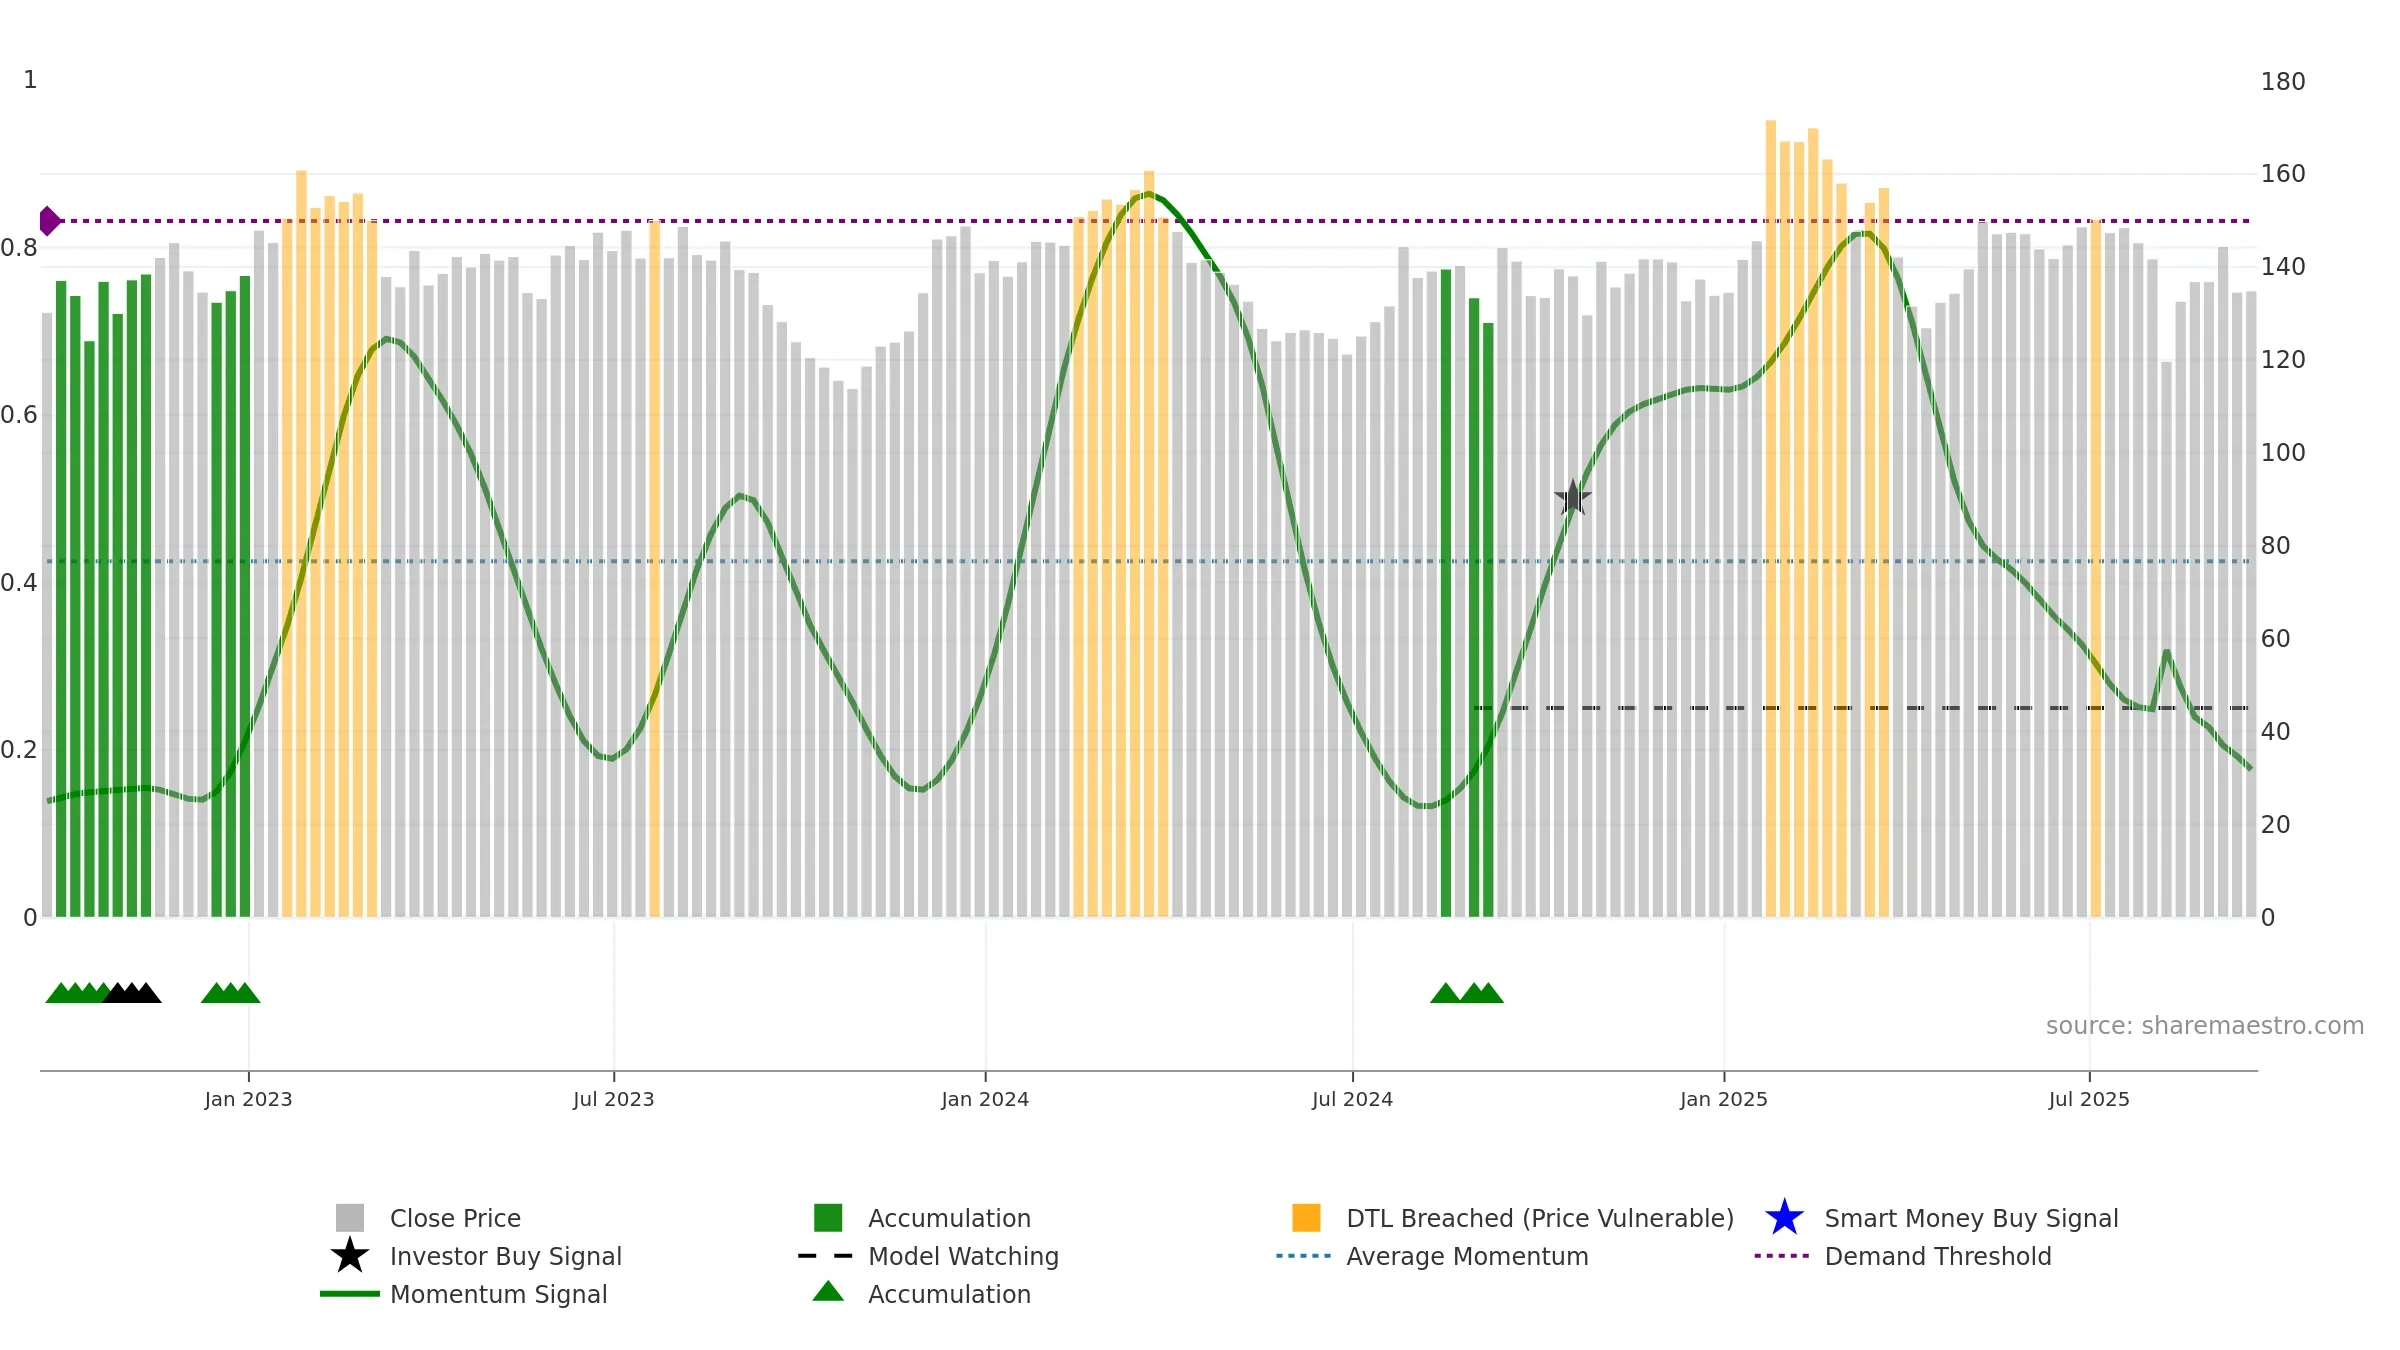
Weekly Report
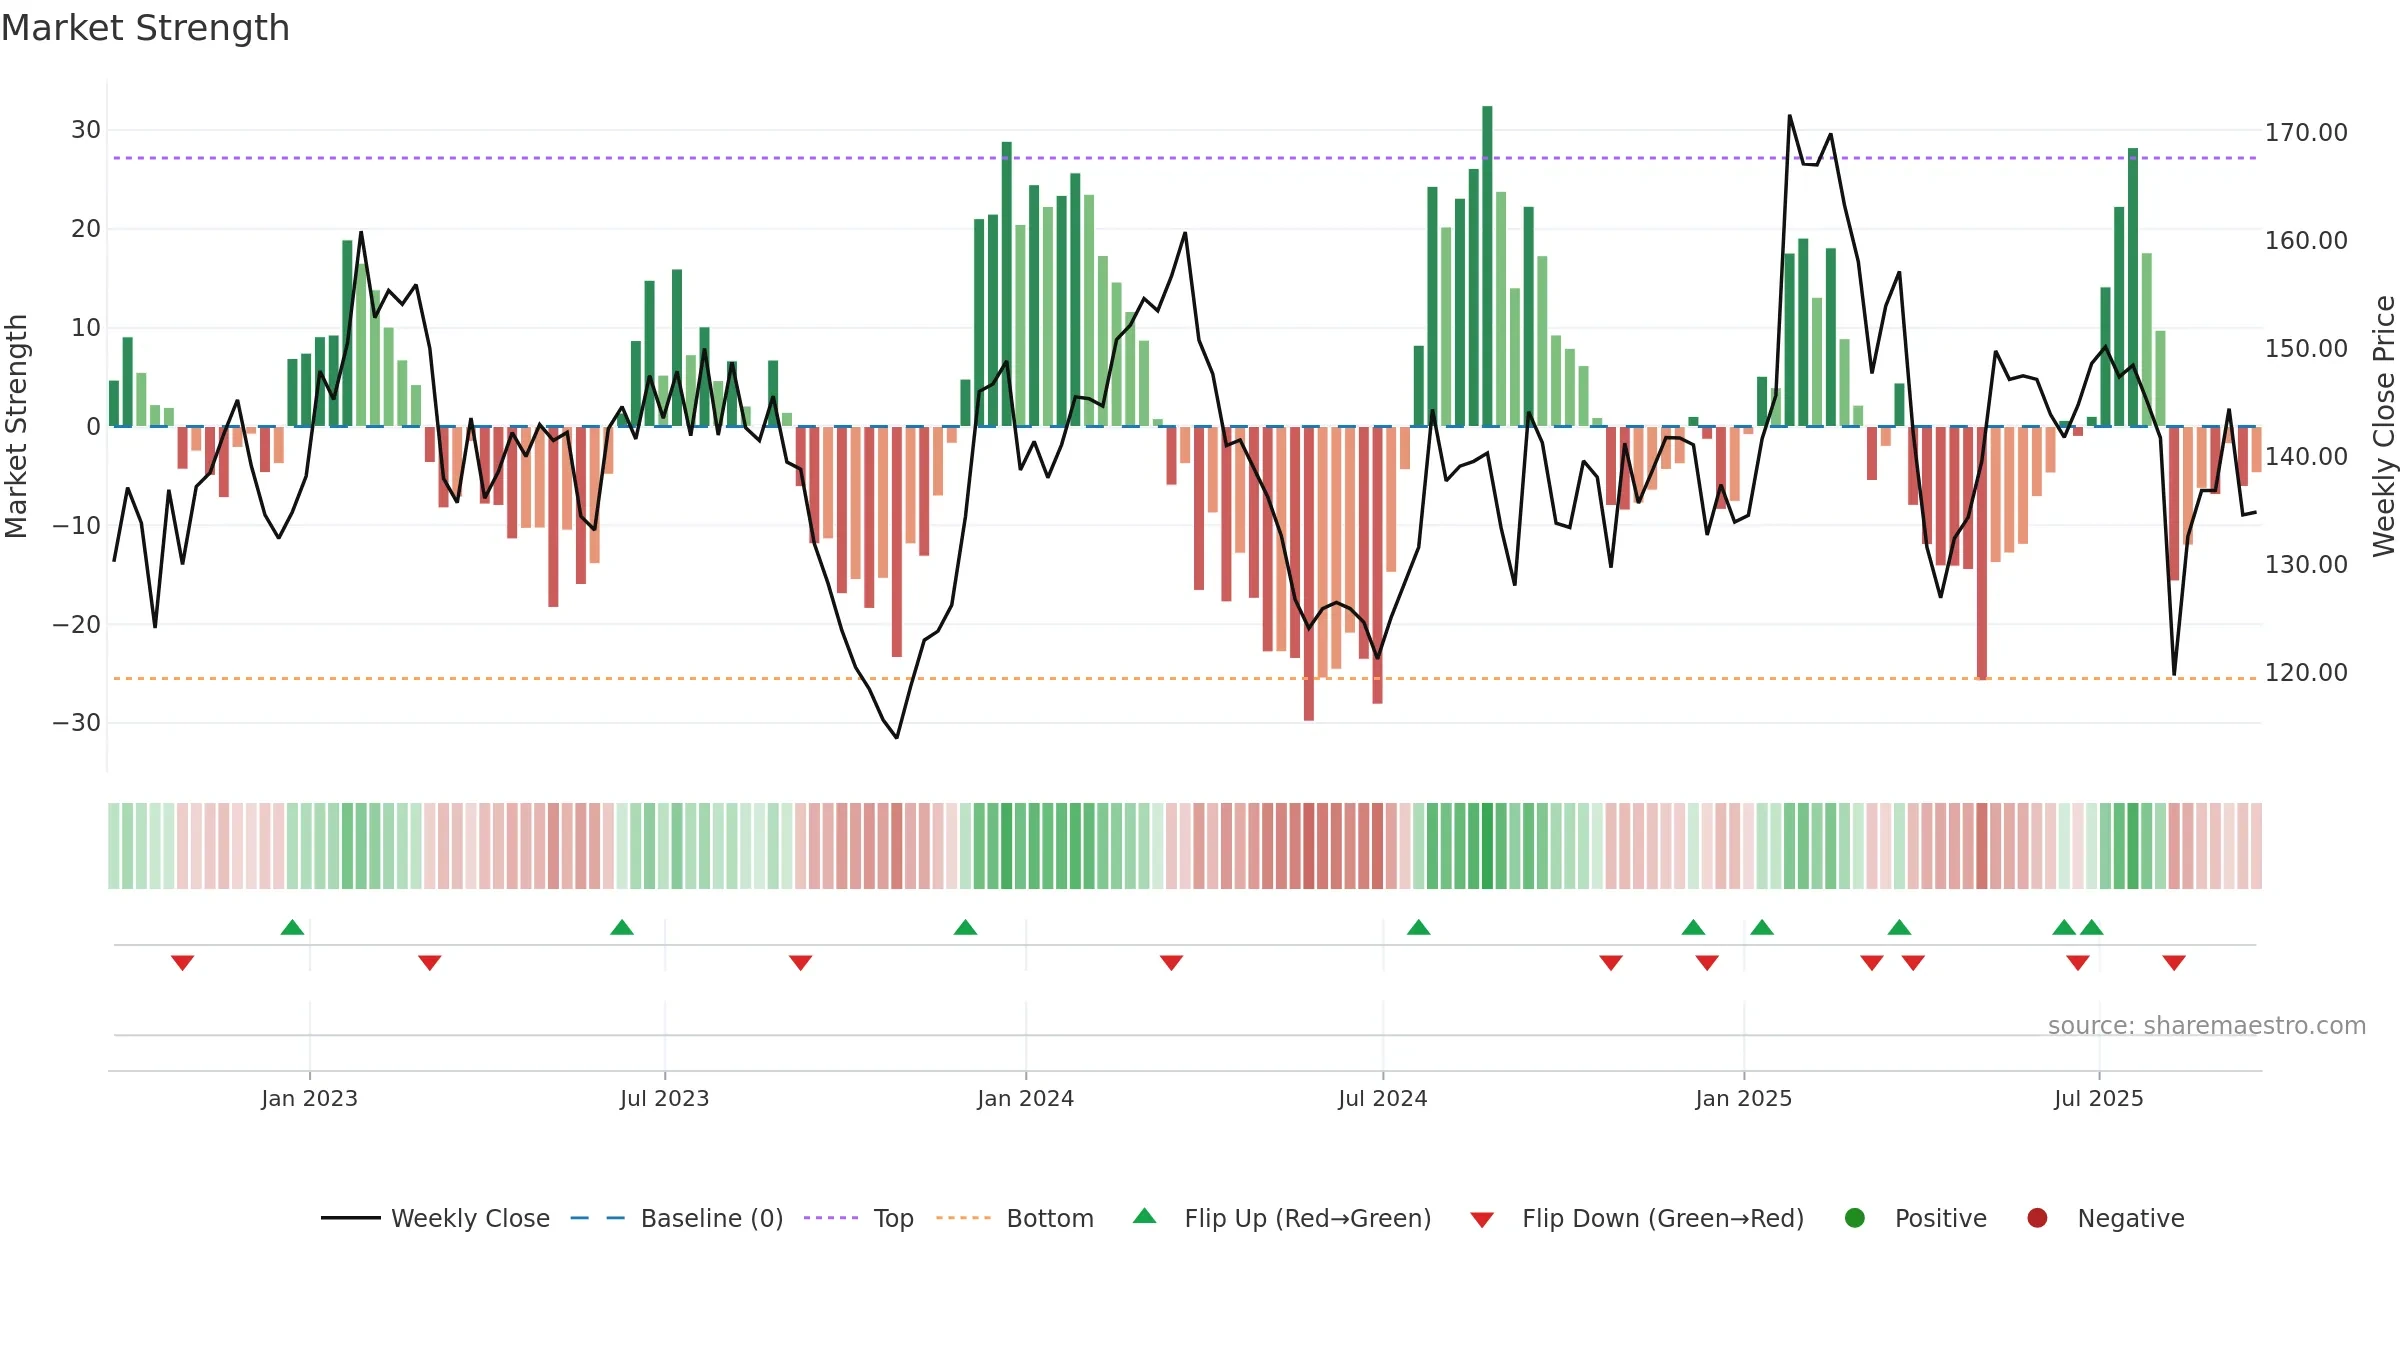
The Middleby Corporation closed at 134.8500 (-0.30% WoW) . Data window ends Fri, 19 Sep 2025.
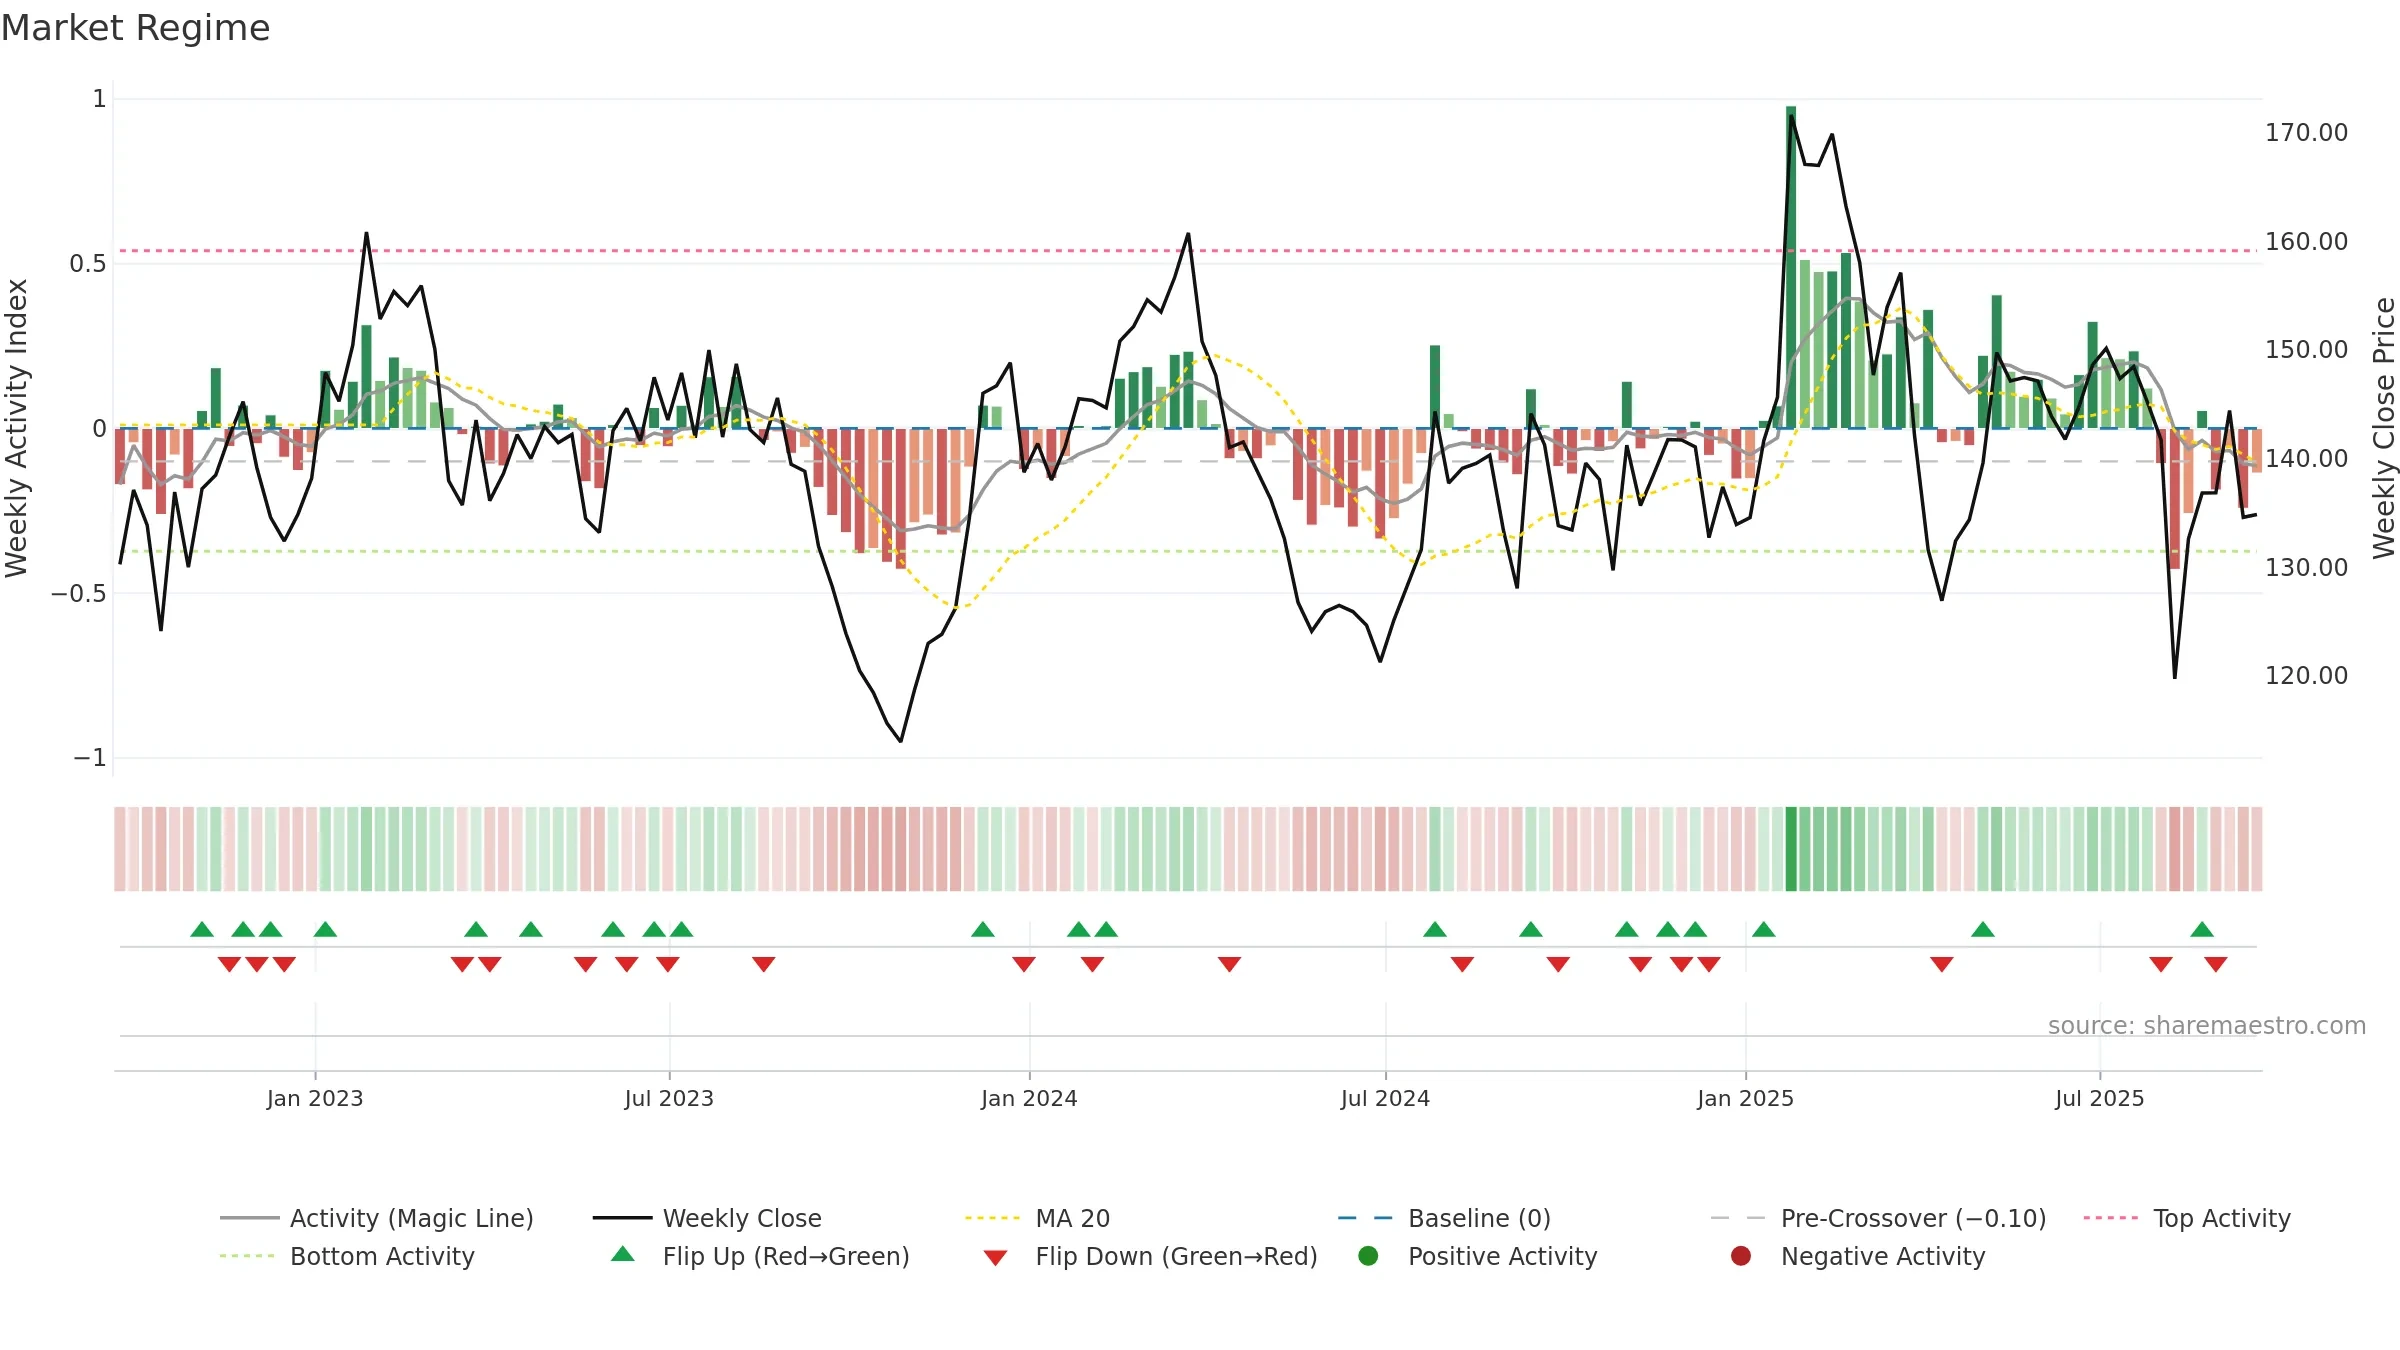
How to read this — Price slope is upward, indicating persistent buying over the window. Low weekly volatility favours steadier follow-through. Volume and price are moving in the same direction — a constructive confirmation. Returns are positively correlated with volume — strength tends to arrive on higher activity. Price sits below key averages, keeping pressure on the tape.
Up-slope supports buying interest; pullbacks may be contained if activity stays firm.
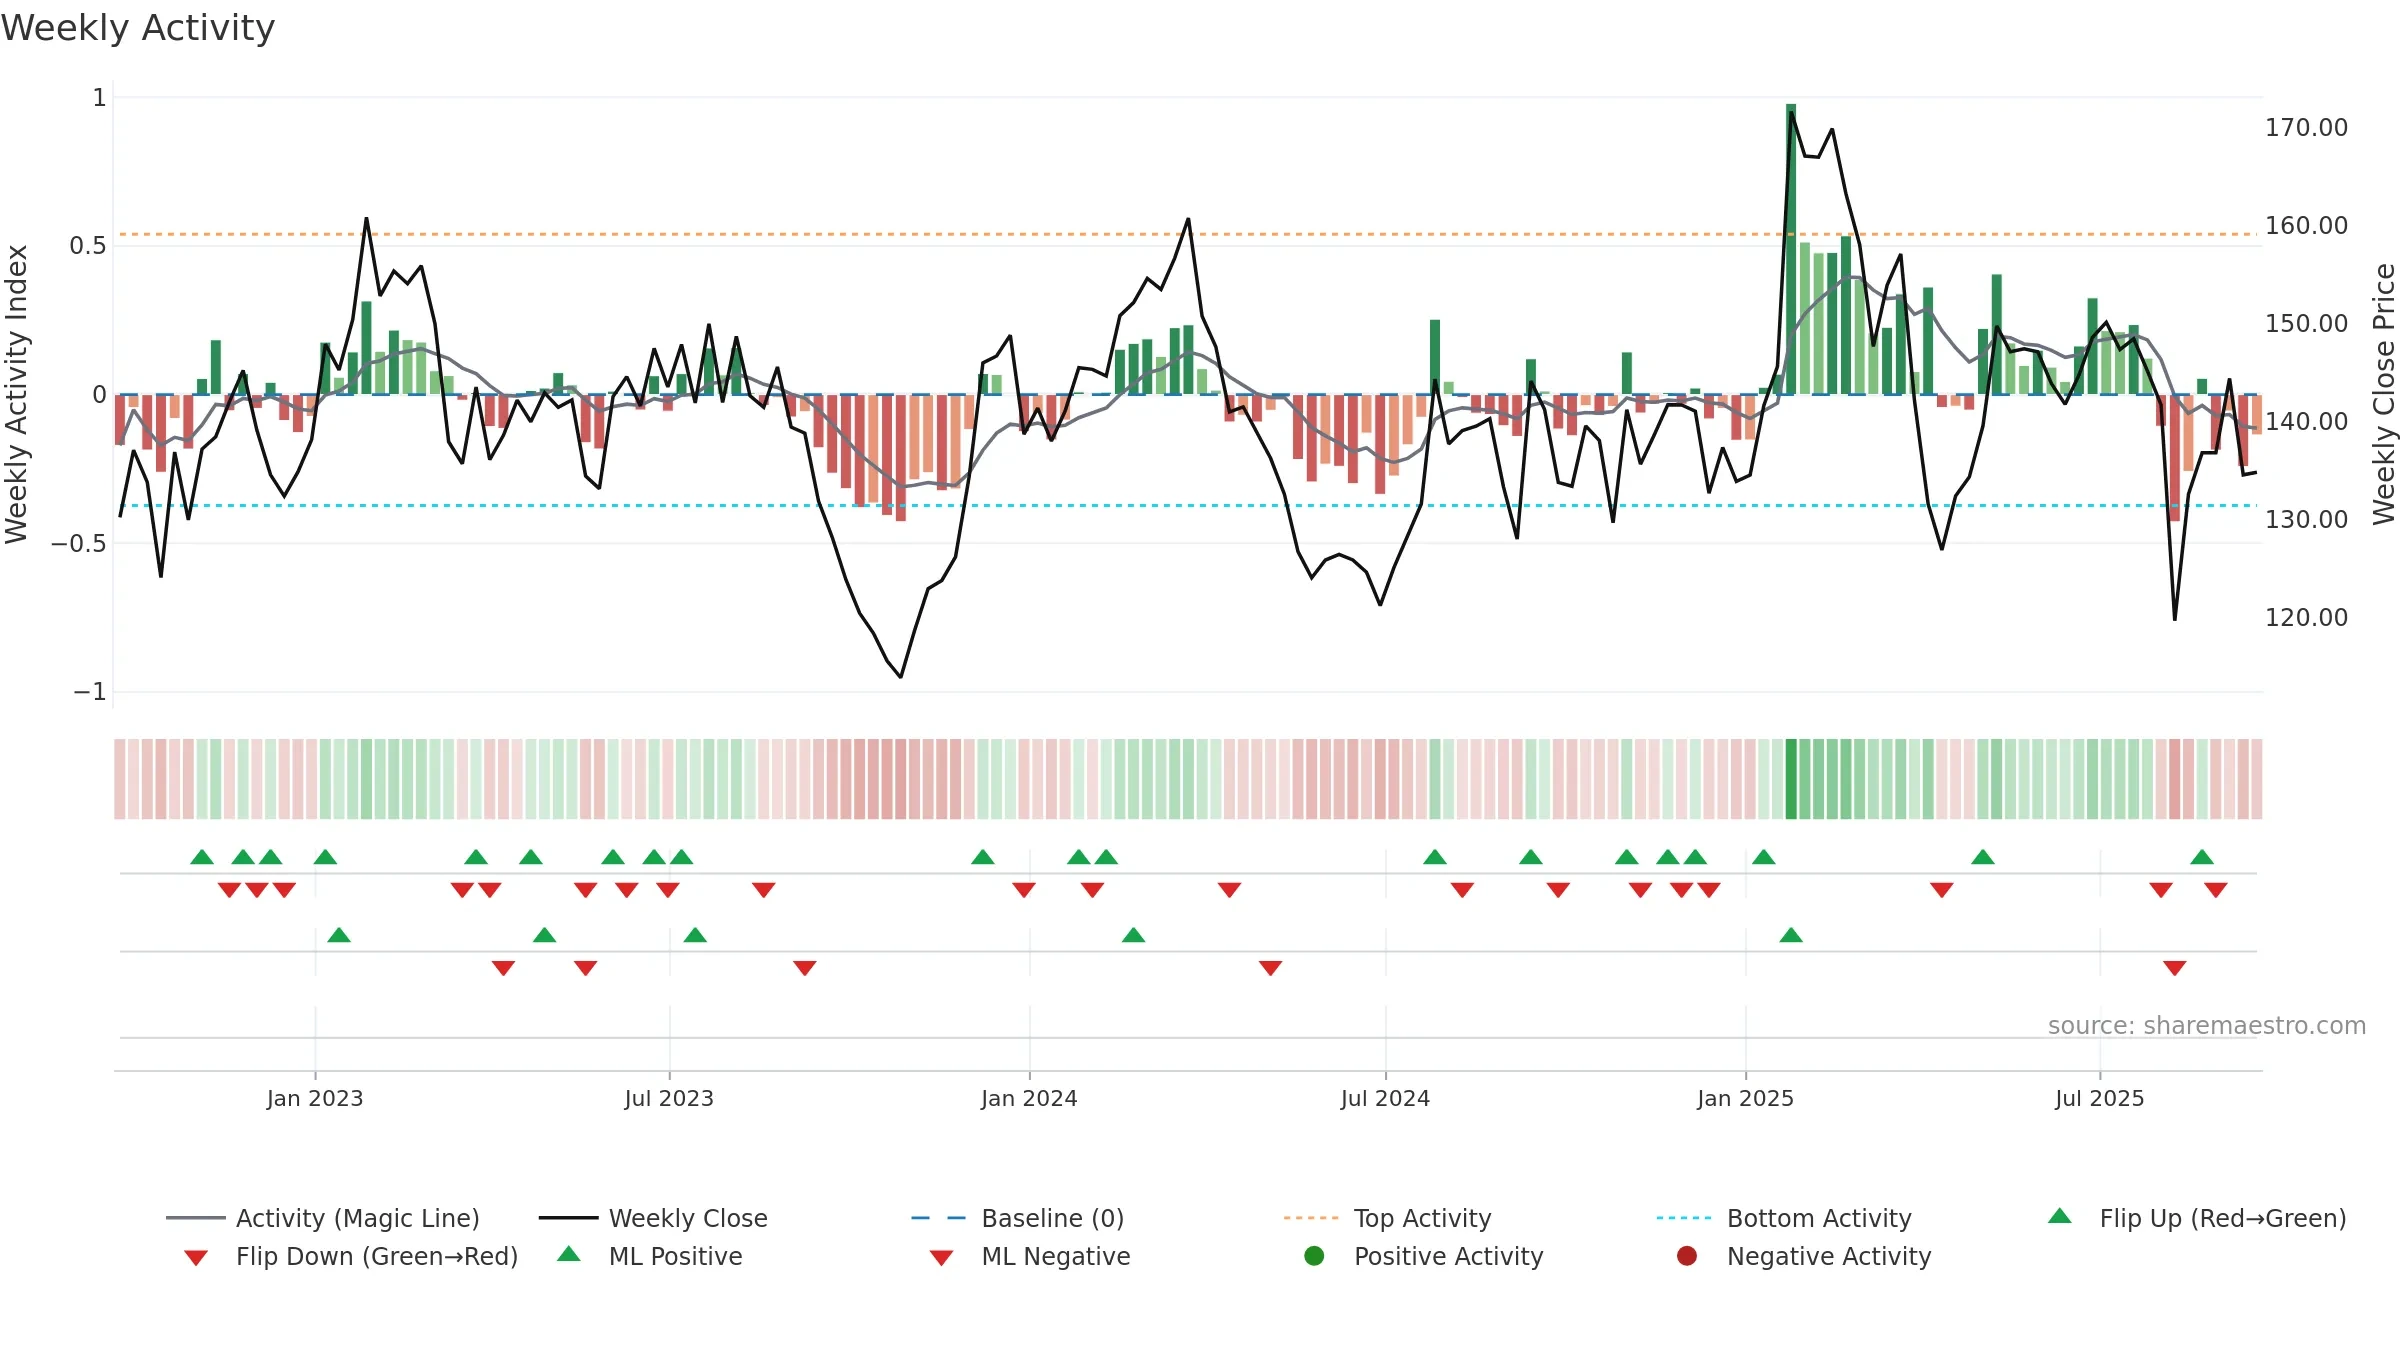
Gauge maps the trend signal to a 0–100 scale.
How to read this — Bearish zone with falling momentum — sellers in control.
Bias remains lower; rallies are suspect unless gauge reclaims 0.50/0.60.
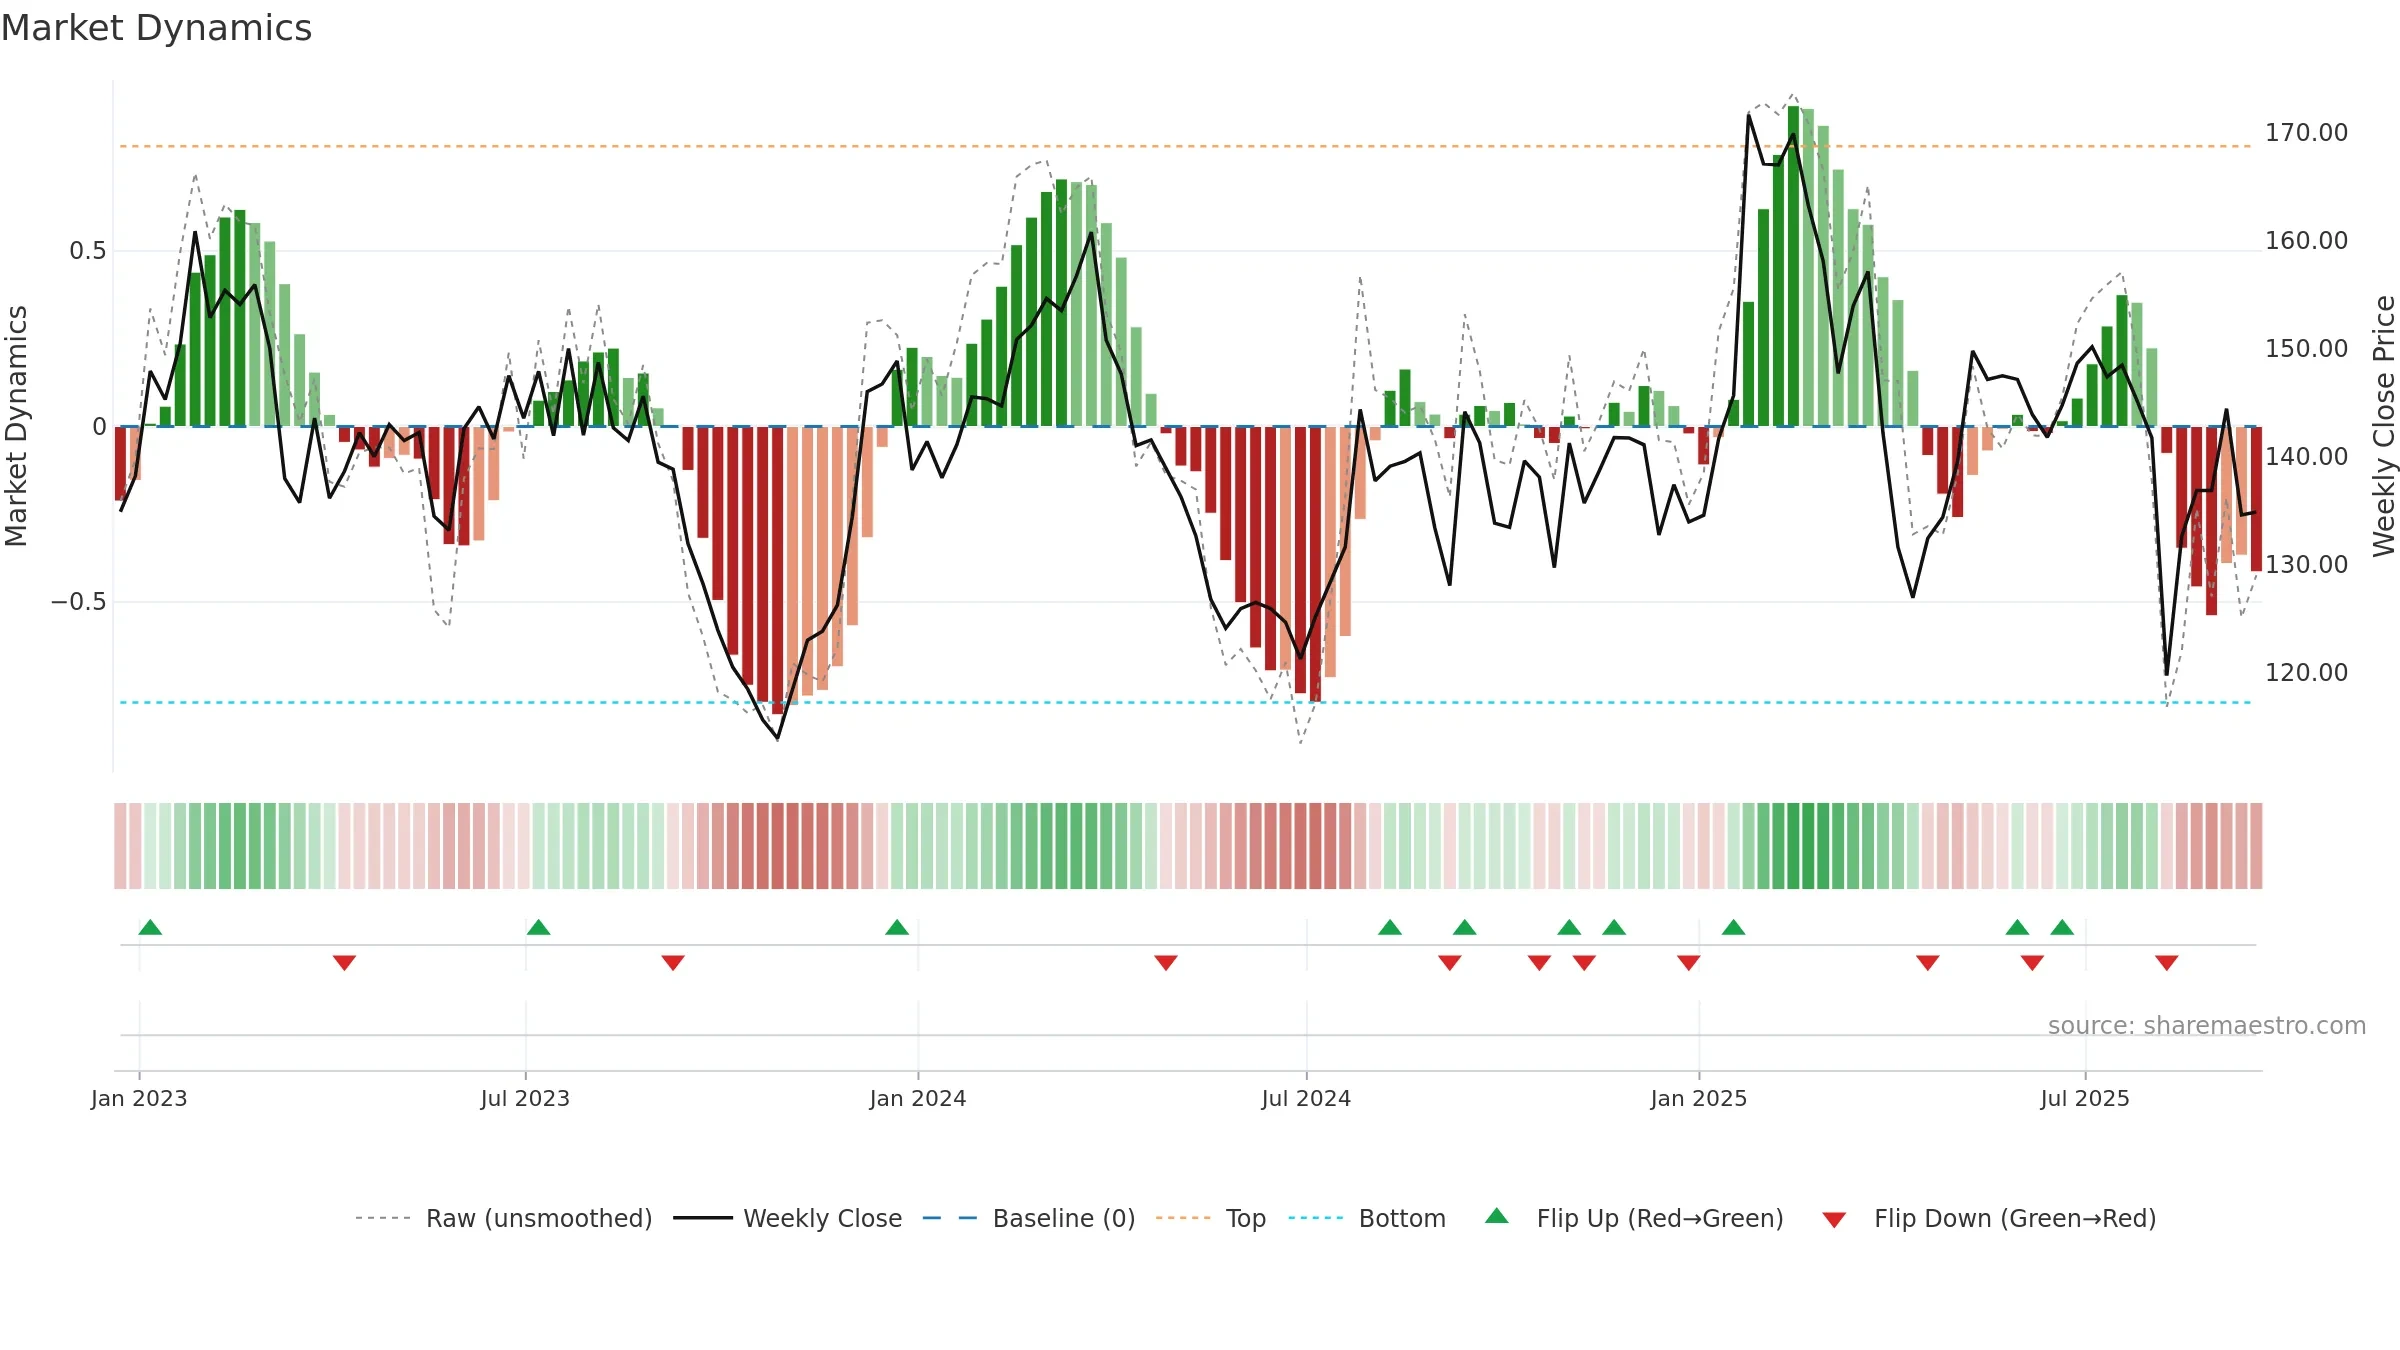
Price is below fair value; potential upside if momentum constructive.
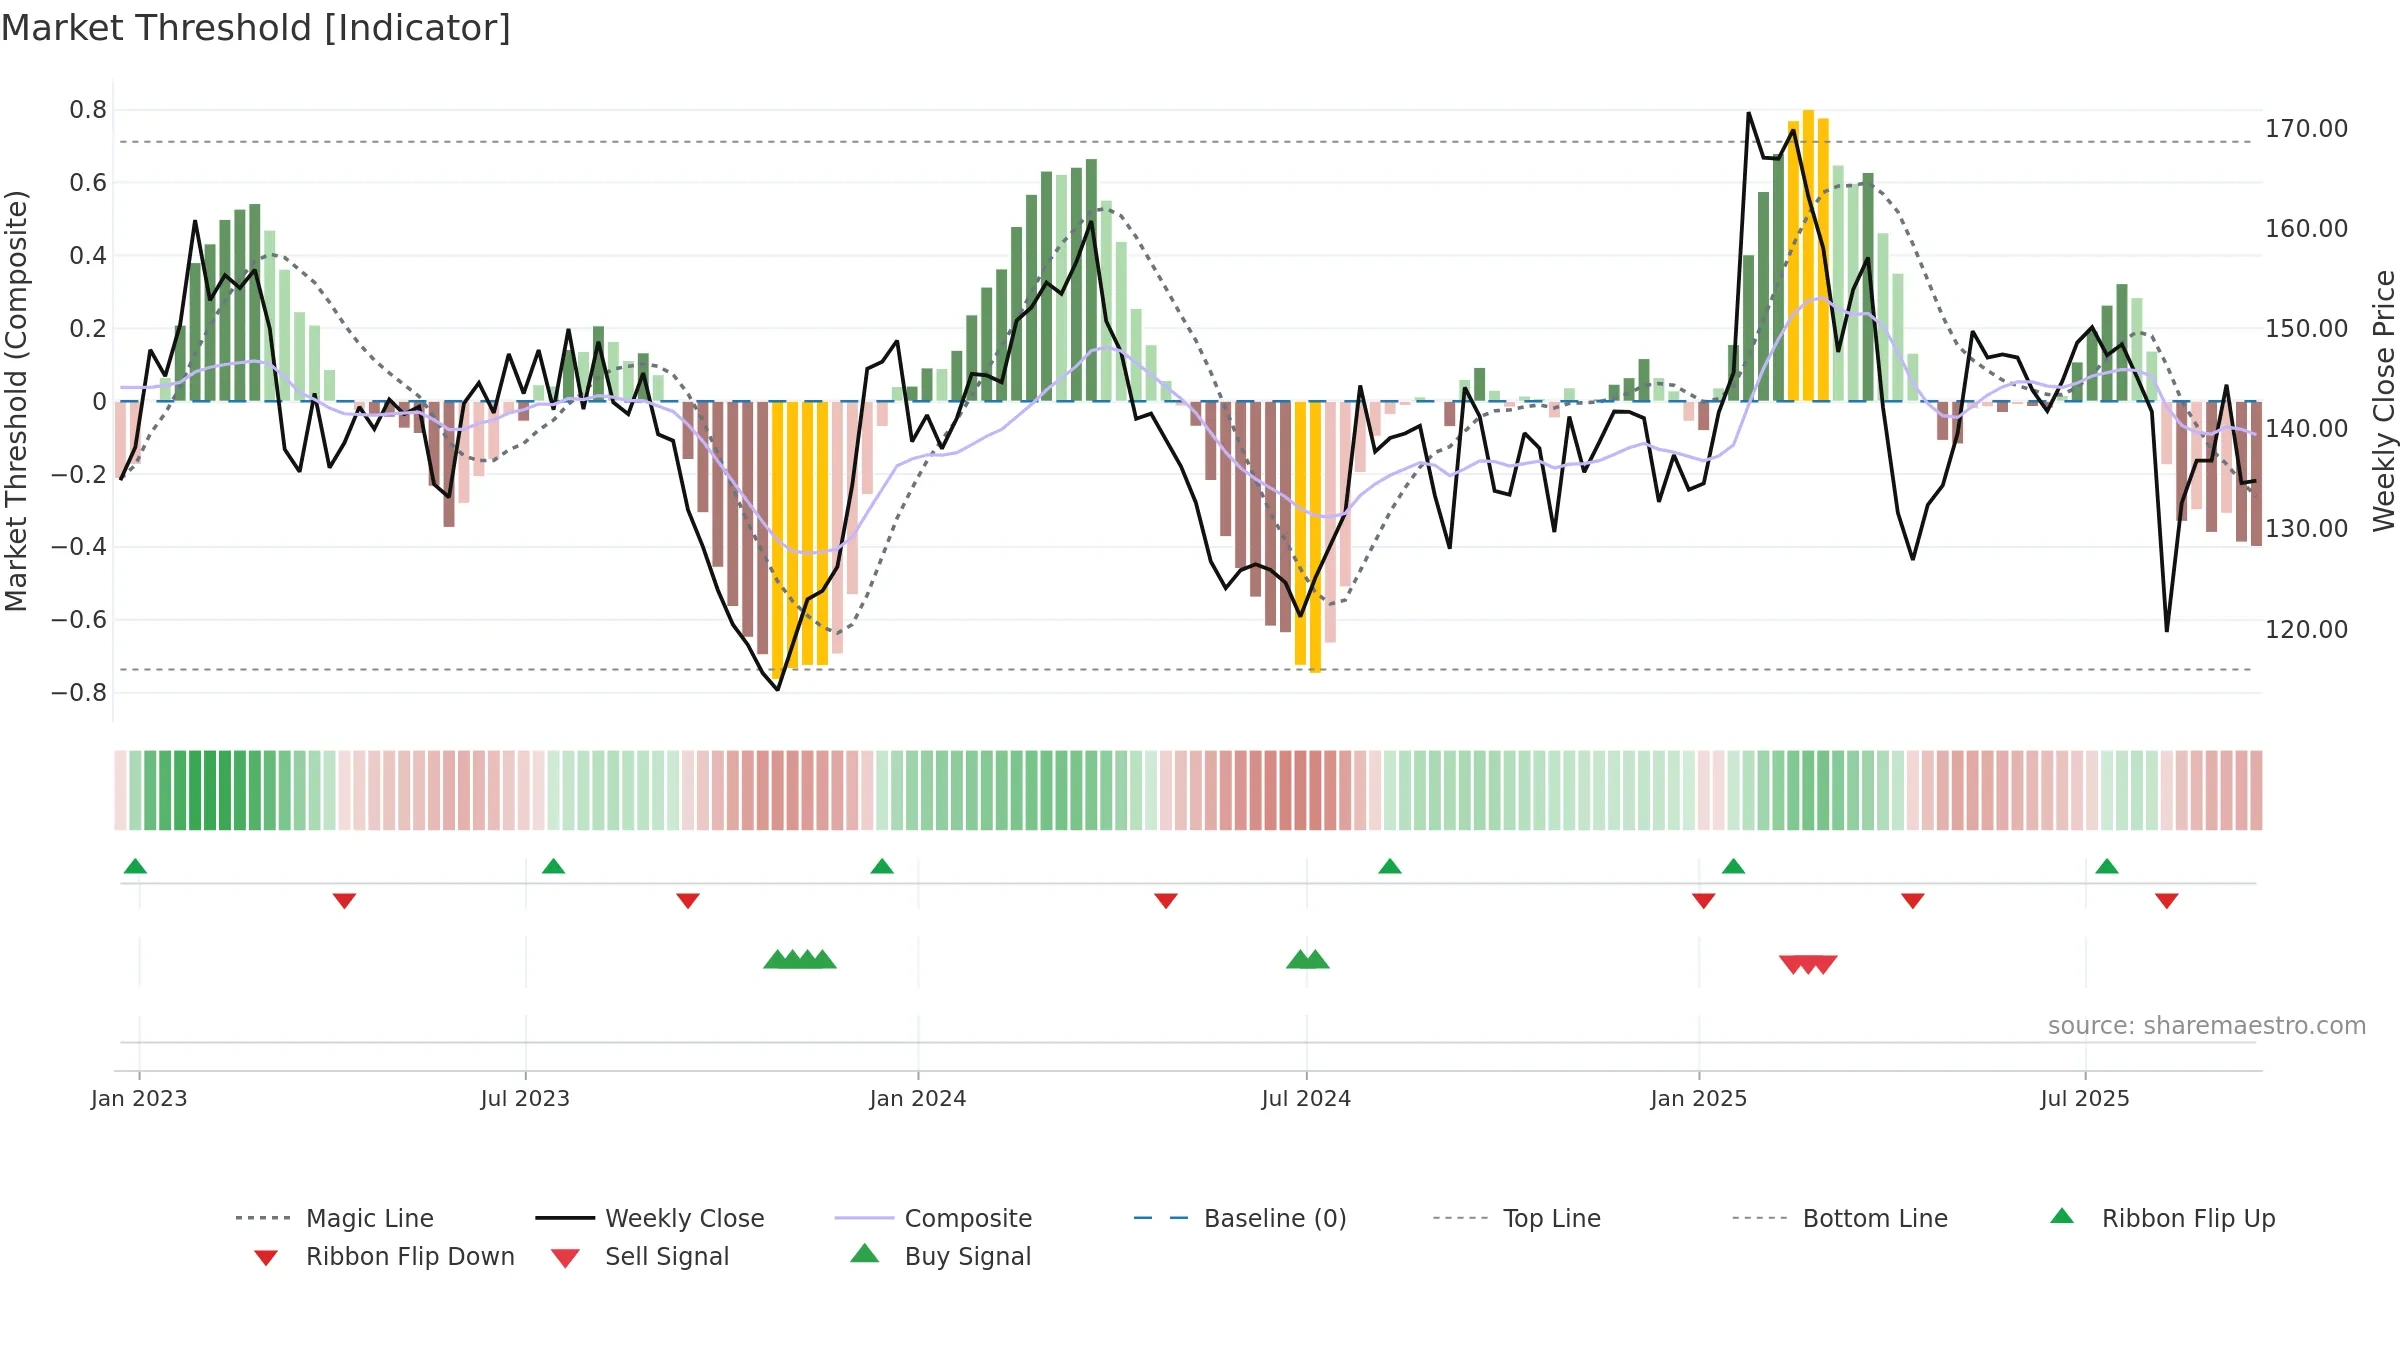
Conclusion
Negative setup. ★☆☆☆☆ confidence. Price window: -4. Trend: Downtrend Confirmed; gauge 17. In combination, liquidity confirms the move.
- Liquidity confirms the price trend
- Low return volatility supports durability
- Bearish control with falling momentum
- Momentum is weak/falling
- Price is not above key averages
- Negative multi-week performance
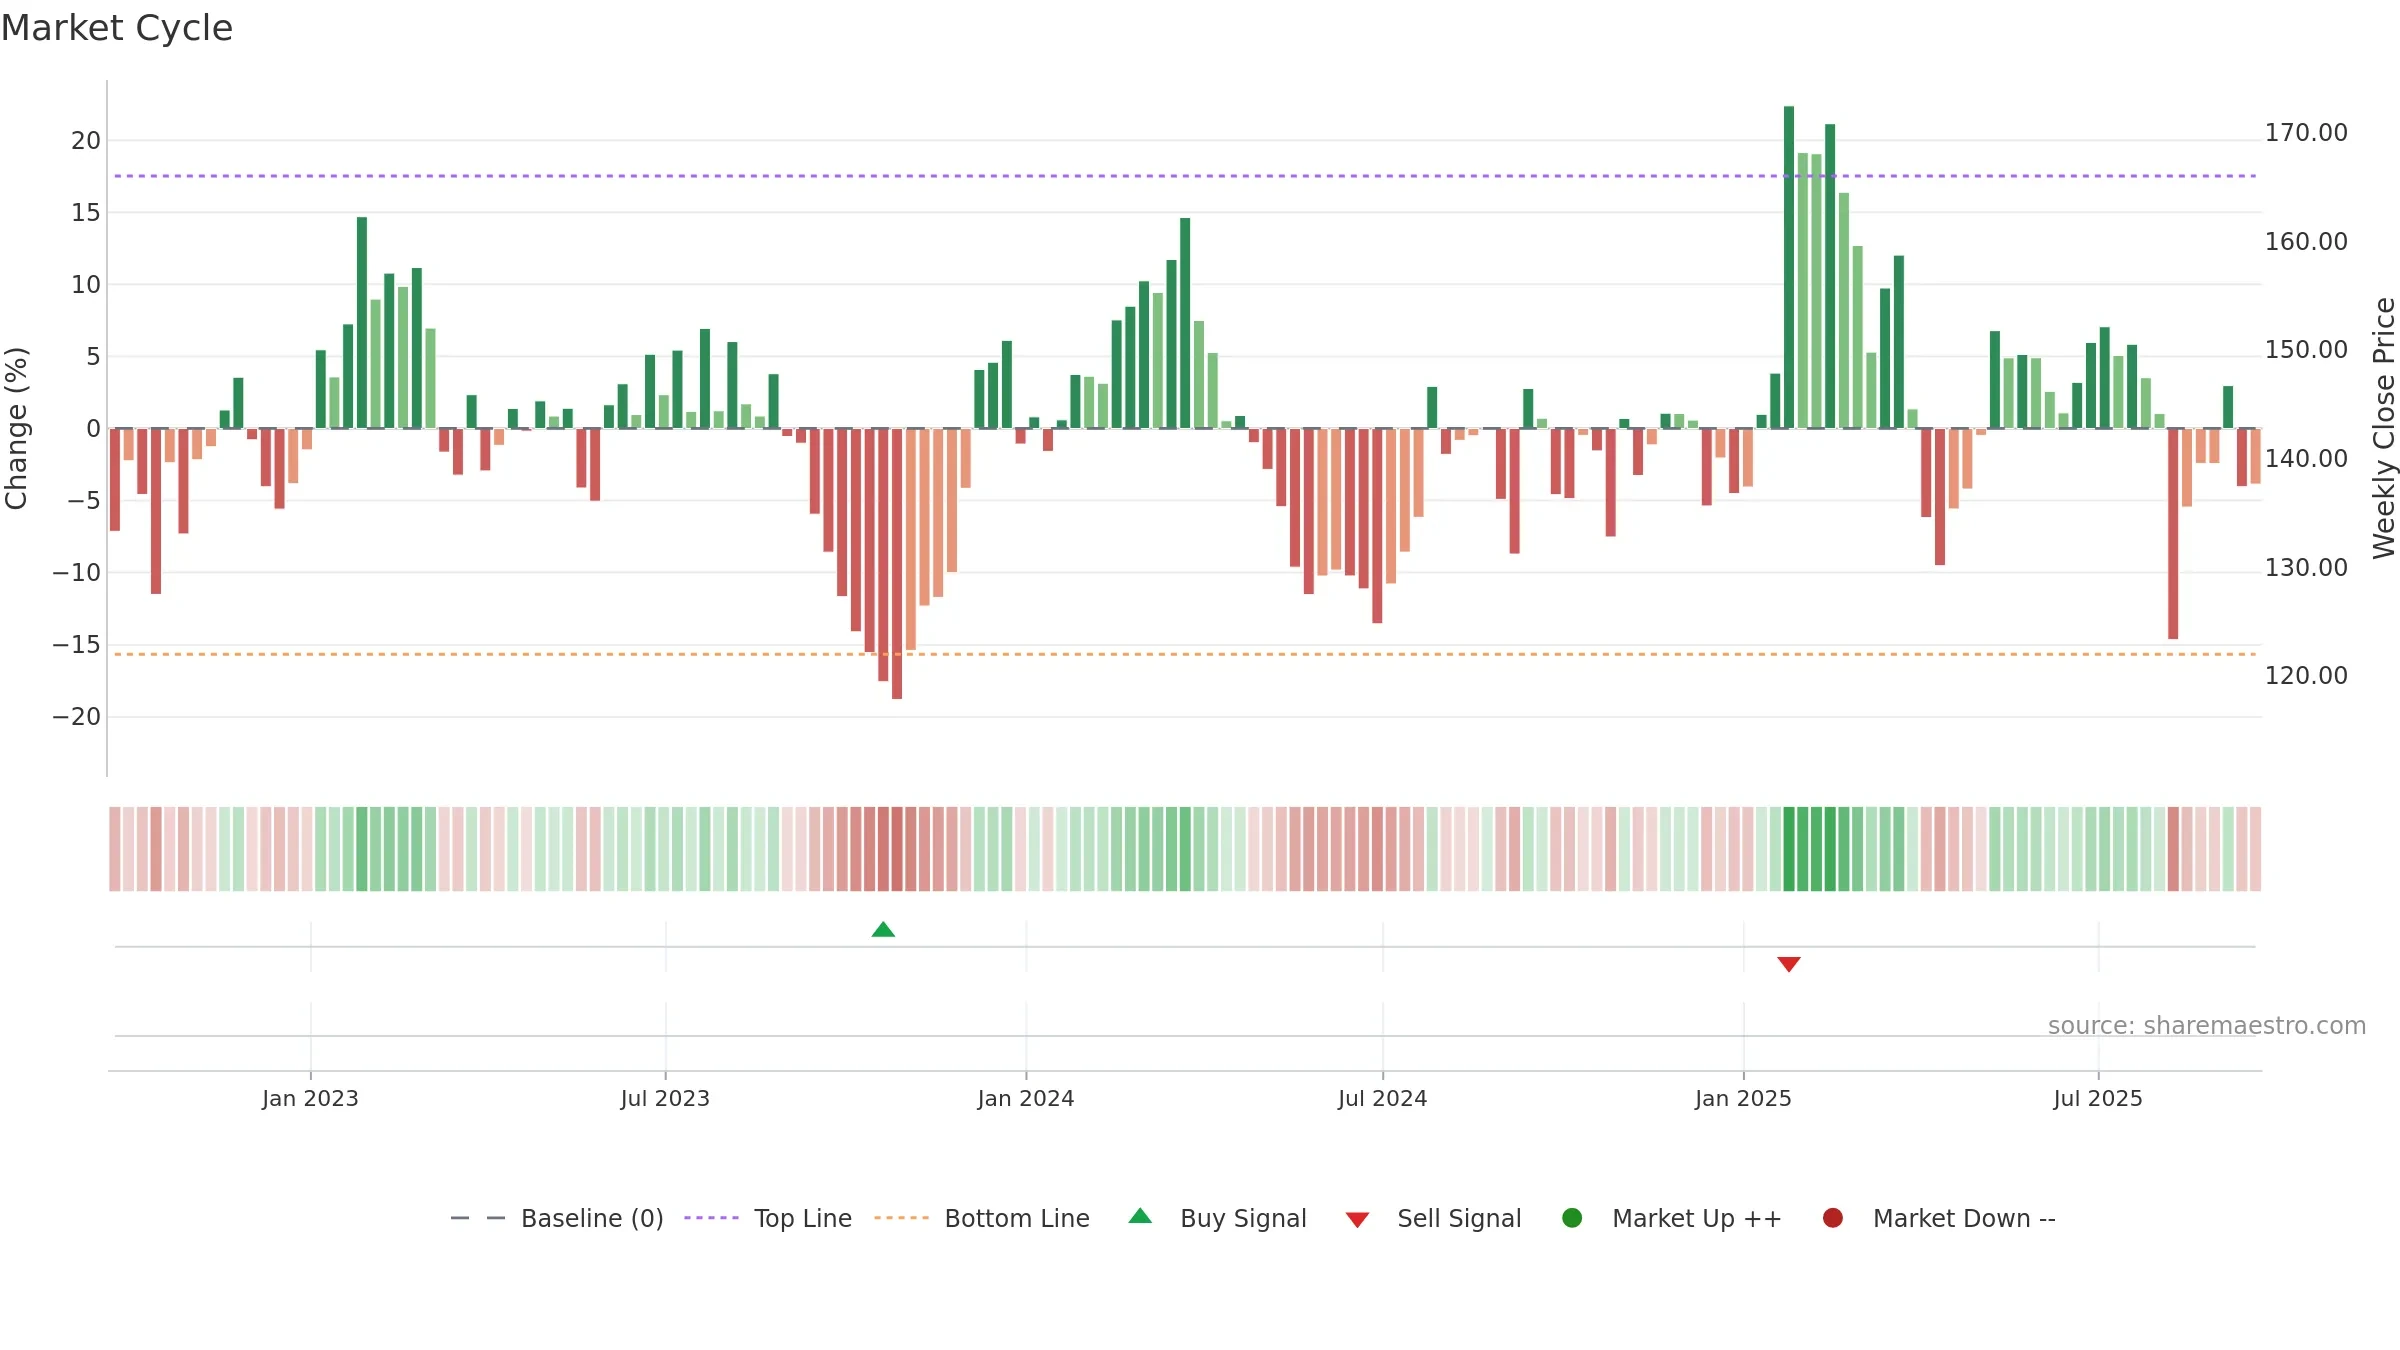
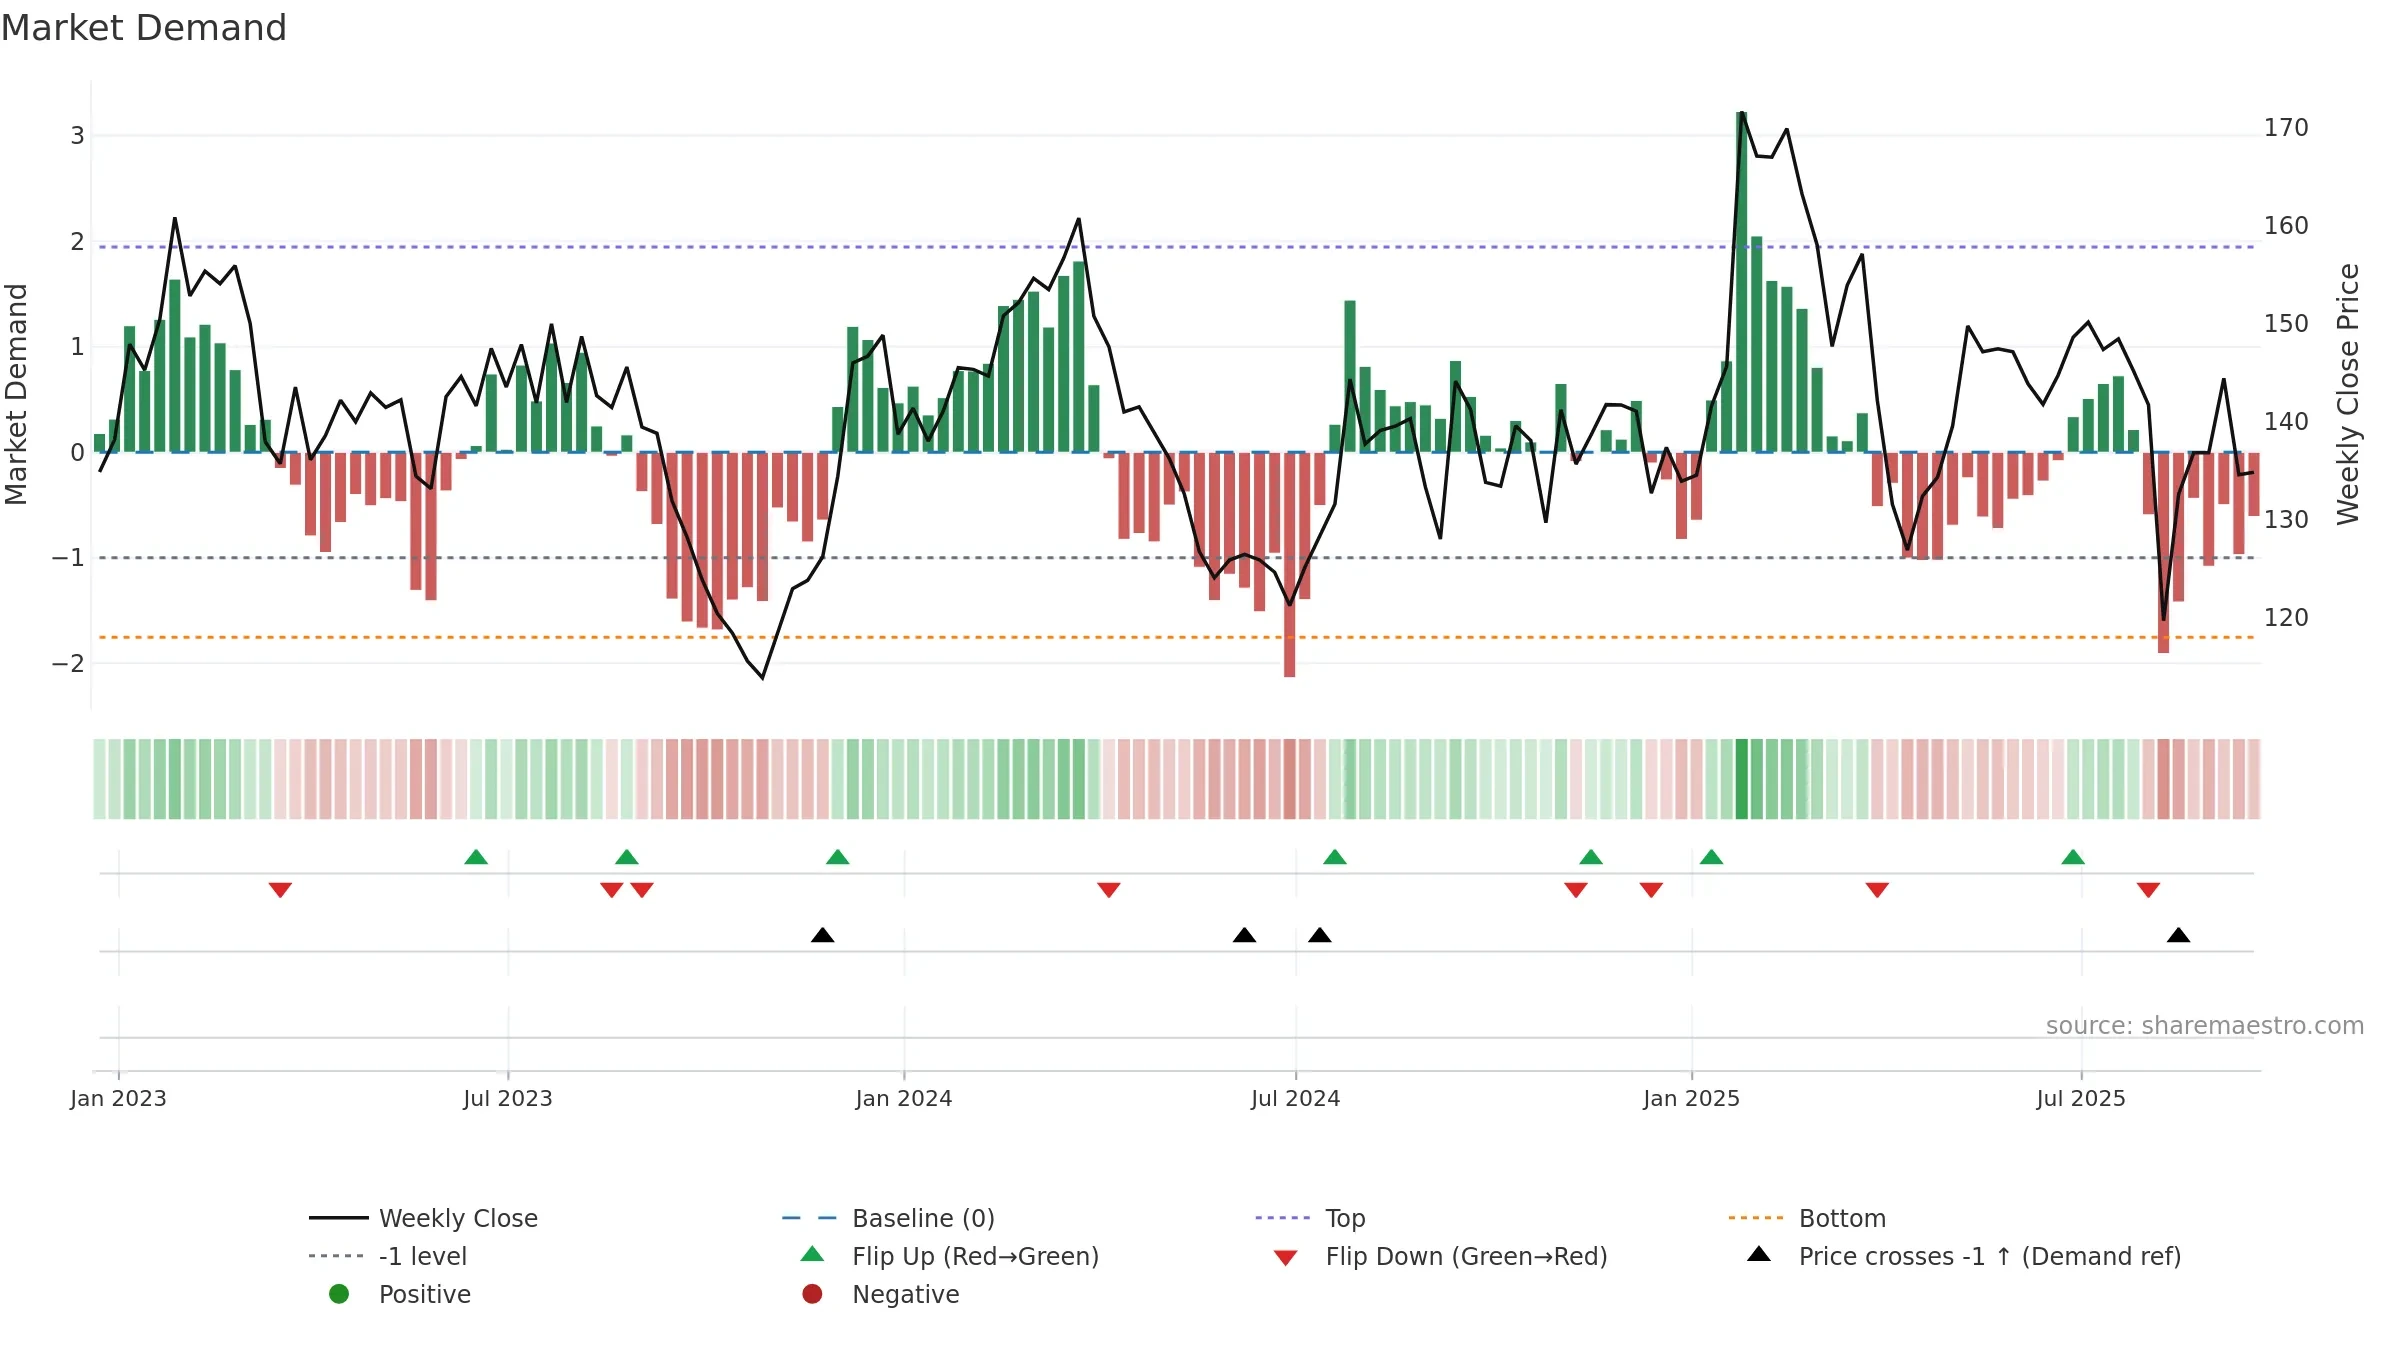
Why: Price window -4.85% over 8w. Close is -6.63% below the prior-window high. Return volatility 1.92%. Volume trend rising. Liquidity convergence with price. Trend state downtrend confirmed. Low-regime (≤0.25) upticks 1/5 (20.0%) • Distributing. Momentum bearish and falling. Valuation supportive skew.
Tip: Most metrics include a hover tooltip where they appear in the report.