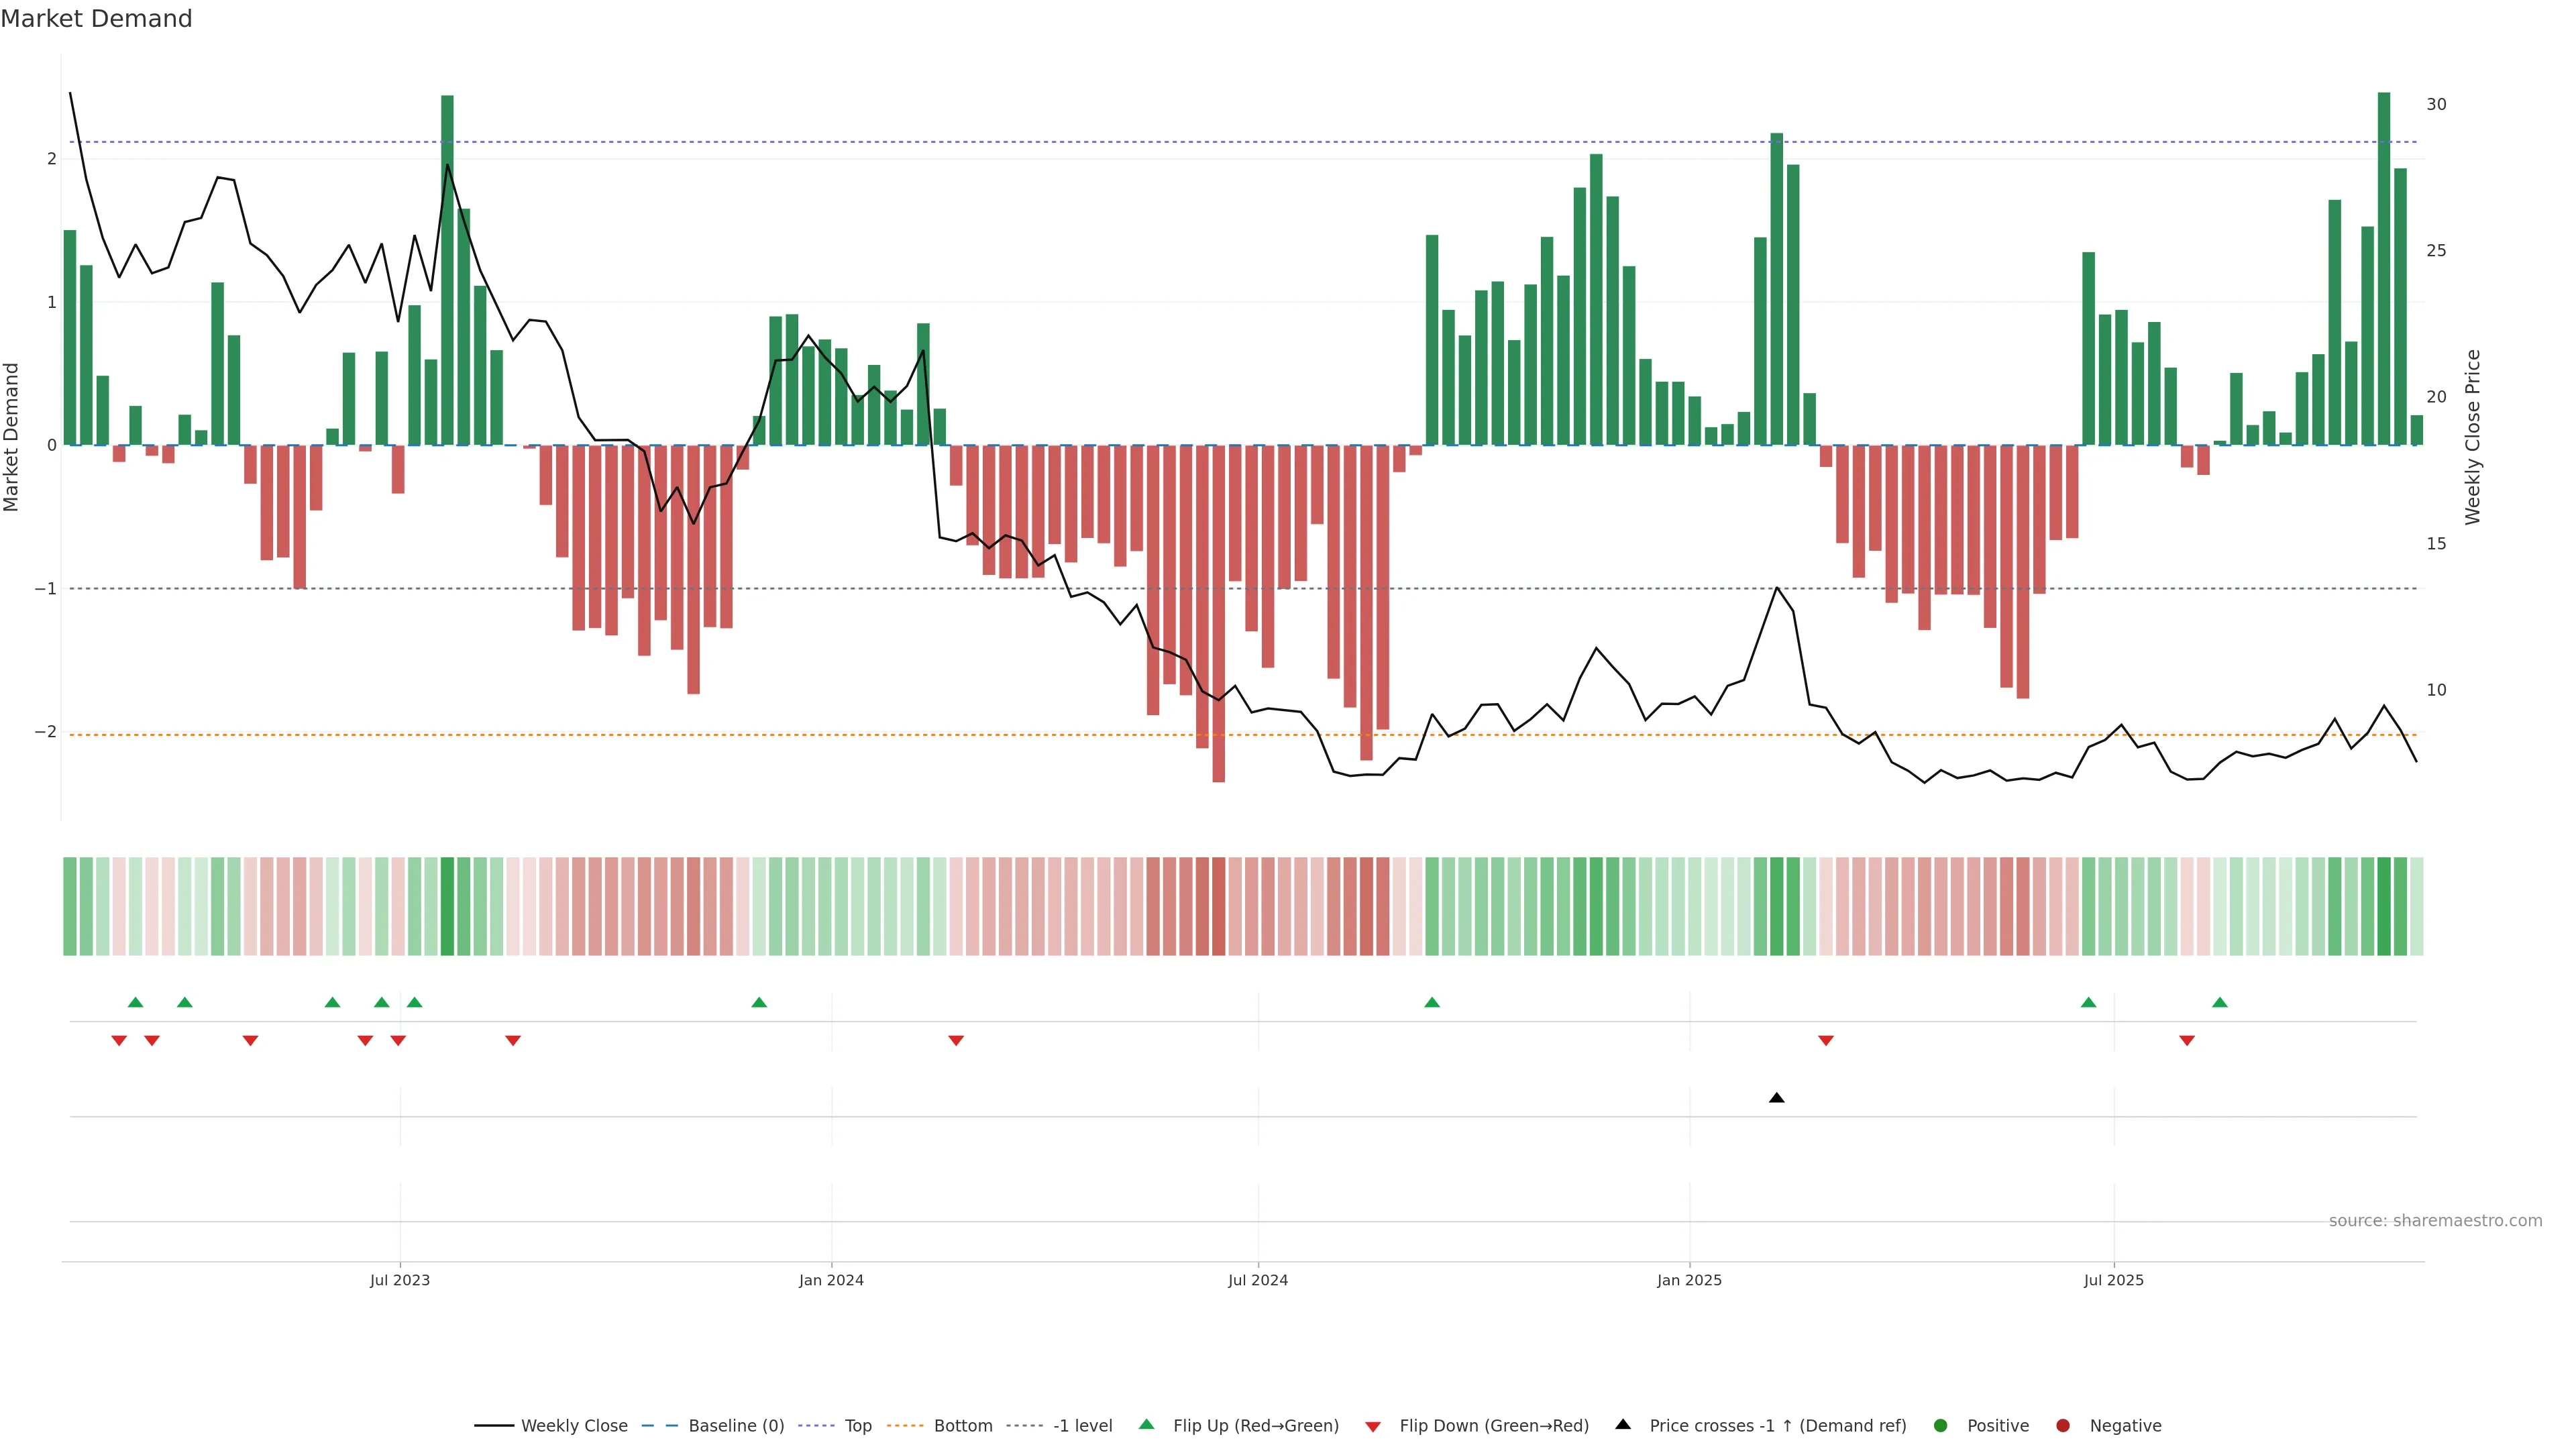
Market Dynamics
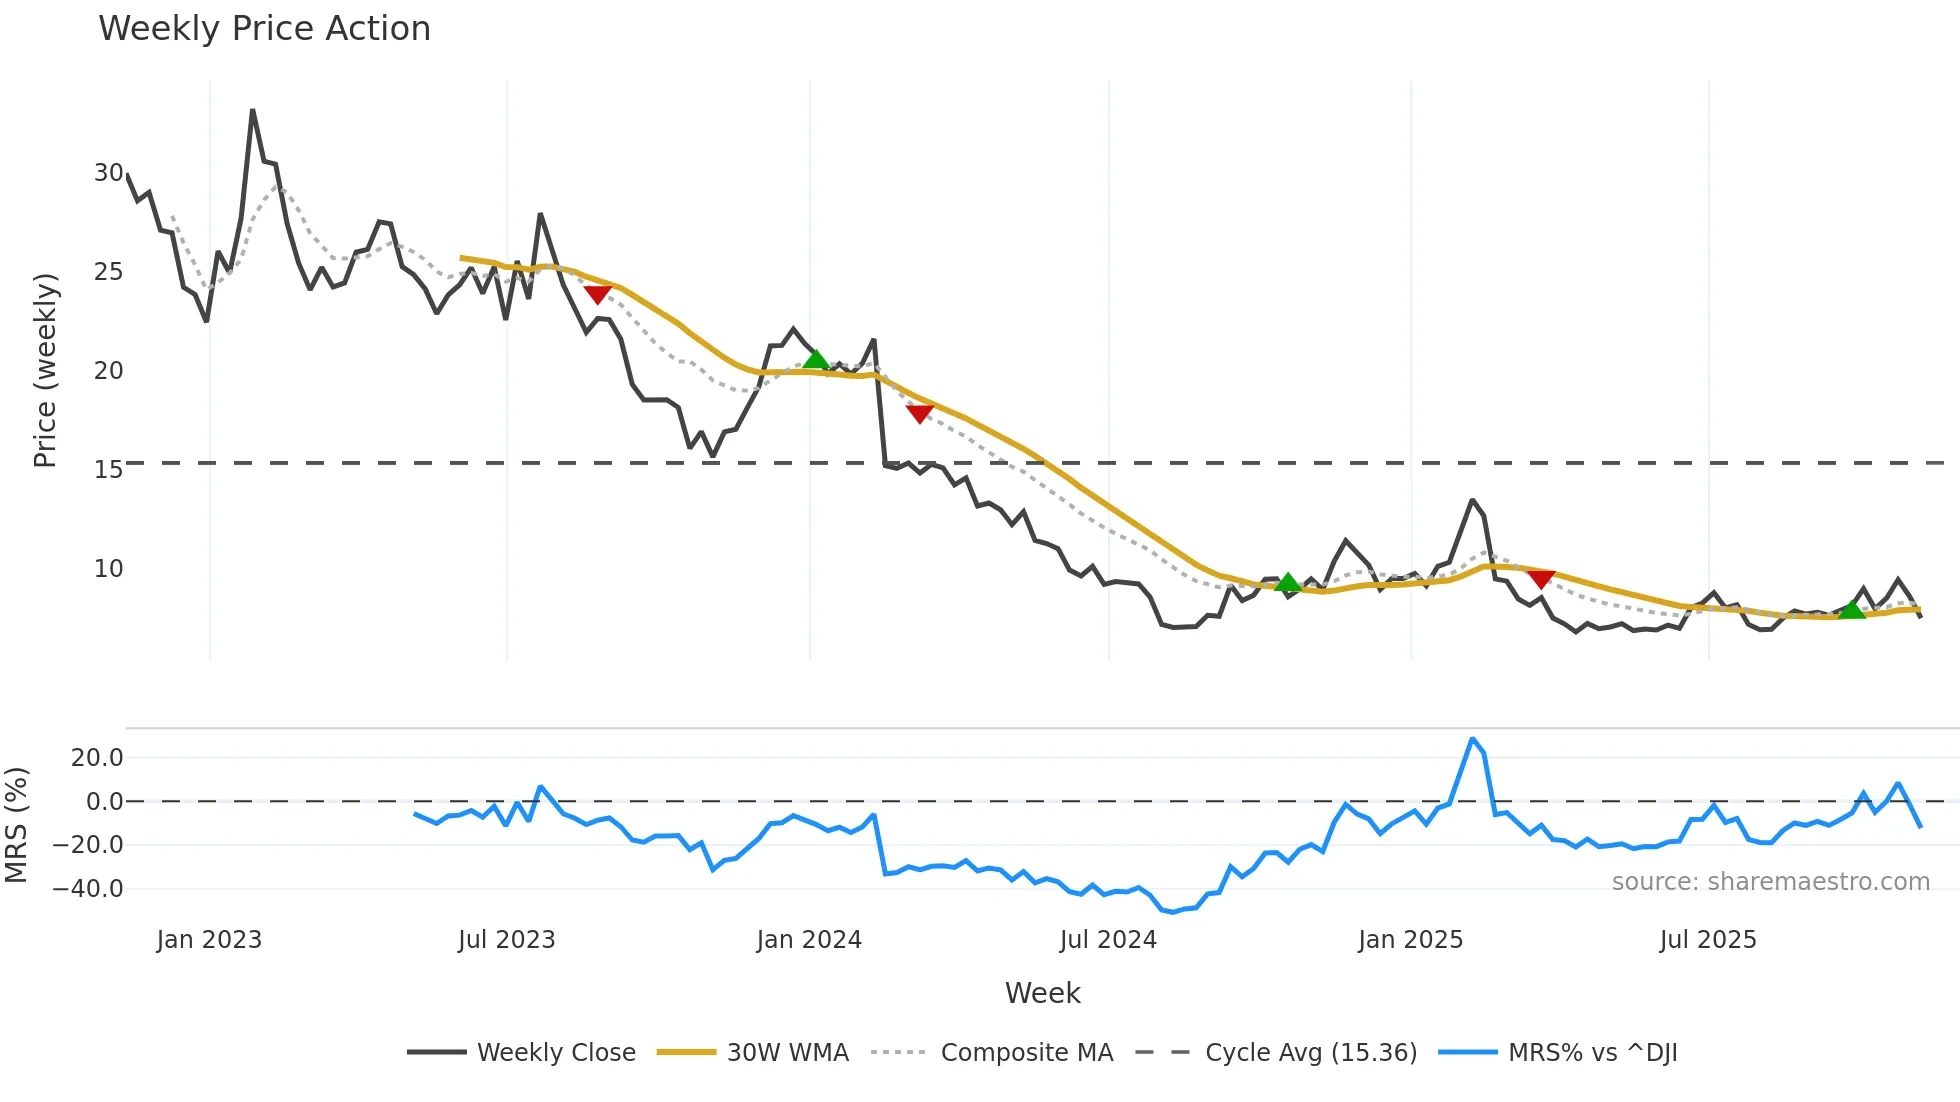
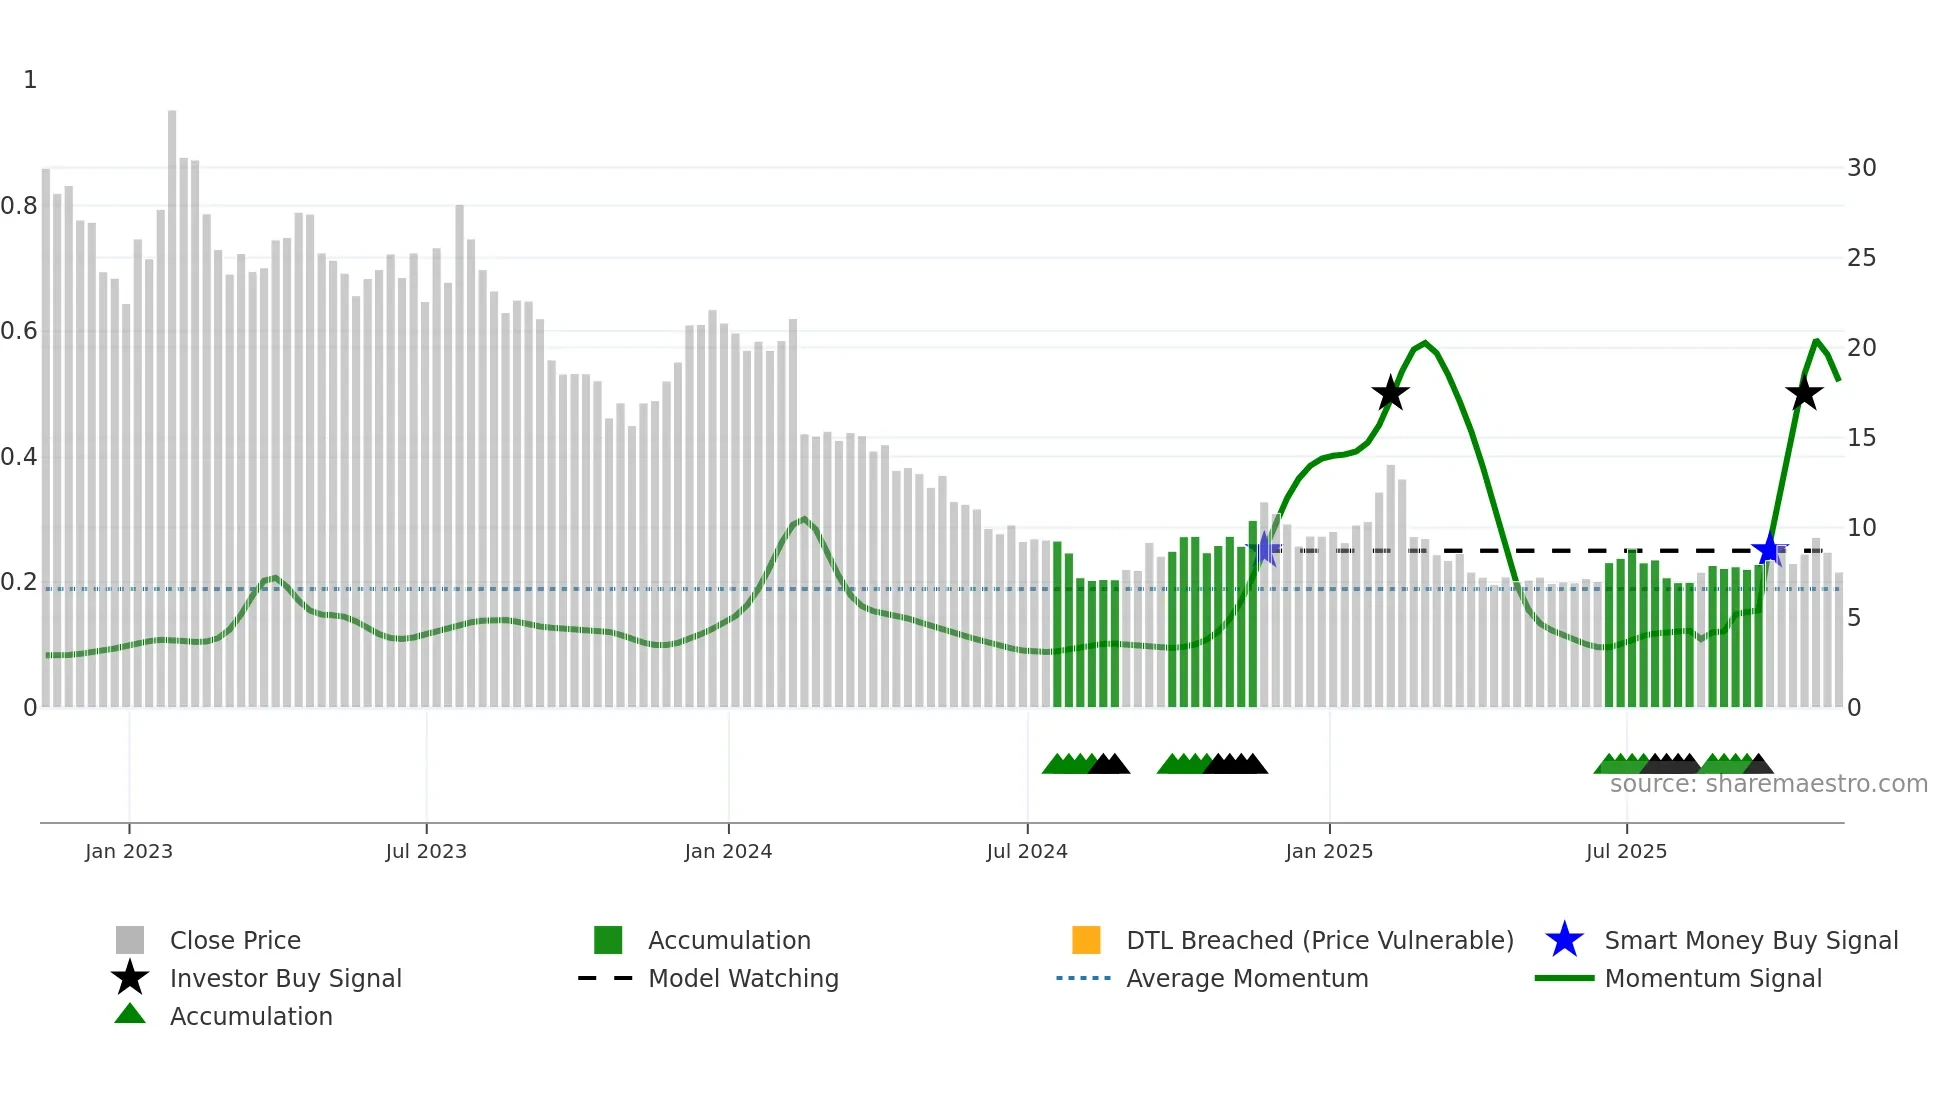
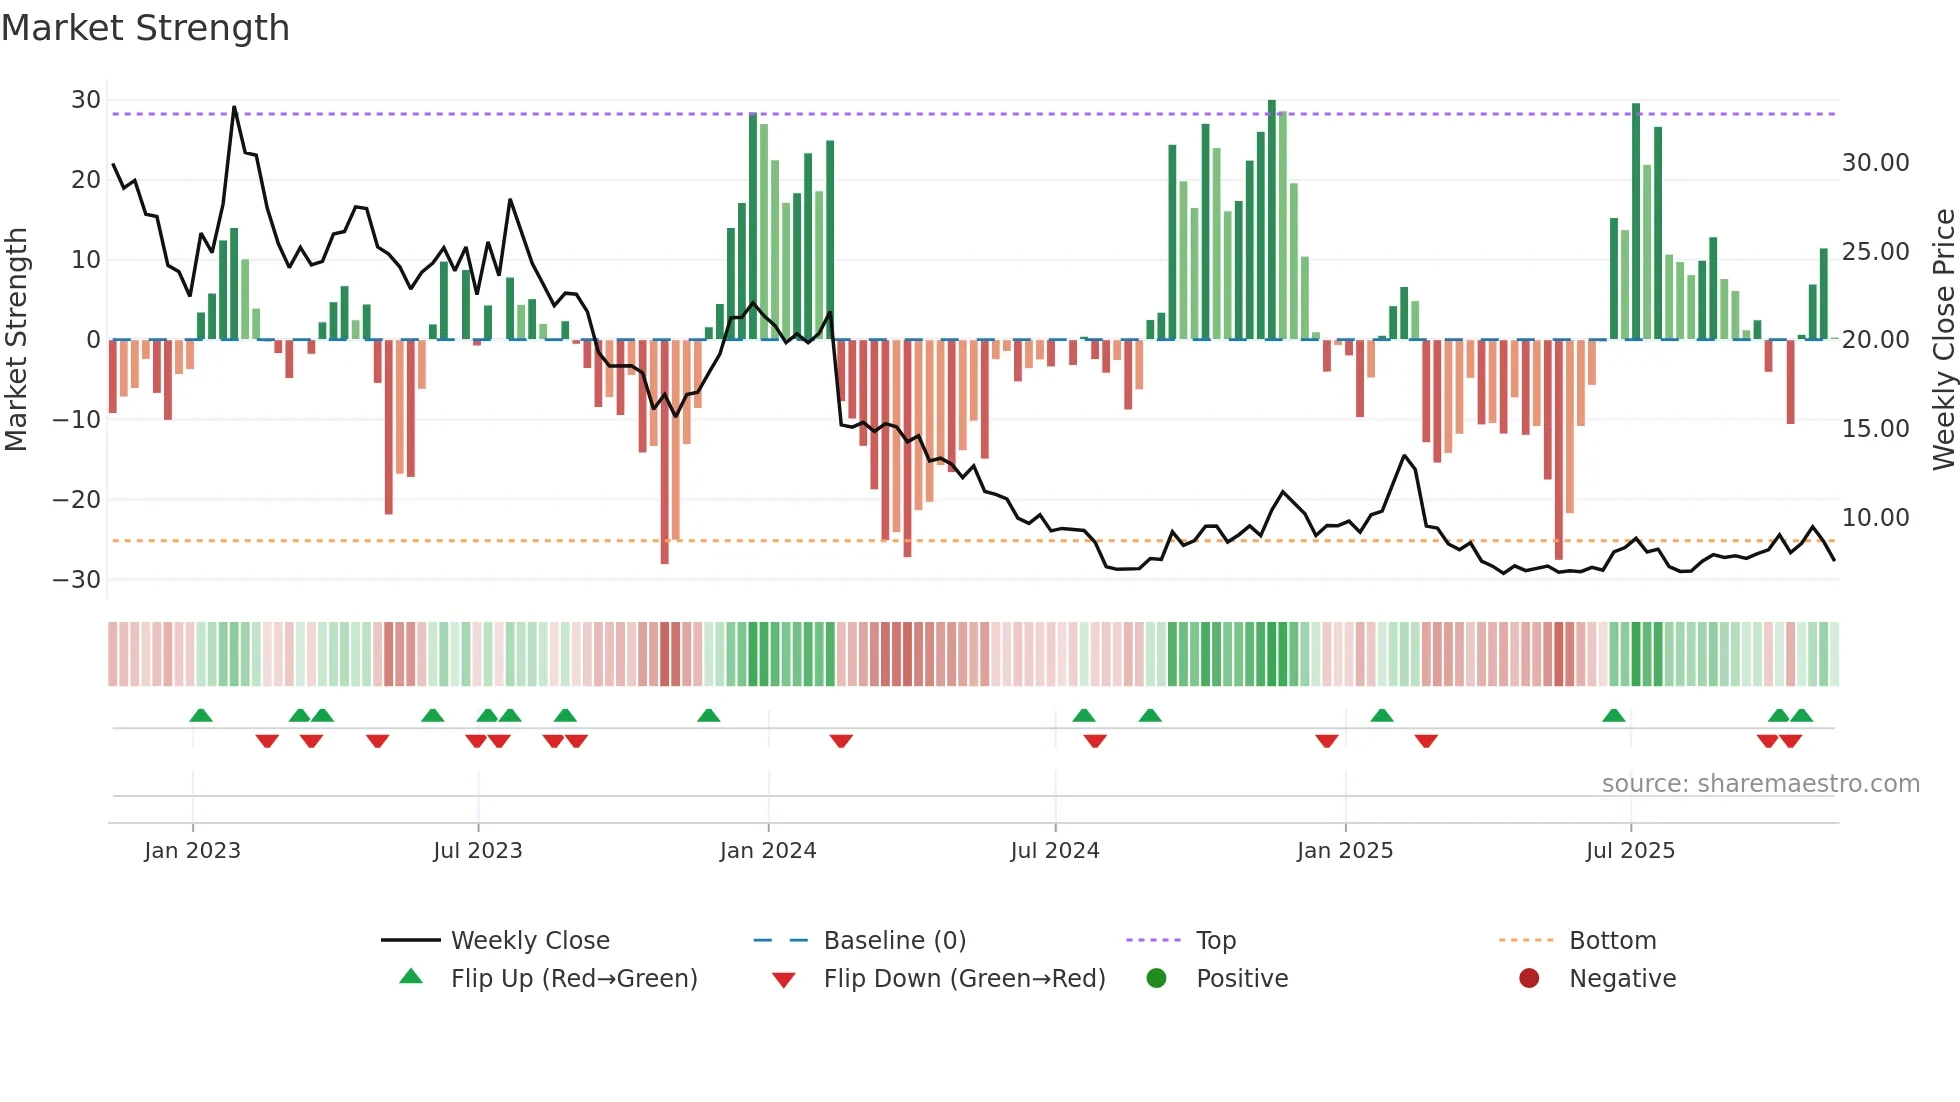
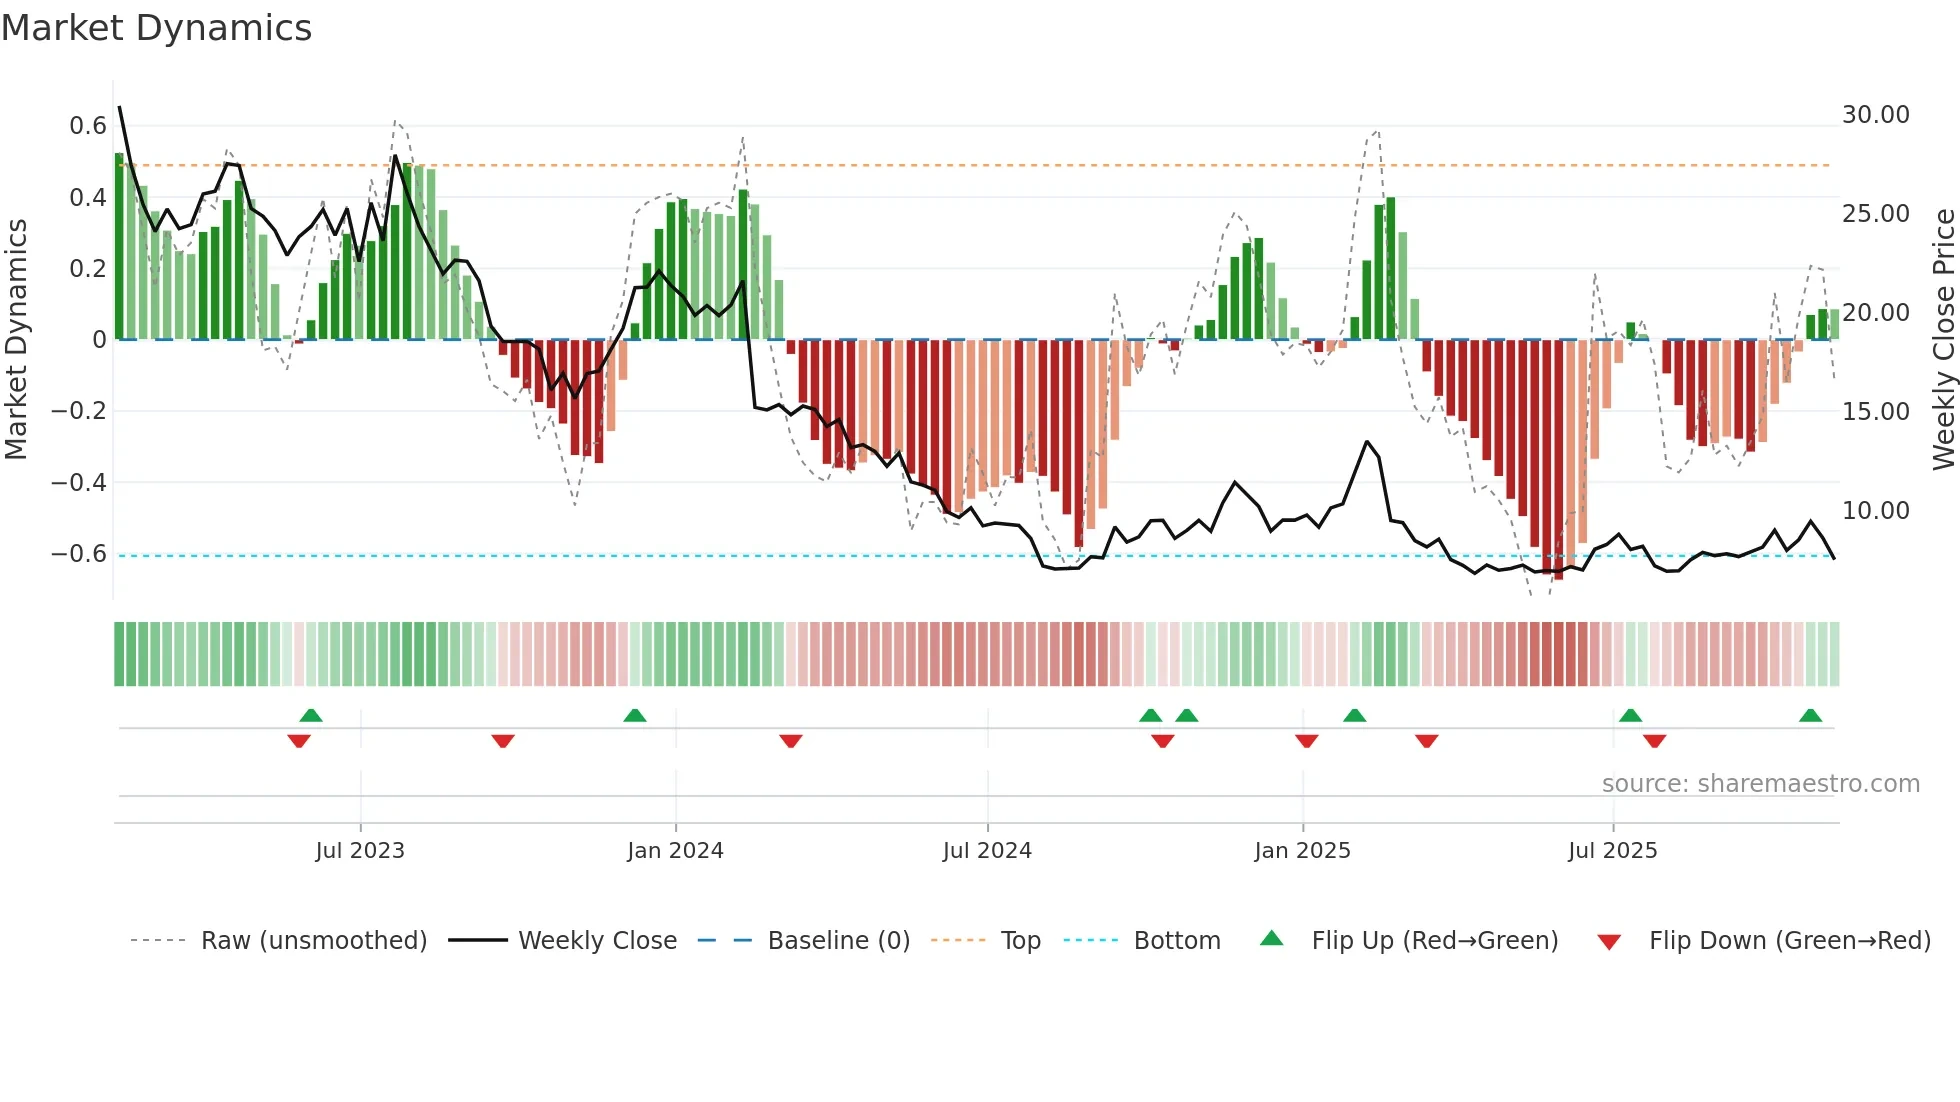
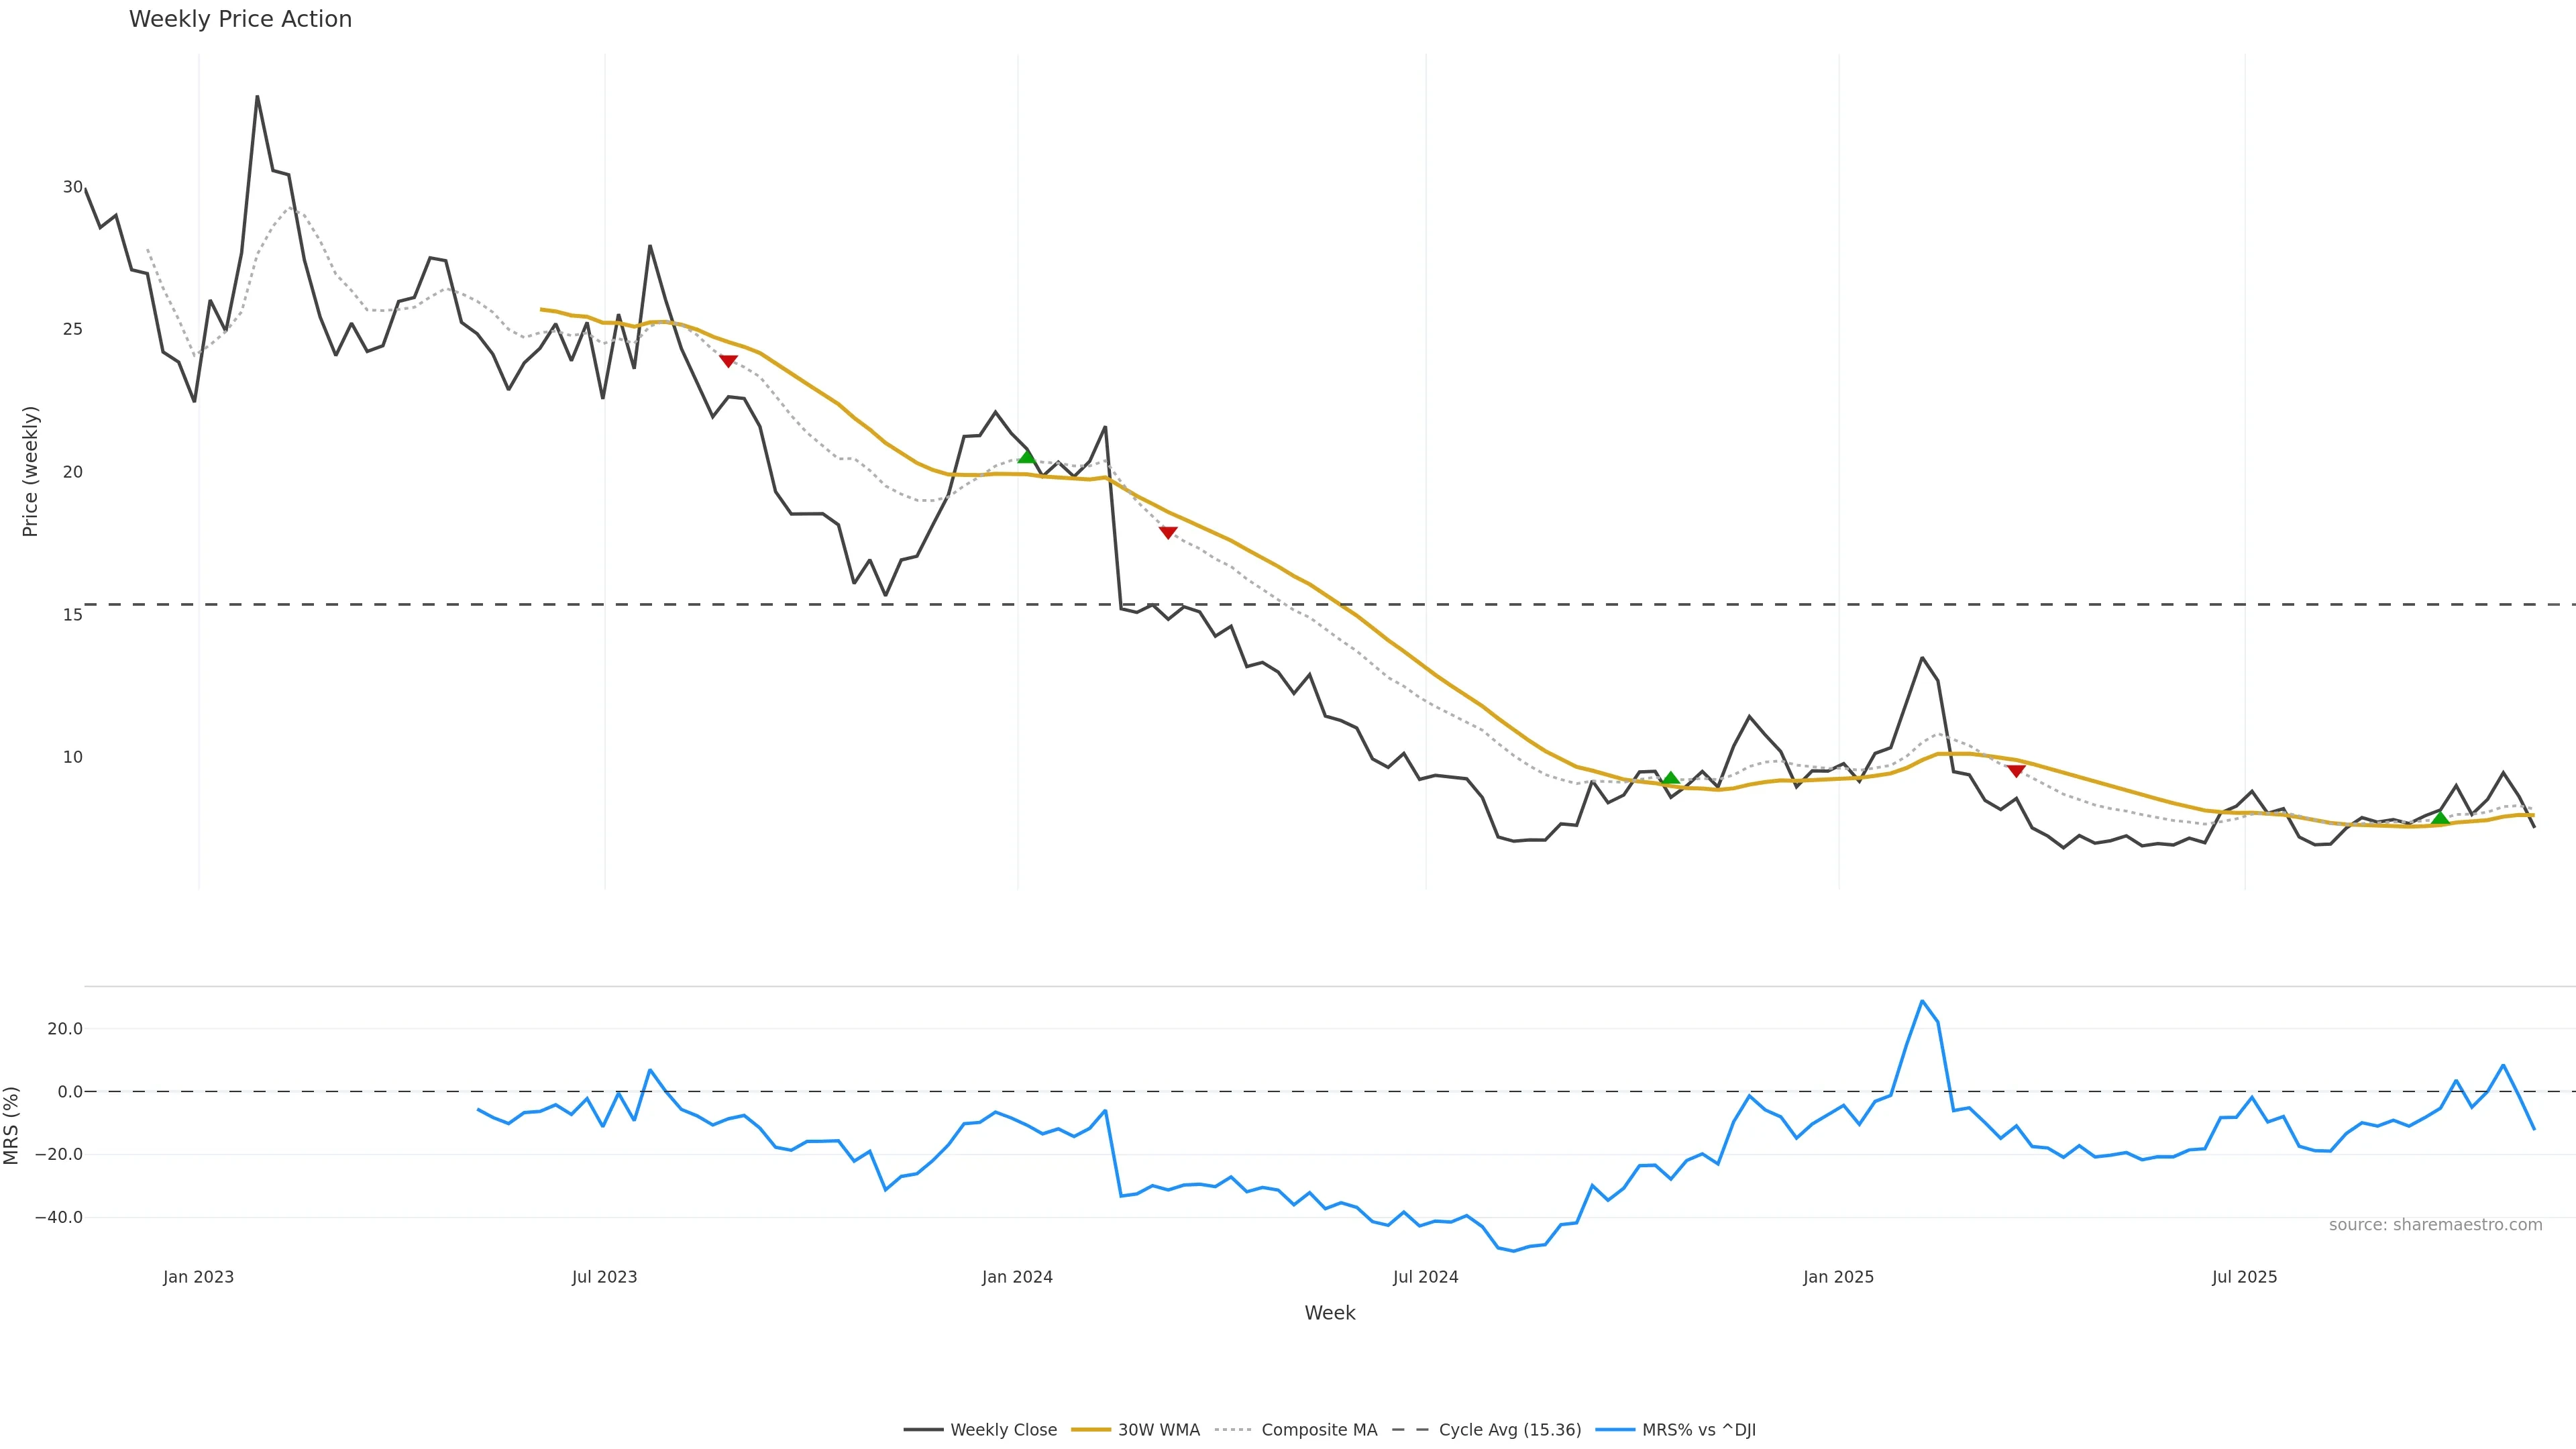
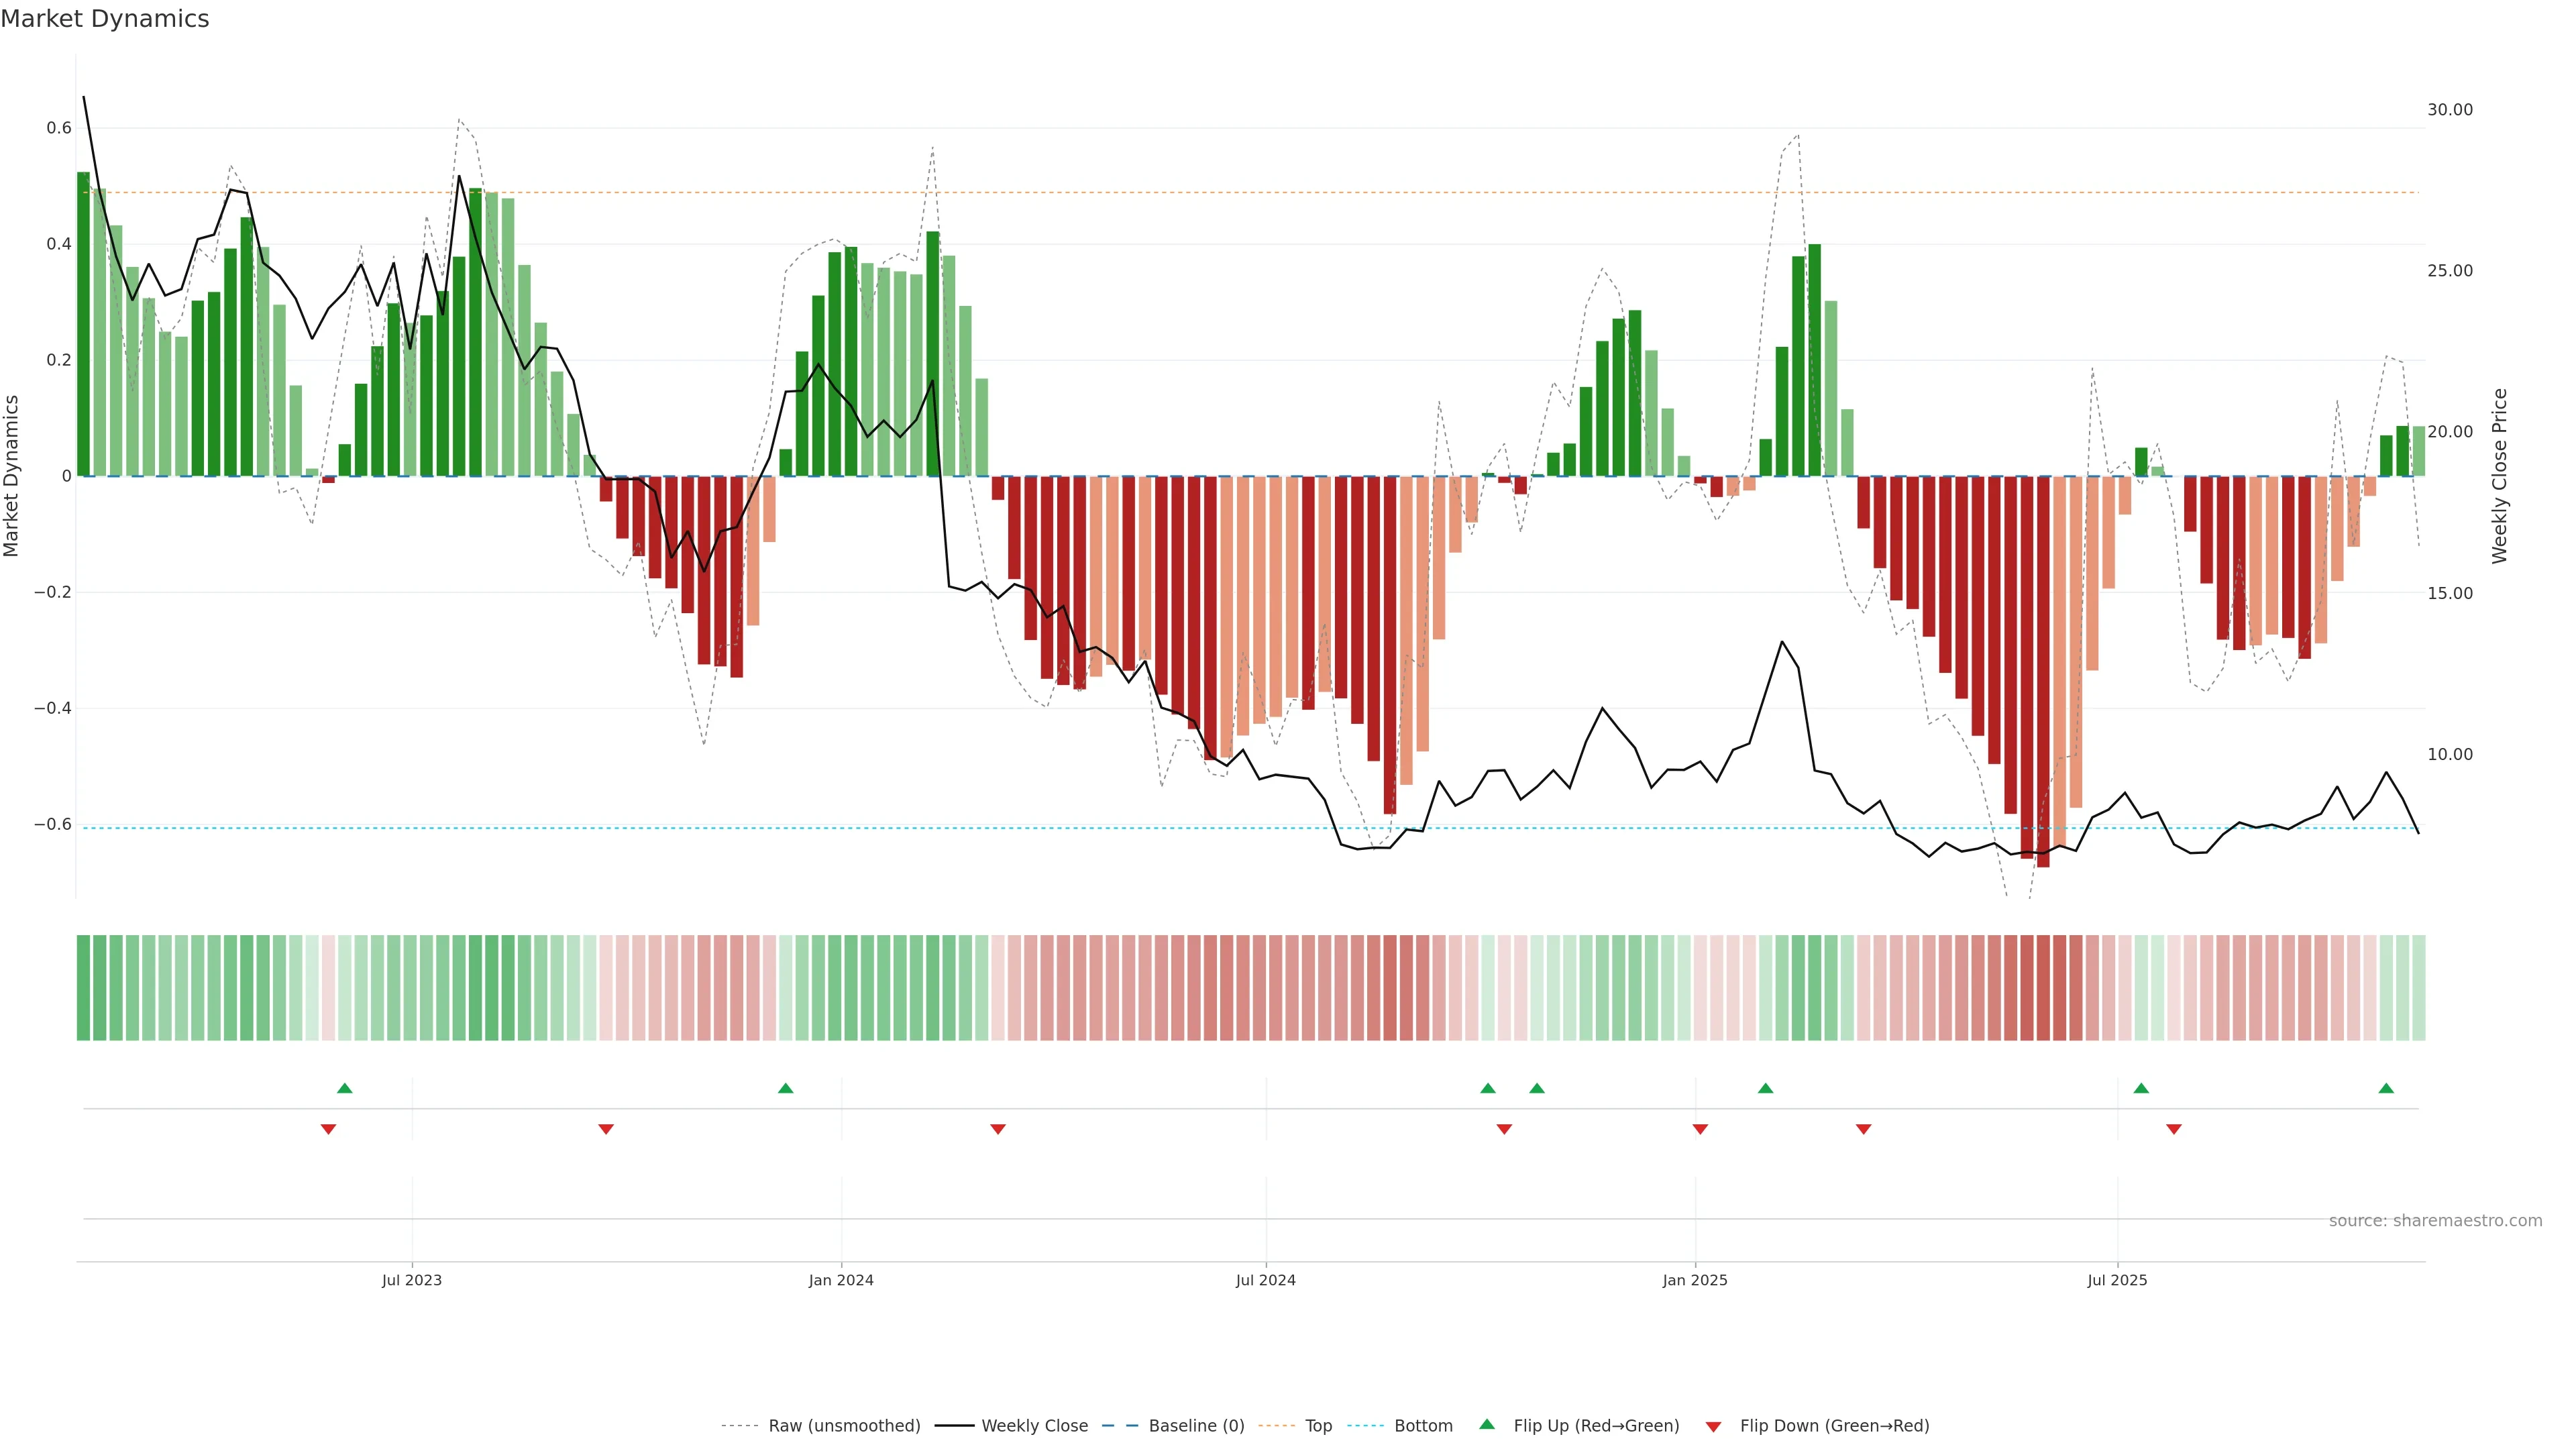
Recent ribbon flip to green. — First bars of a new state can build trend.
Score 0.5
+1 / -0
Level 0.087
Recent ribbon flip to green.
Recent ribbon flip to green. First bars of a new state can build trend. In essence this reflects state changes, ribbon flips, and early trend anatomy with a bullish tilt.
pol 0.5
conf 0.6
moderate · medium
What it means
Recent ribbon flip to green. First bars of a new state can build trend. In essence this reflects state changes, ribbon flips, and early trend anatomy with a bullish tilt.
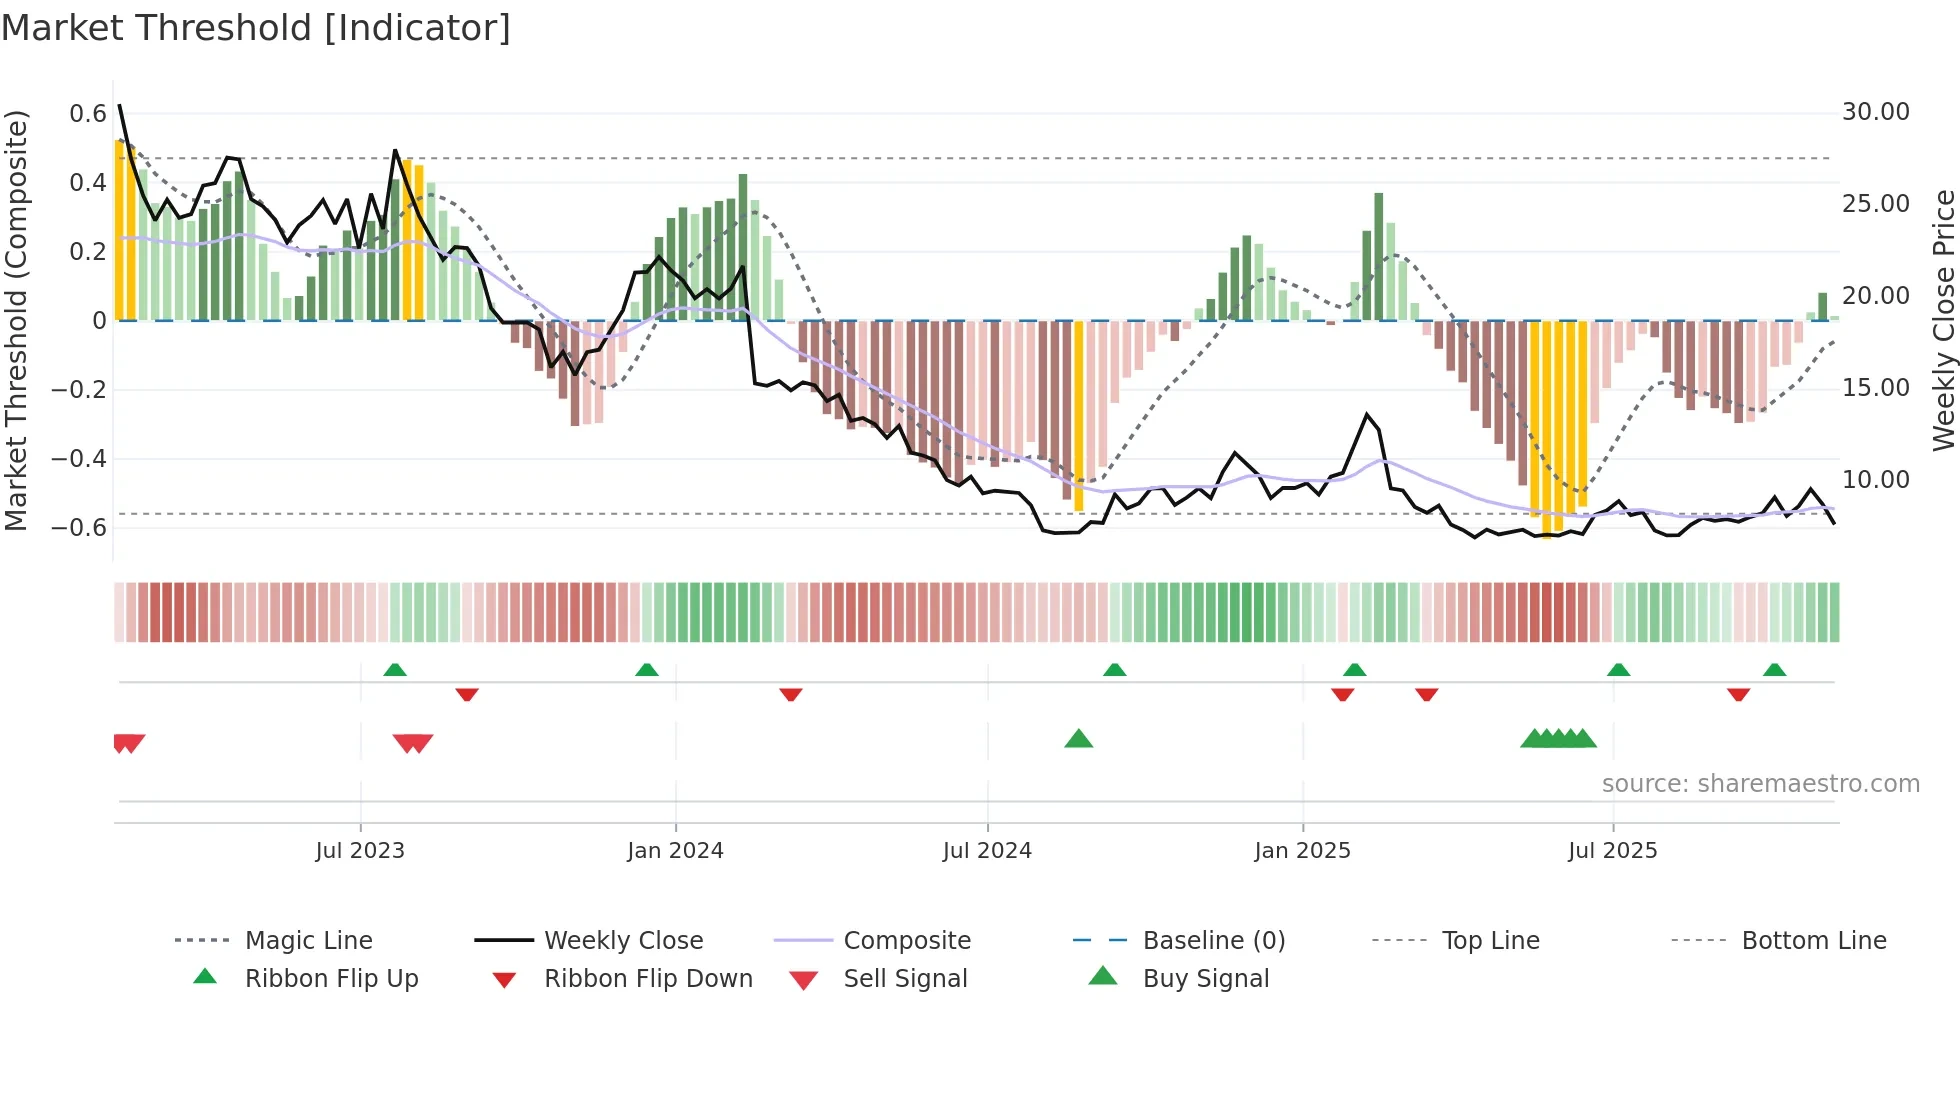
Implications
Improves odds for follow-through if pullbacks hold higher lows. (pol 0.50, conf 0.60 → moderate/medium)
No additional observations.