Generic Engineering Construction and Projects Limited
GENCON NSE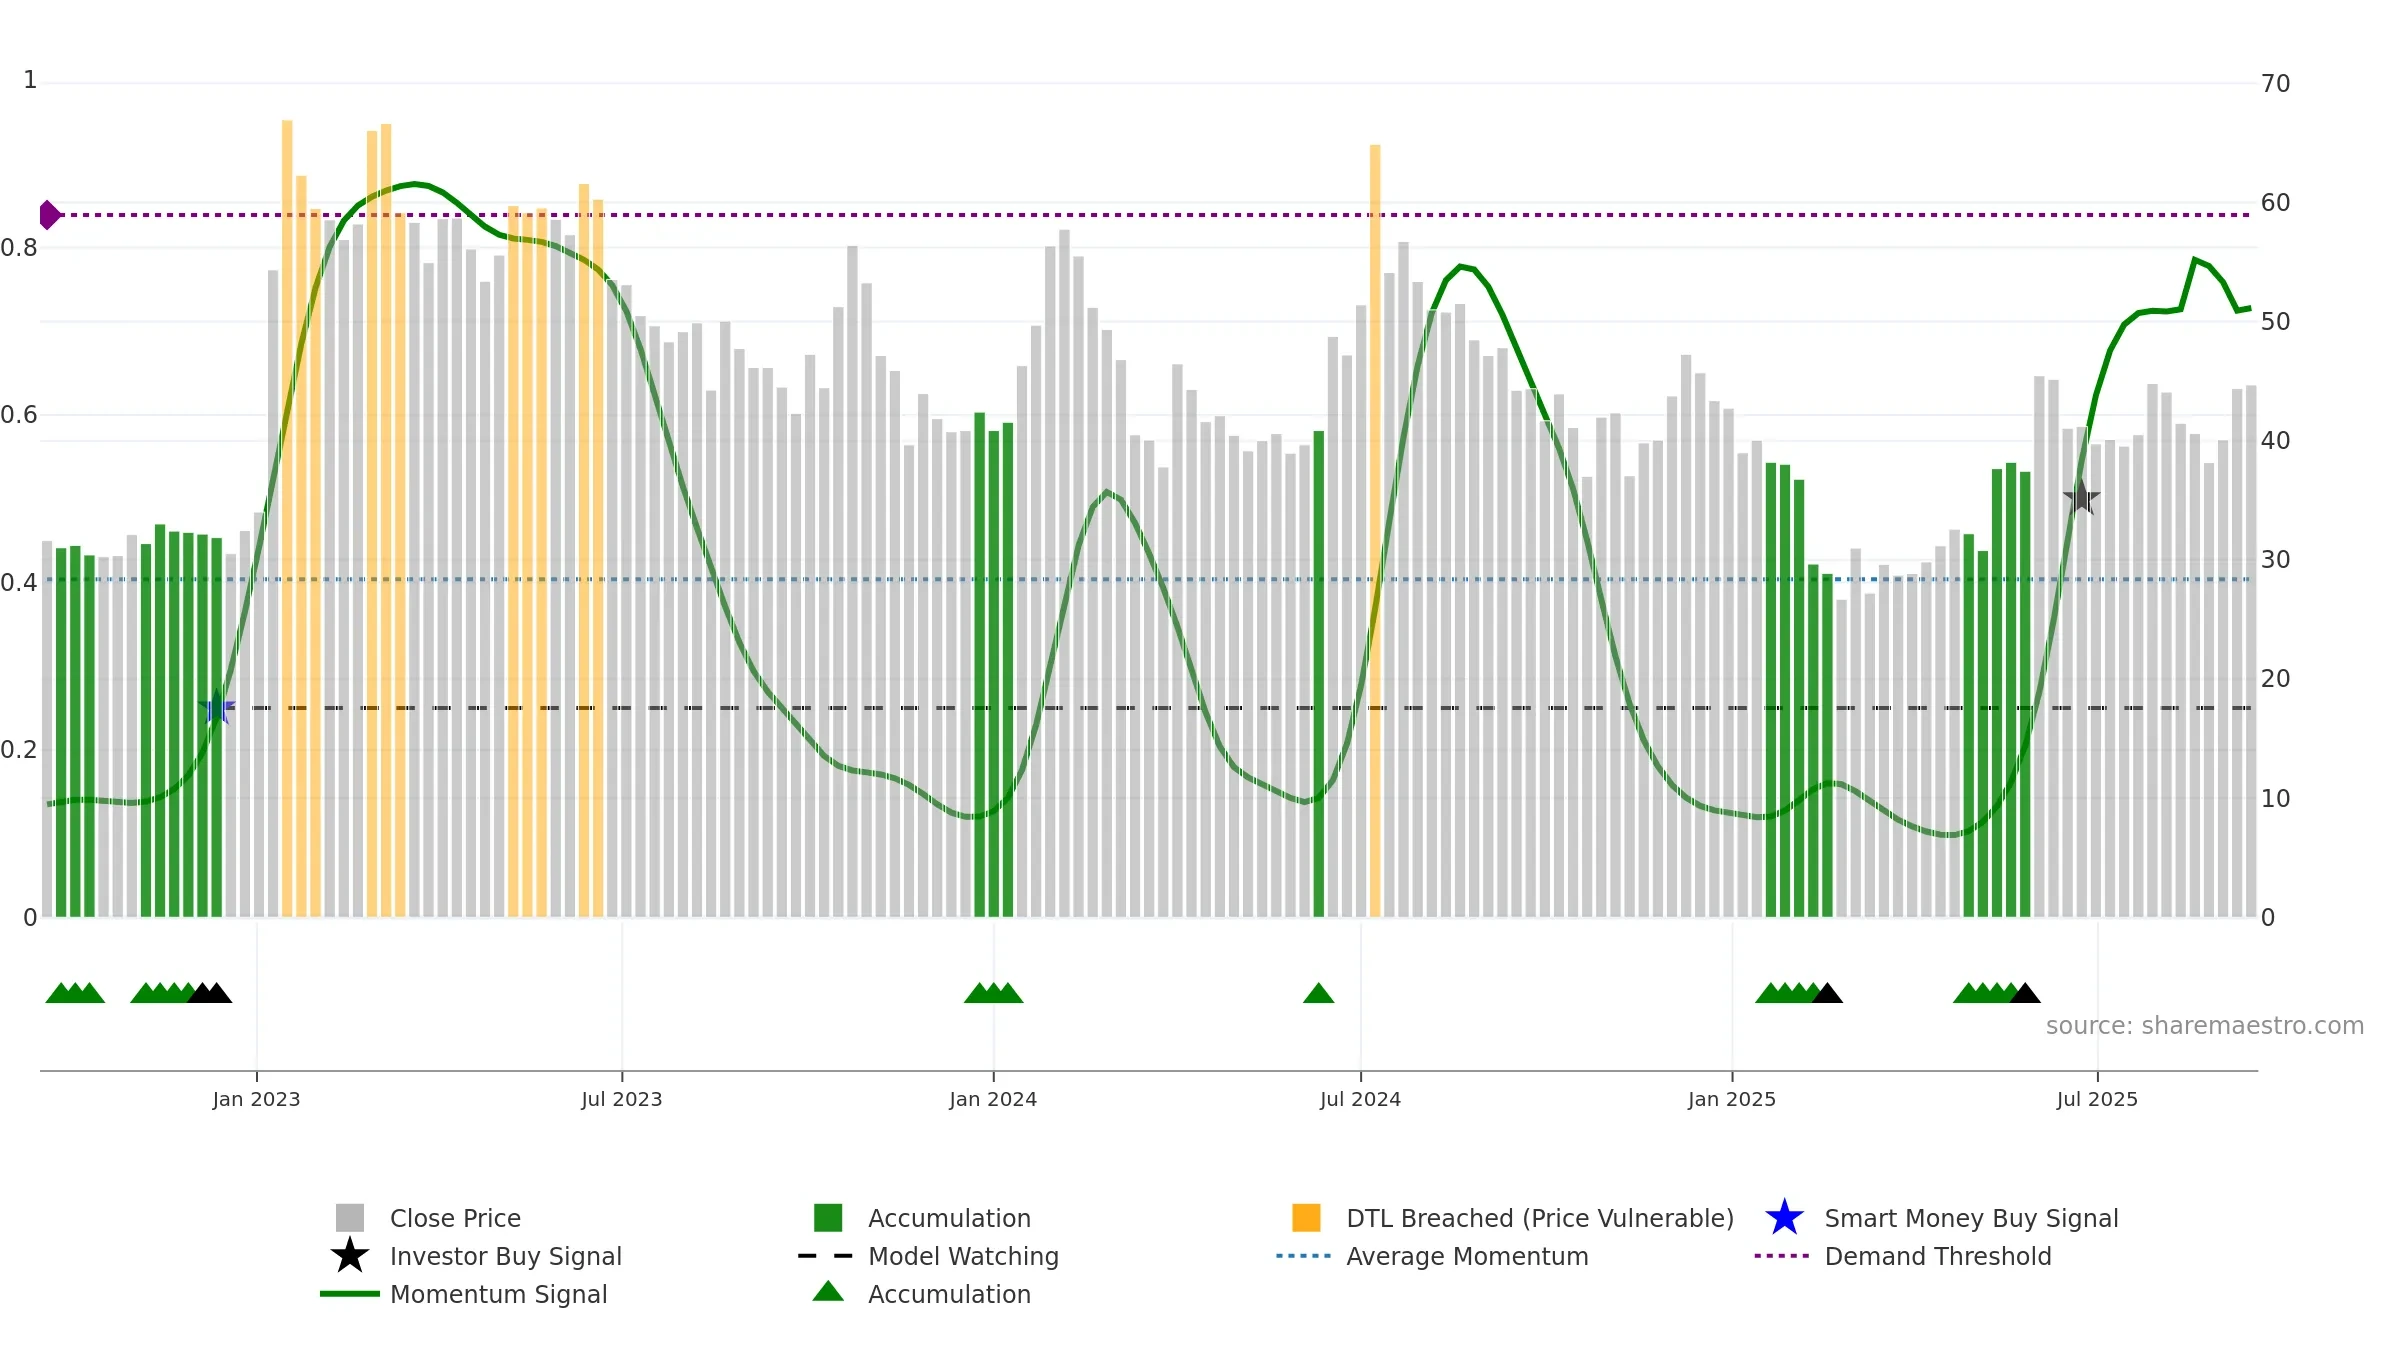
Weekly Report
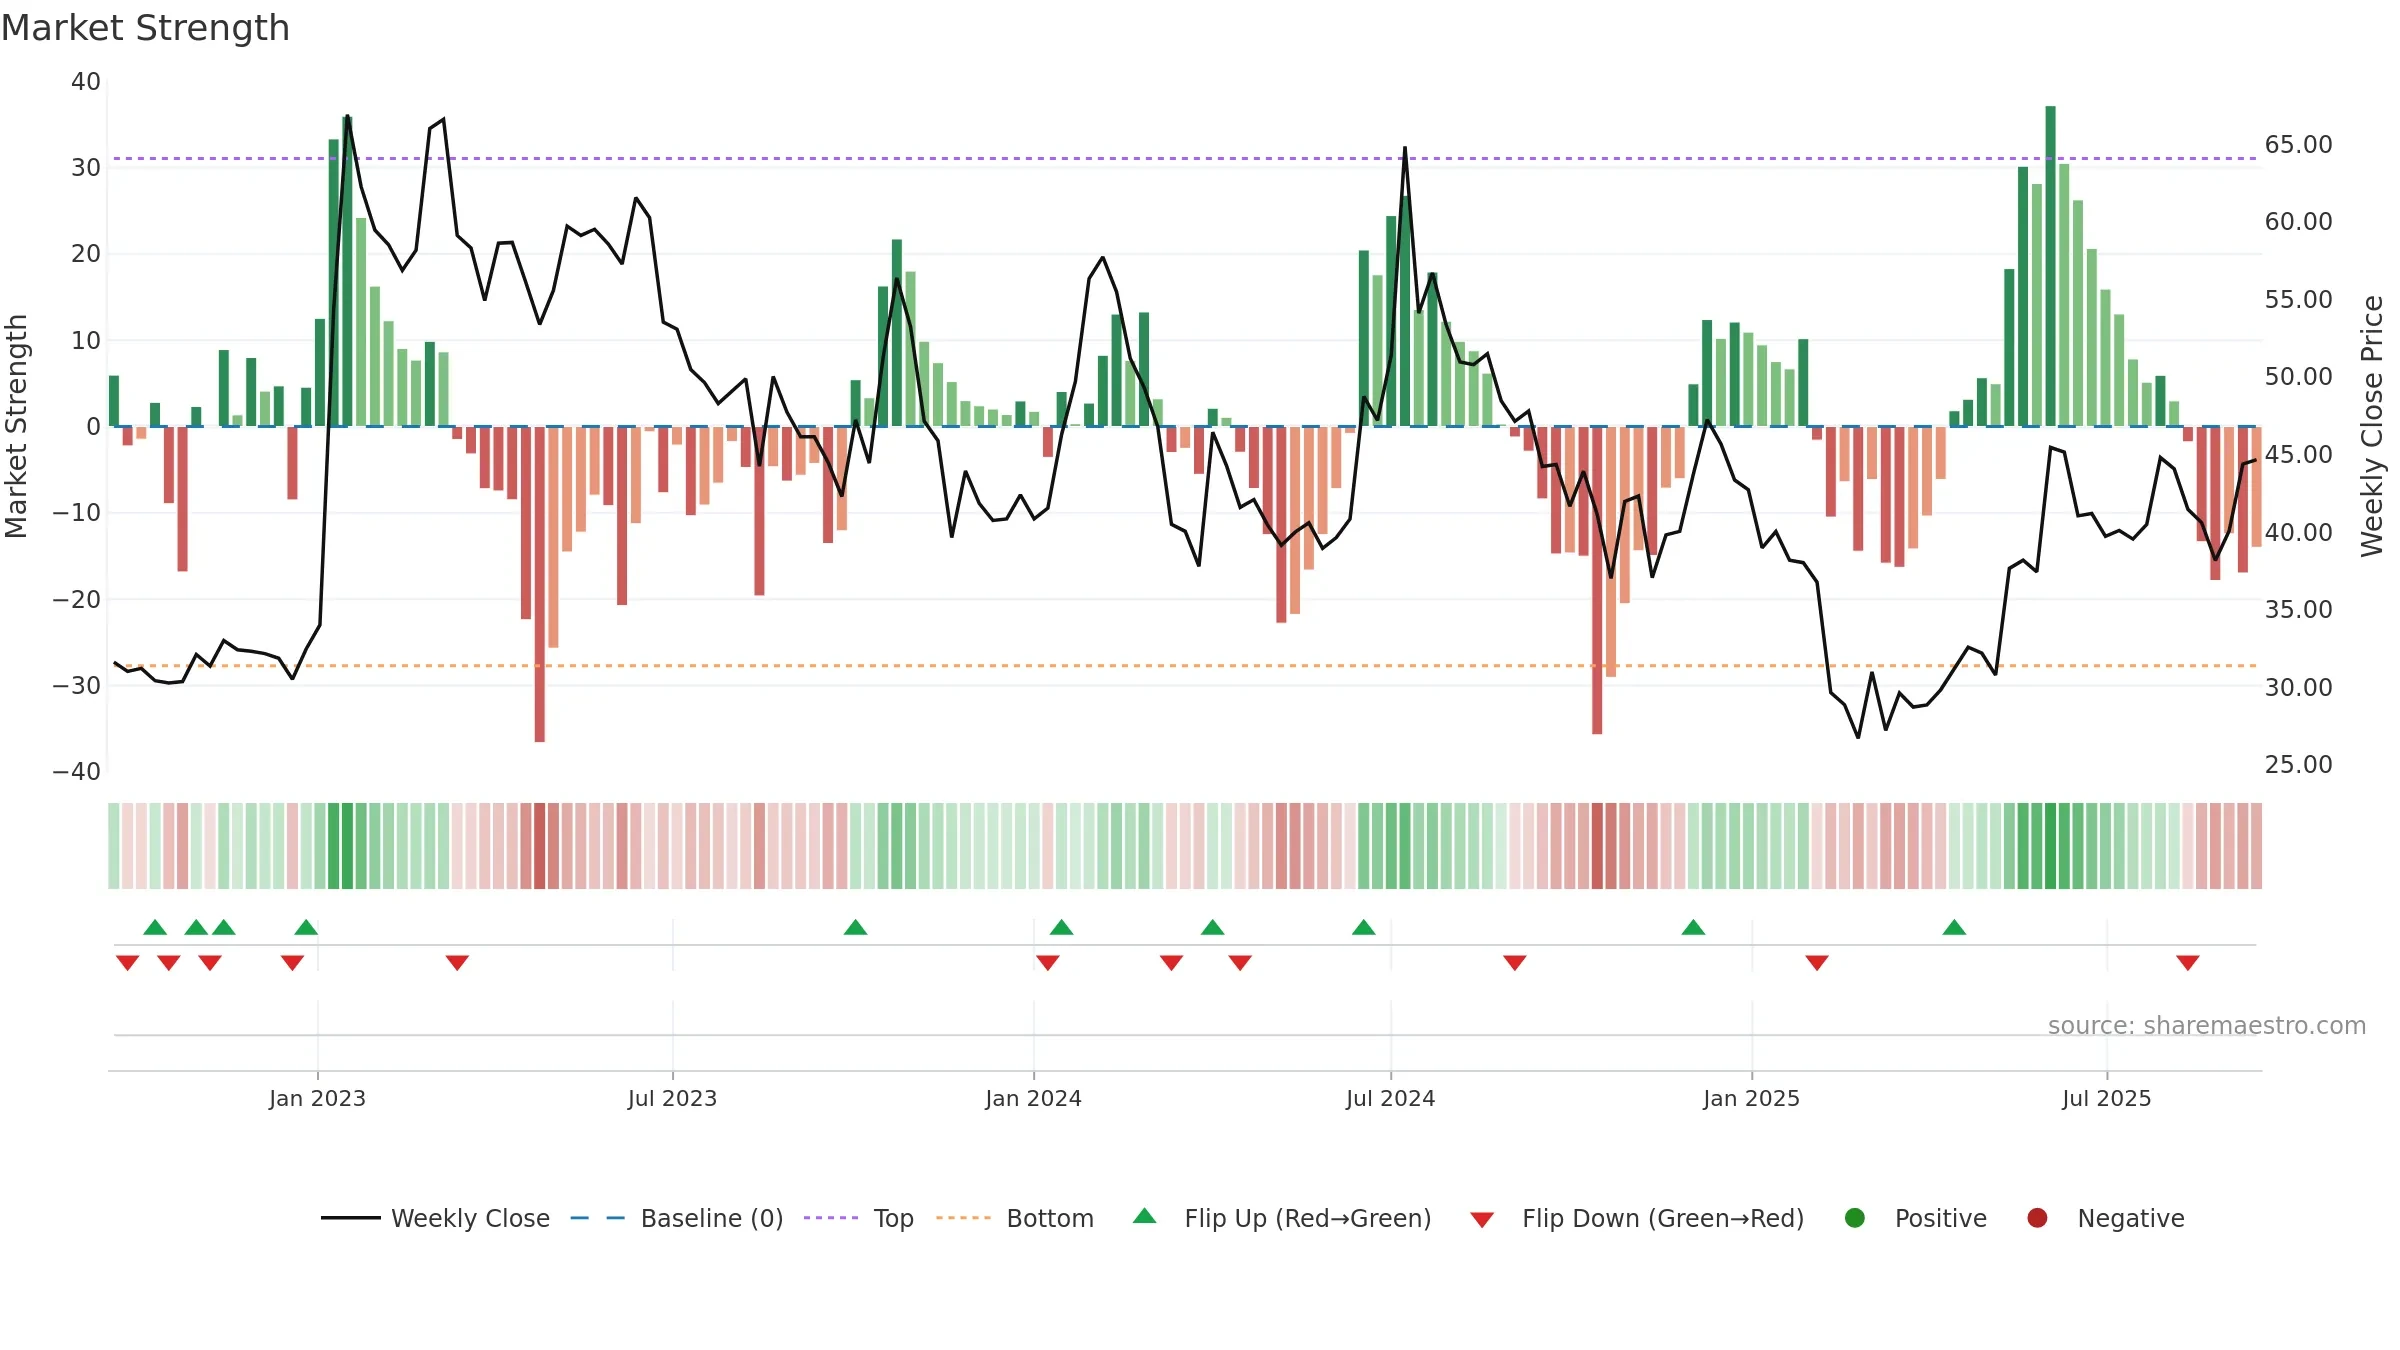
Generic Engineering Construction and Projects Limited closed at 44.6800 (3.91% WoW) . Data window ends Mon, 15 Sep 2025.
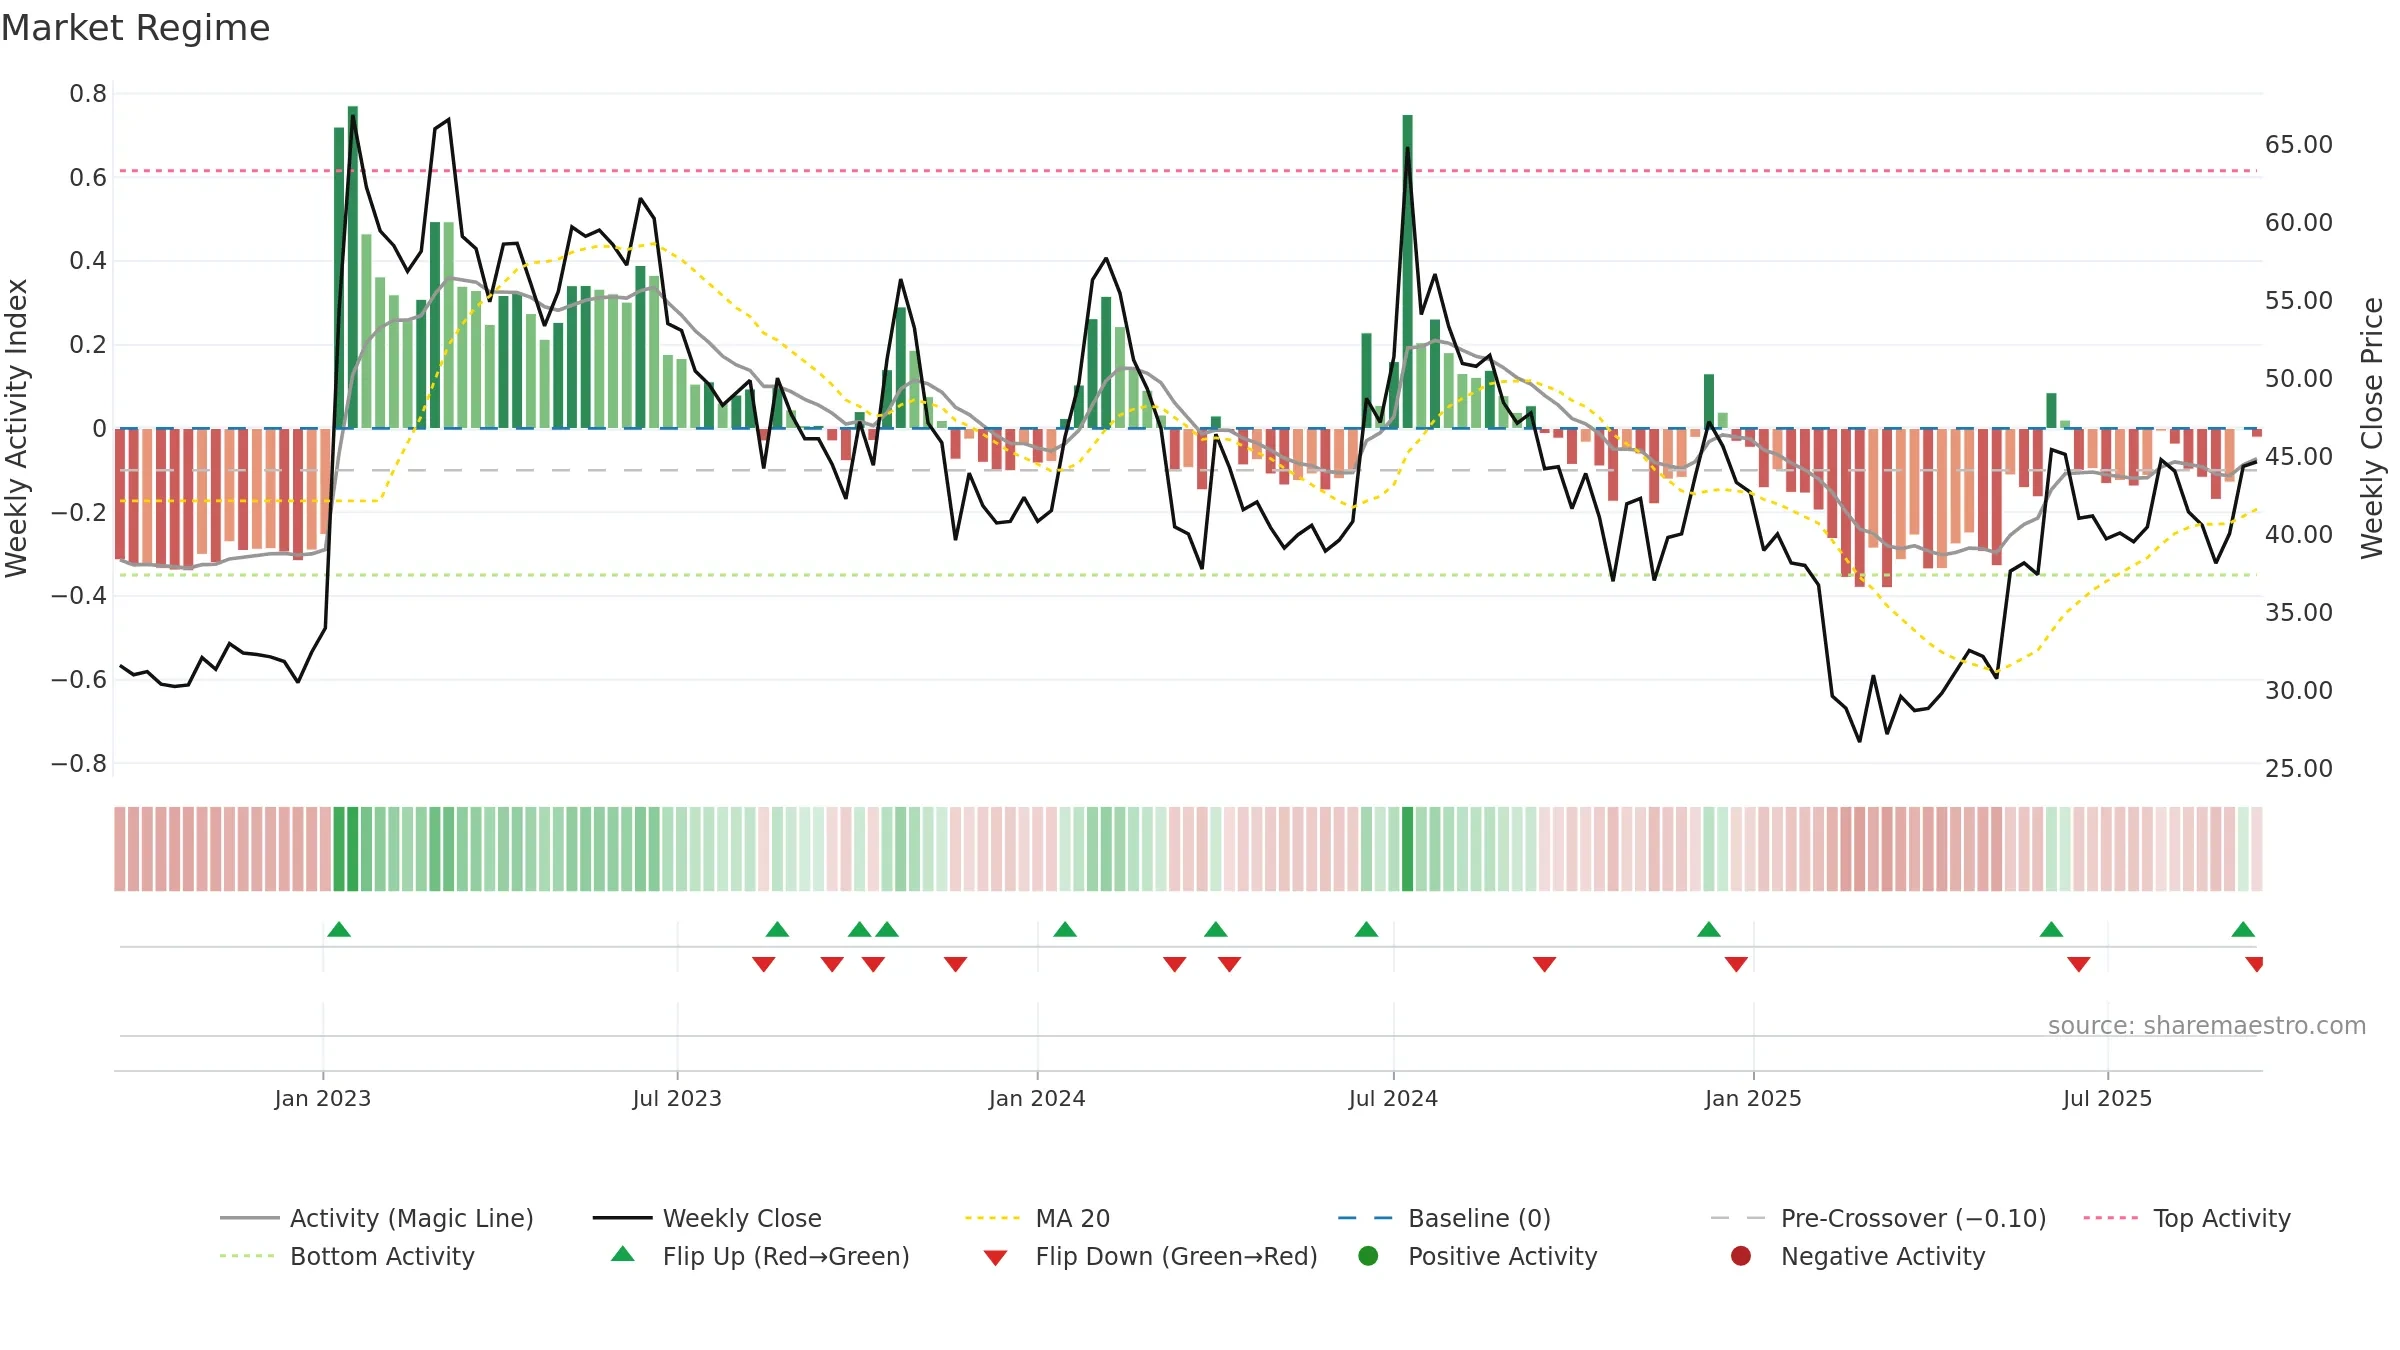
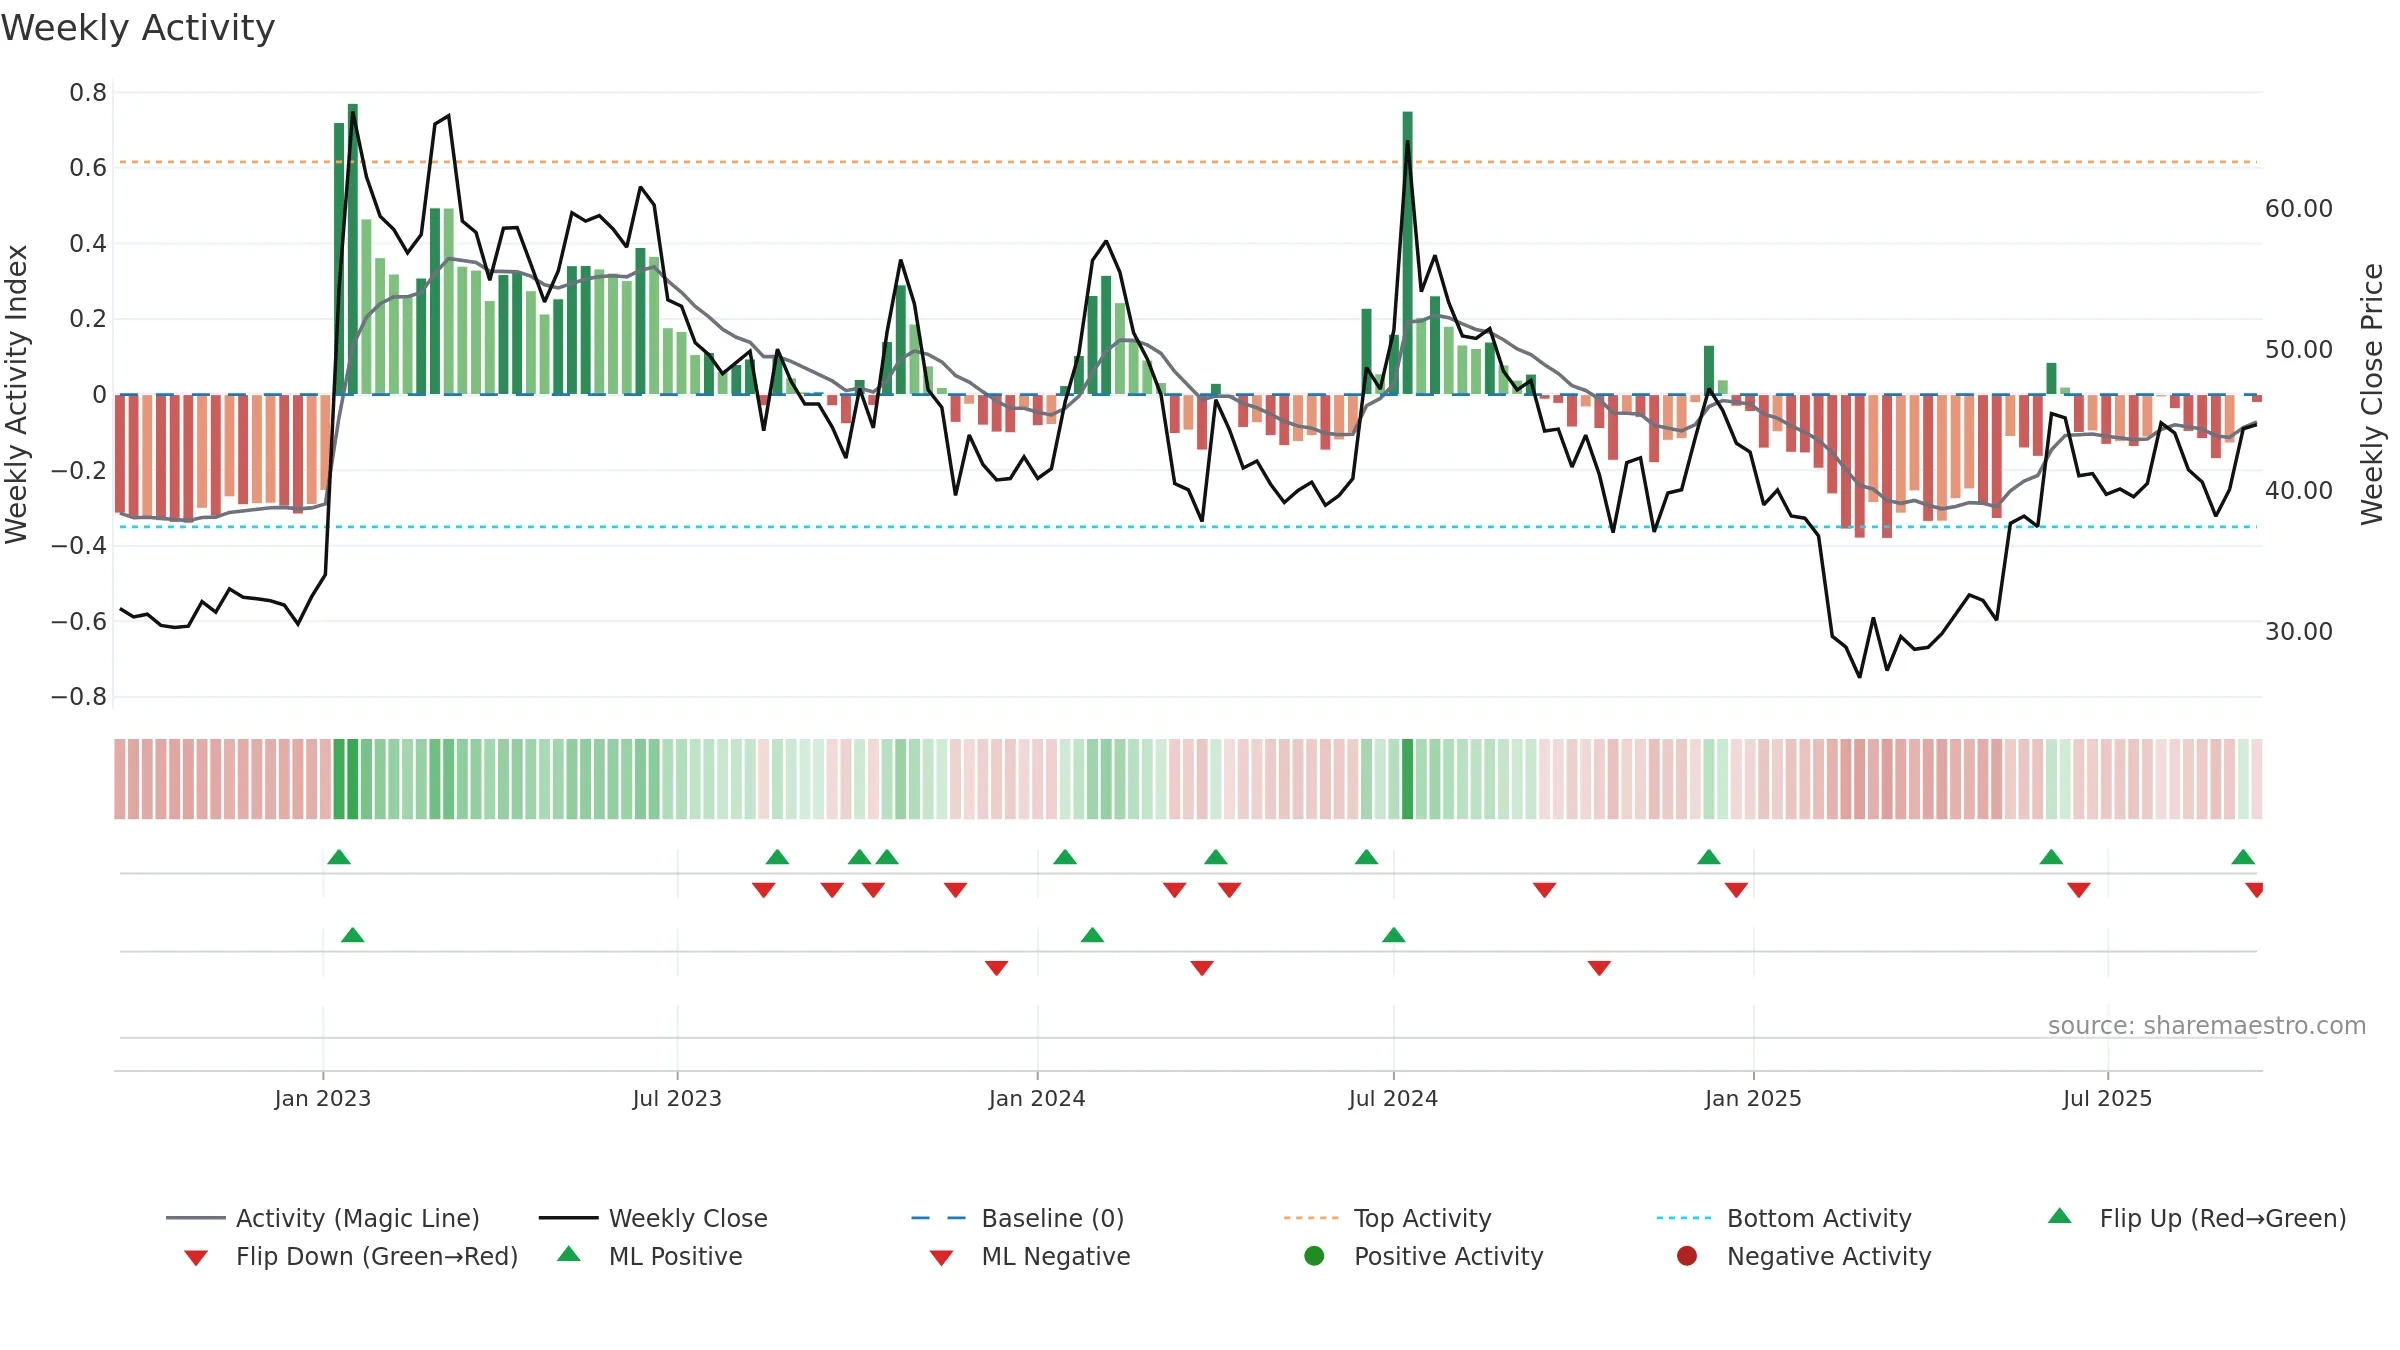
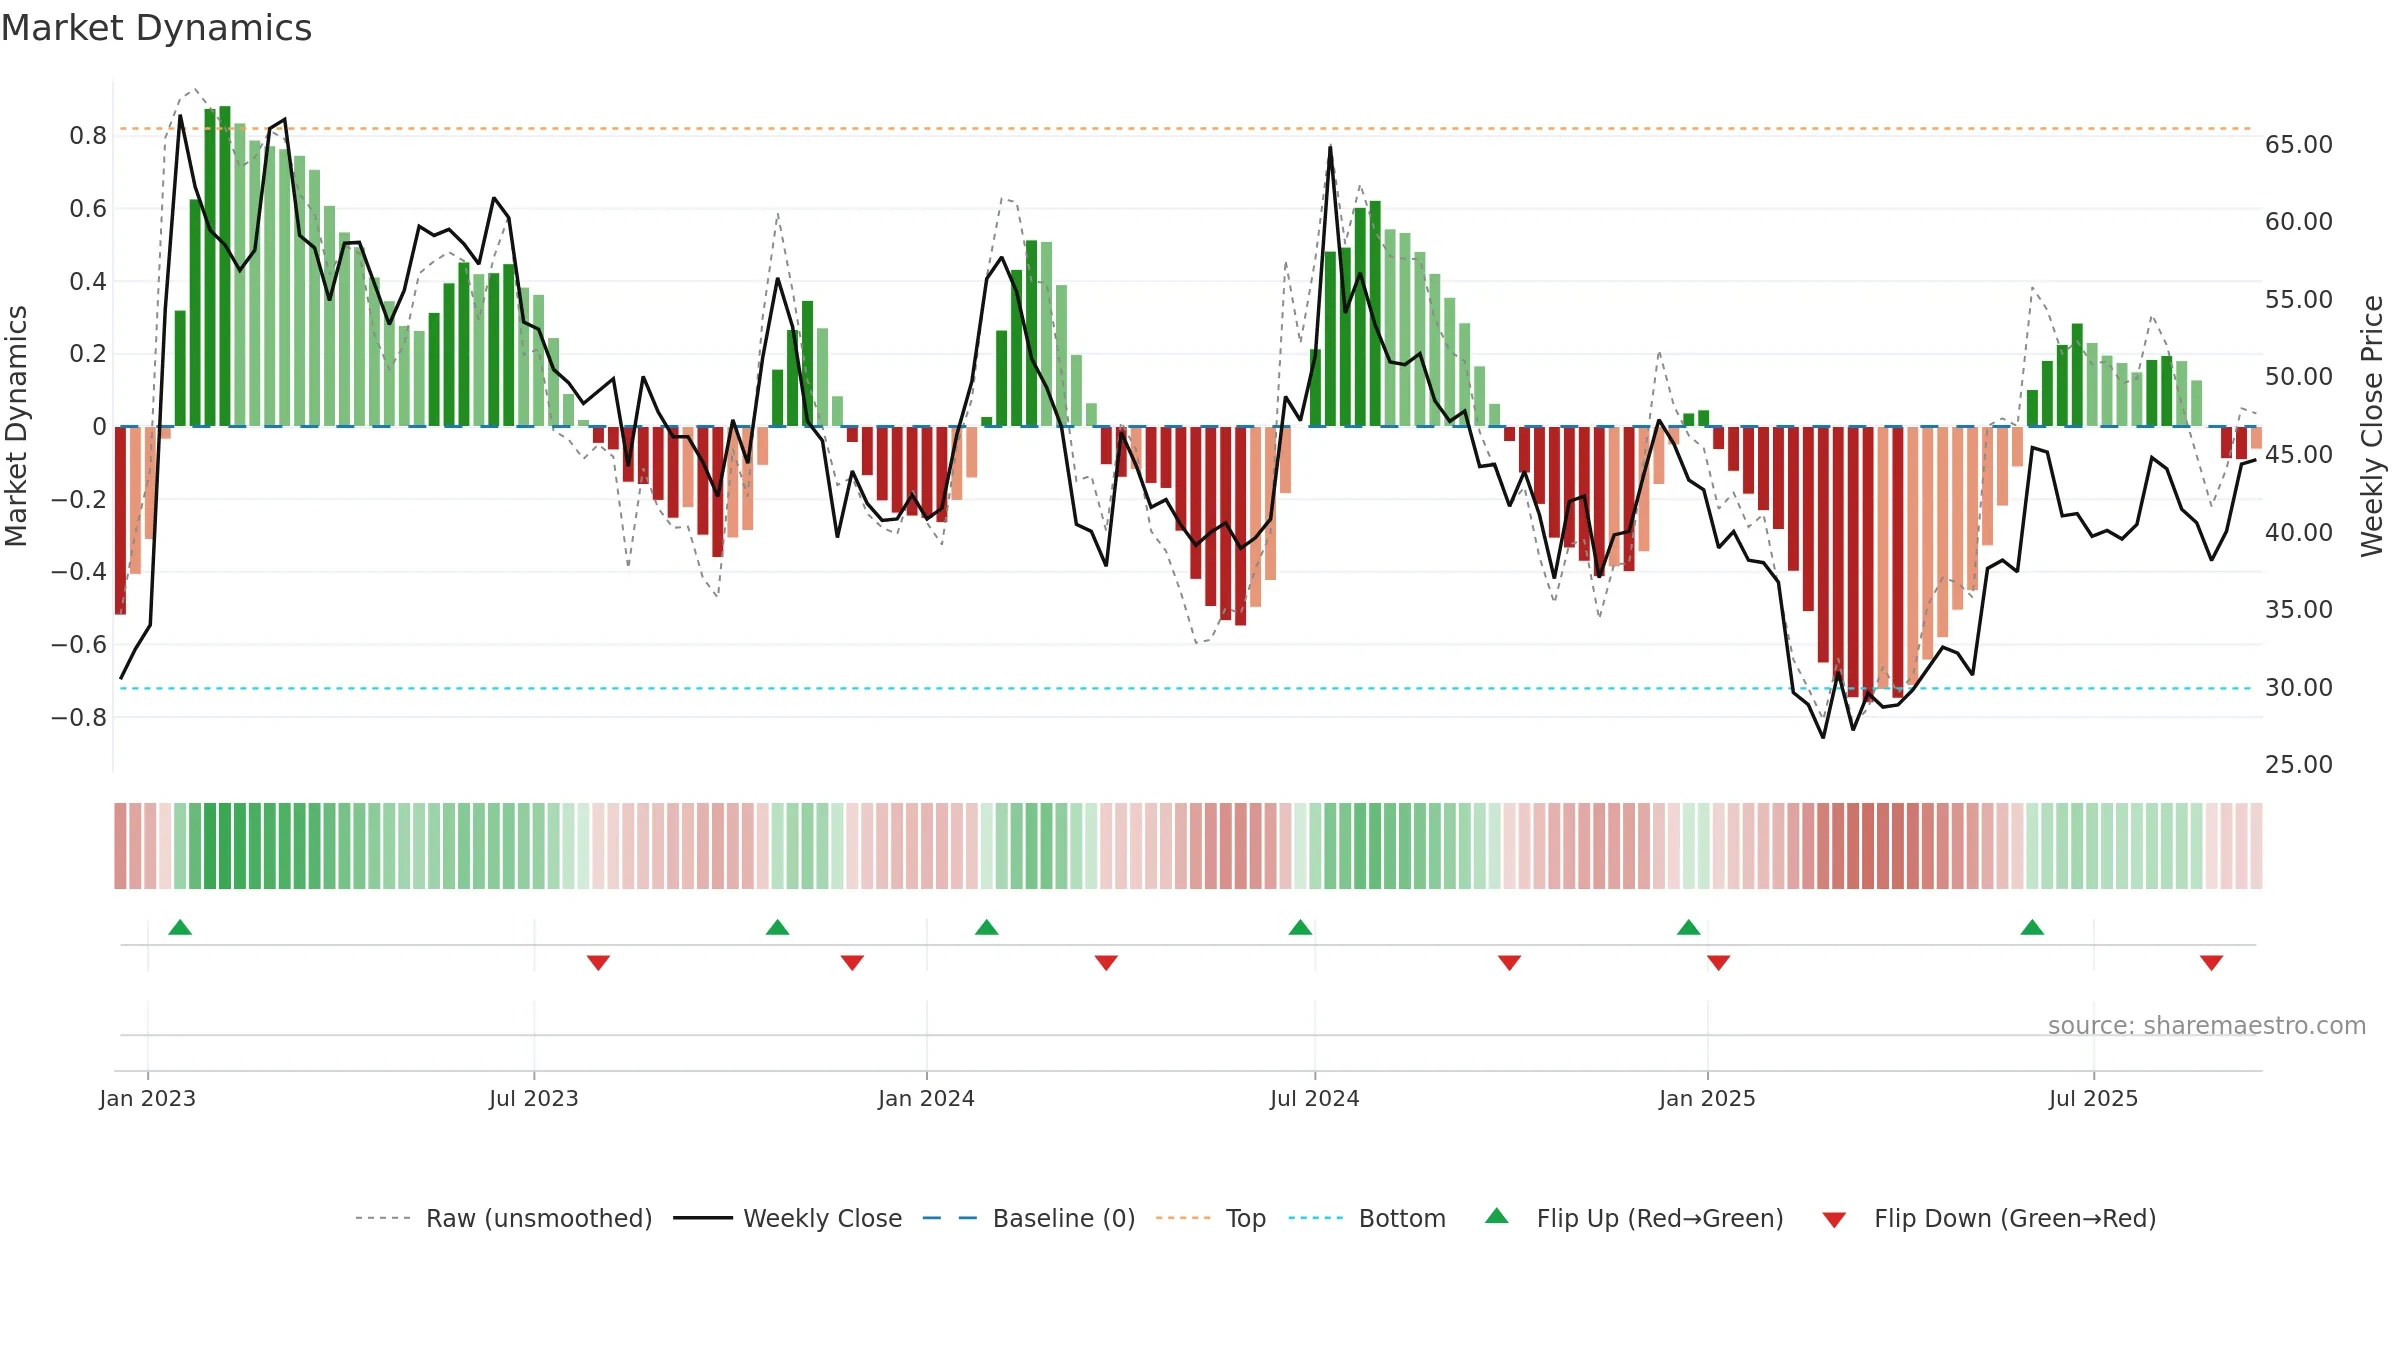
How to read this — Price slope is downward, indicating persistent supply pressure. Volume trend diverges from price — watch for fatigue or rotation. Distance to baseline is narrowing — reverting closer to its fair-value track. Price holds above key averages, indicating constructive participation.
Down-slope argues for patience; rallies can fade sooner unless participation improves. Because liquidity isn’t confirming, prefer evidence of fresh demand before chasing moves.
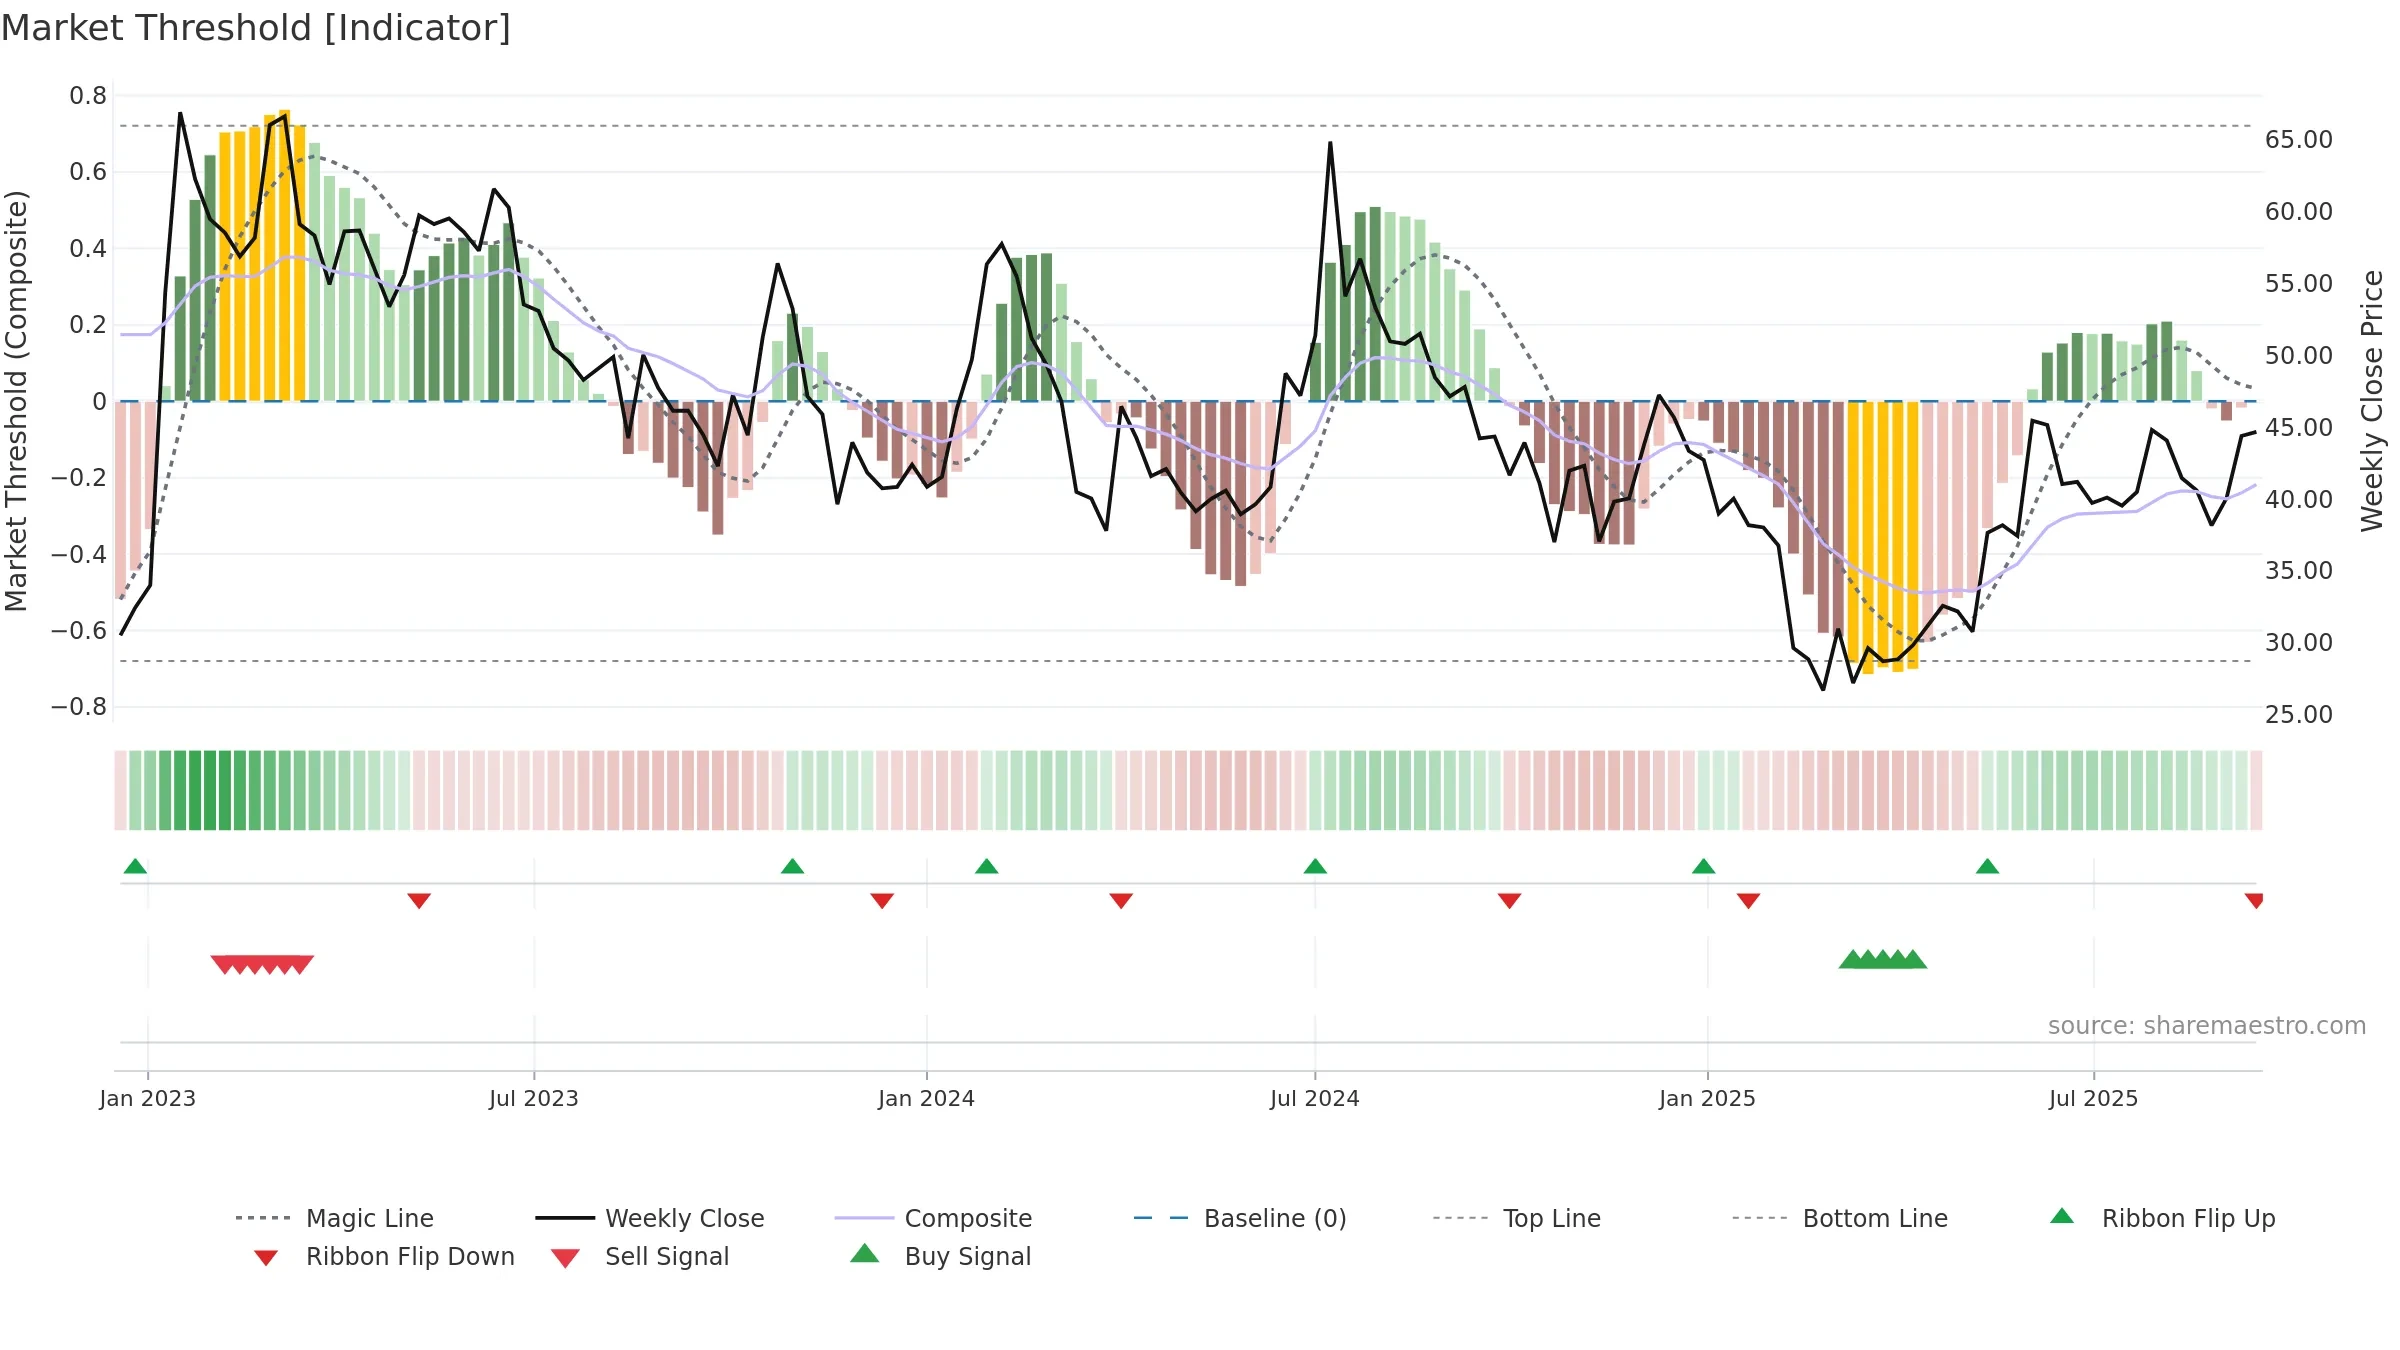
Gauge maps the trend signal to a 0–100 scale.
How to read this — Gauge is elevated but momentum is rolling over; topping risk is rising.
Stay alert: protect gains or seek confirmation before adding risk.
The flag is positive: favourable upside skew with supportive conditions.
Conclusion
Neutral setup. ★★★☆☆ confidence. Price window: -0. Trend: Uptrend at Risk; gauge 72. In combination, liquidity diverges from price.
- Price holds above 8w & 26w averages
- High-level but rolling over (topping risk)
- Liquidity diverges from price
- Negative multi-week performance
Why: Price window -0.29% over 8w. Volume trend rising. Liquidity divergence with price. Trend state uptrend at risk. Momentum neutral and rising. Valuation stance positive.
Tip: Most metrics include a hover tooltip where they appear in the report.