Dell Technologies Inc.
DELL NYSE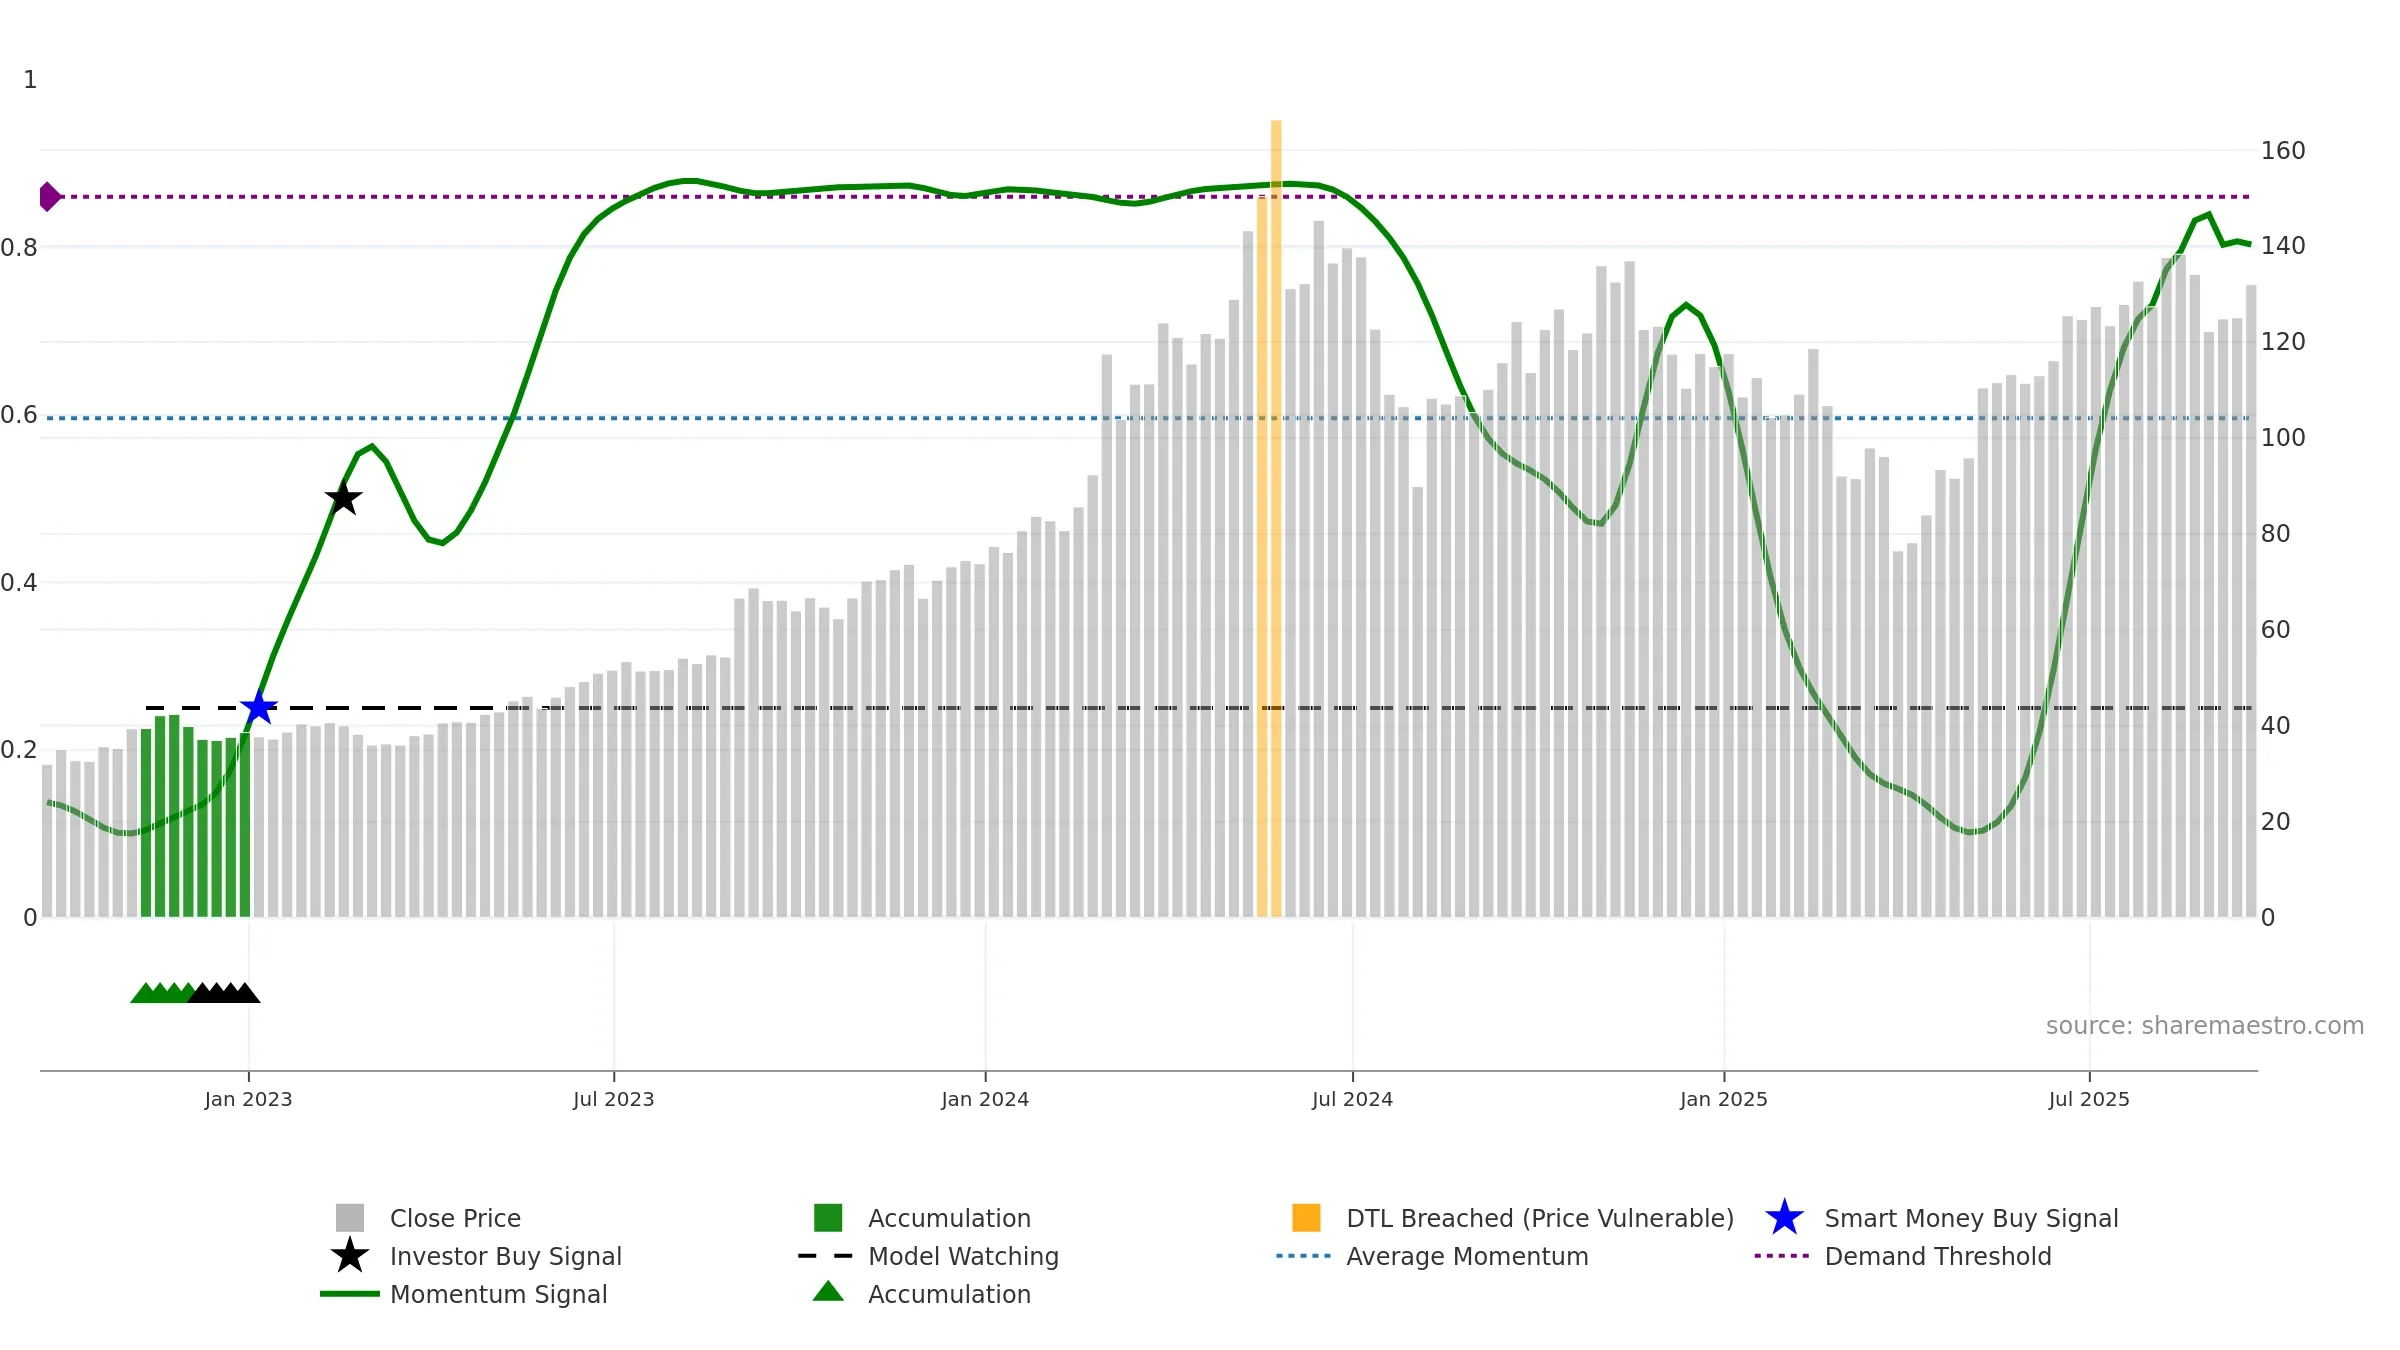
Weekly Summary
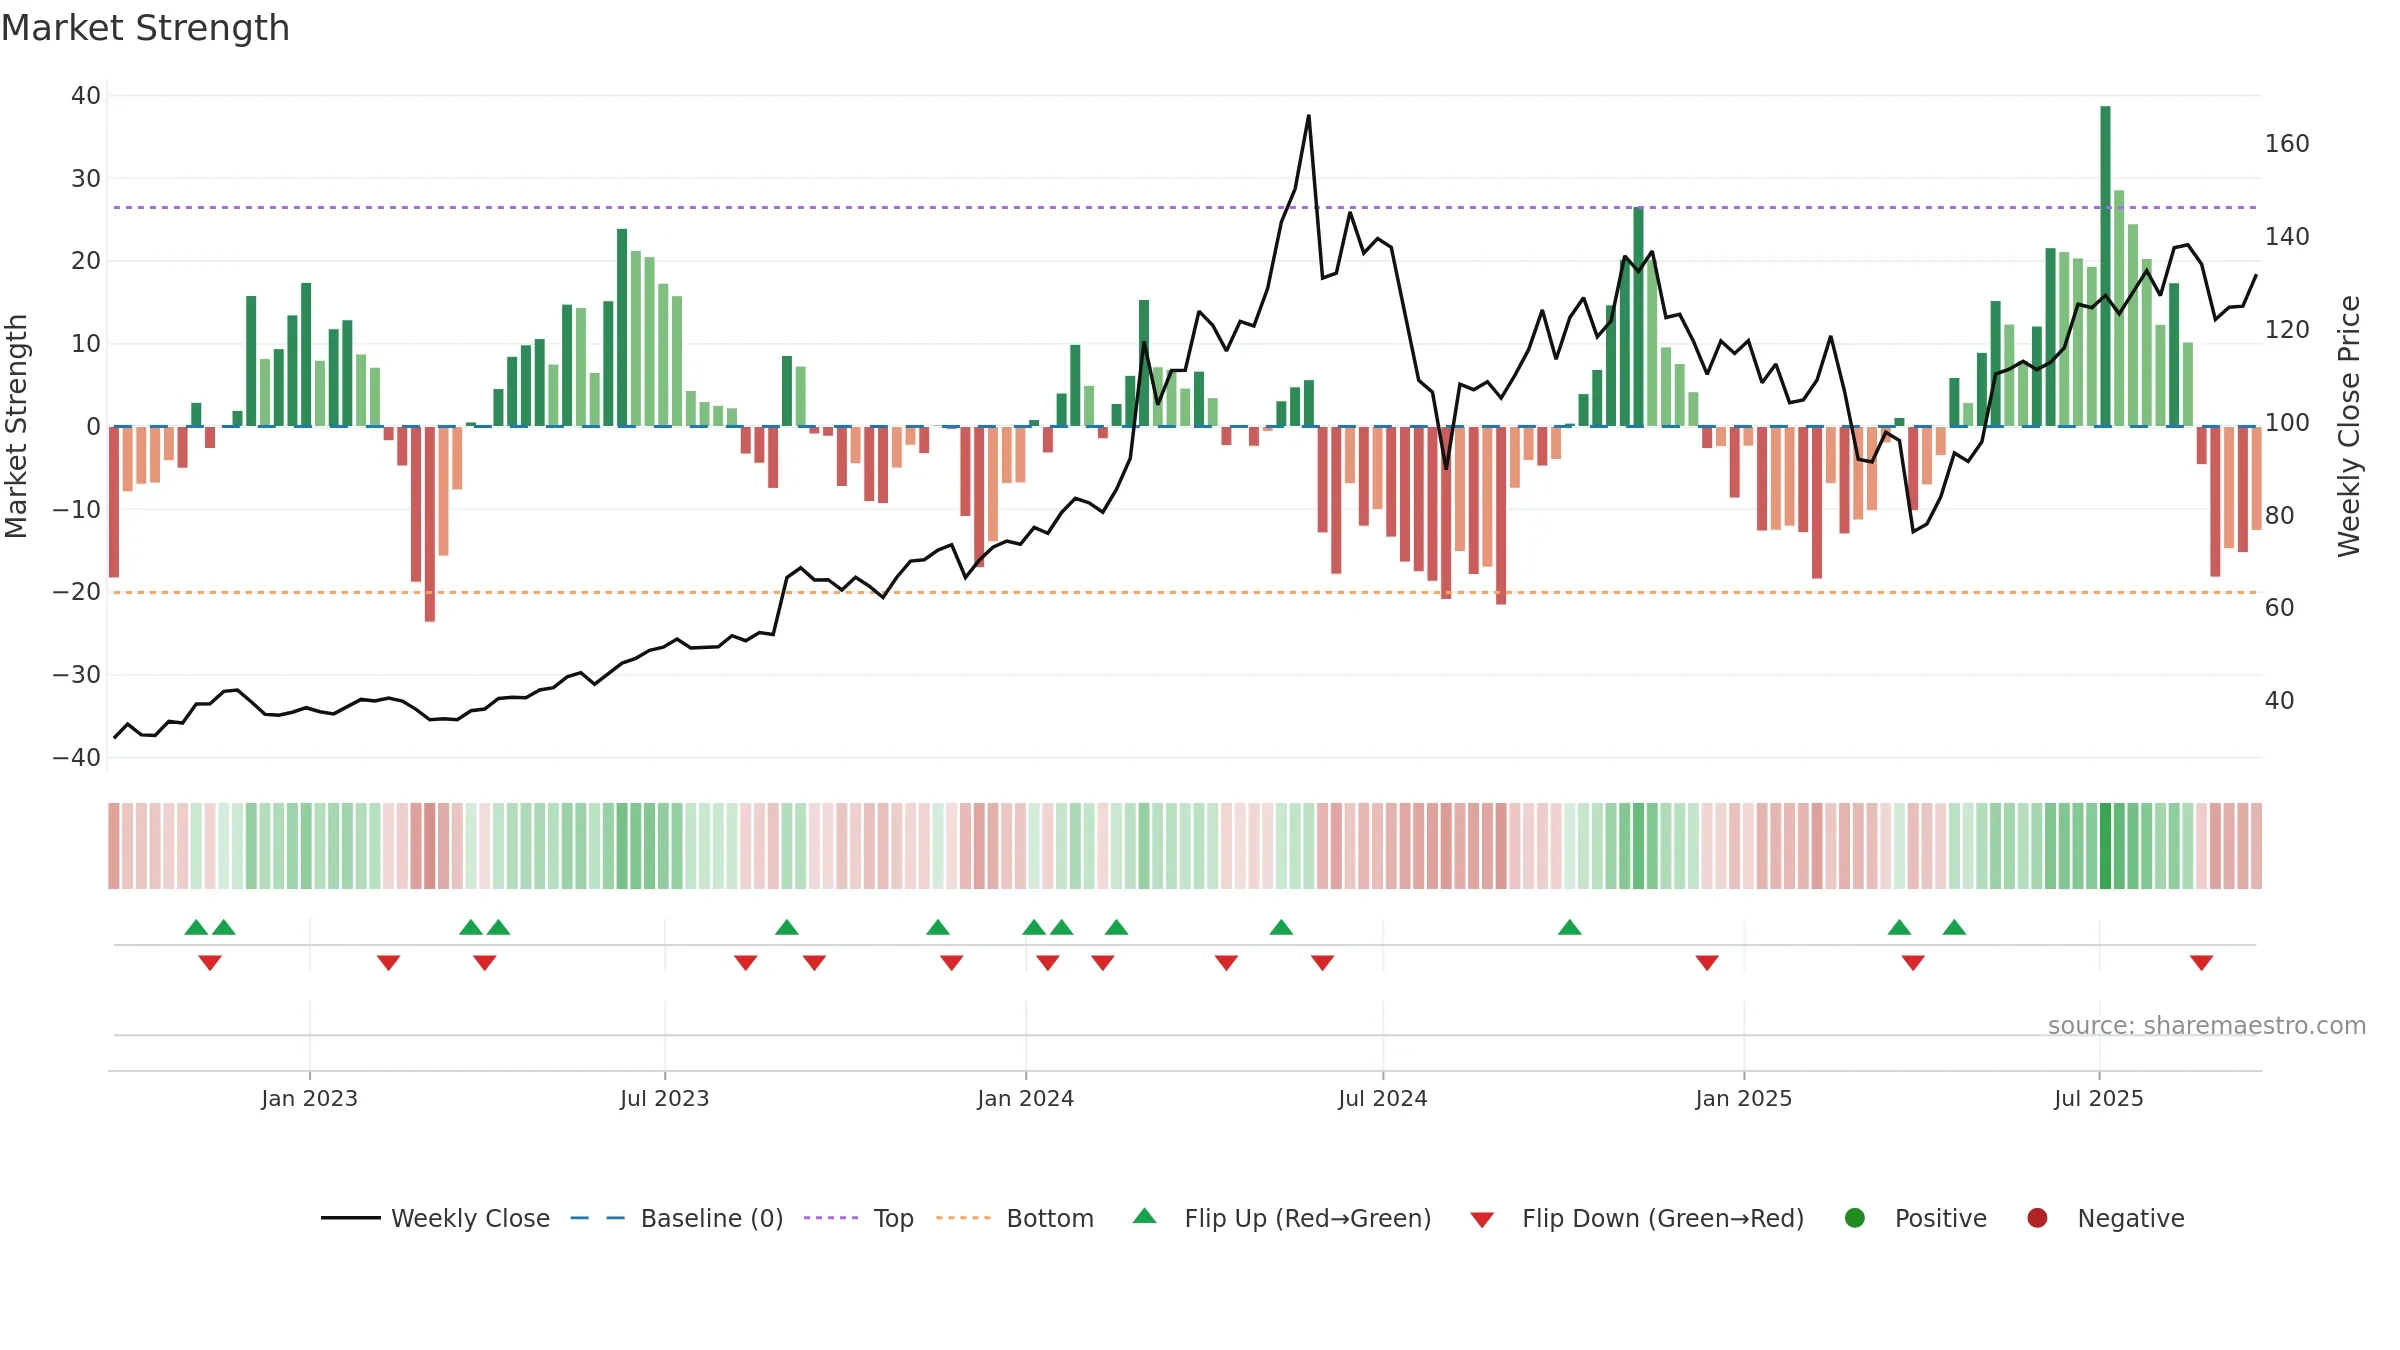
Dell Technologies Inc. closed at 131.9400 (-0.76% WoW) . Data window ends Fri, 19 Sep 2025.
How to read this — Price slope is downward, indicating persistent supply pressure. Low weekly volatility favours steadier follow-through. Volume trend diverges from price — watch for fatigue or rotation. Returns are positively correlated with volume — strength tends to arrive on higher activity. Distance to baseline is narrowing — reverting closer to its fair-value track. Price holds above key averages, indicating constructive participation.
Down-slope argues for patience; rallies can fade sooner unless participation improves. Because liquidity isn’t confirming, prefer evidence of fresh demand before chasing moves.
Gauge maps the trend signal to a 0–100 scale.
How to read this — Gauge is elevated but momentum is rolling over; topping risk is rising.
Stay alert: protect gains or seek confirmation before adding risk.

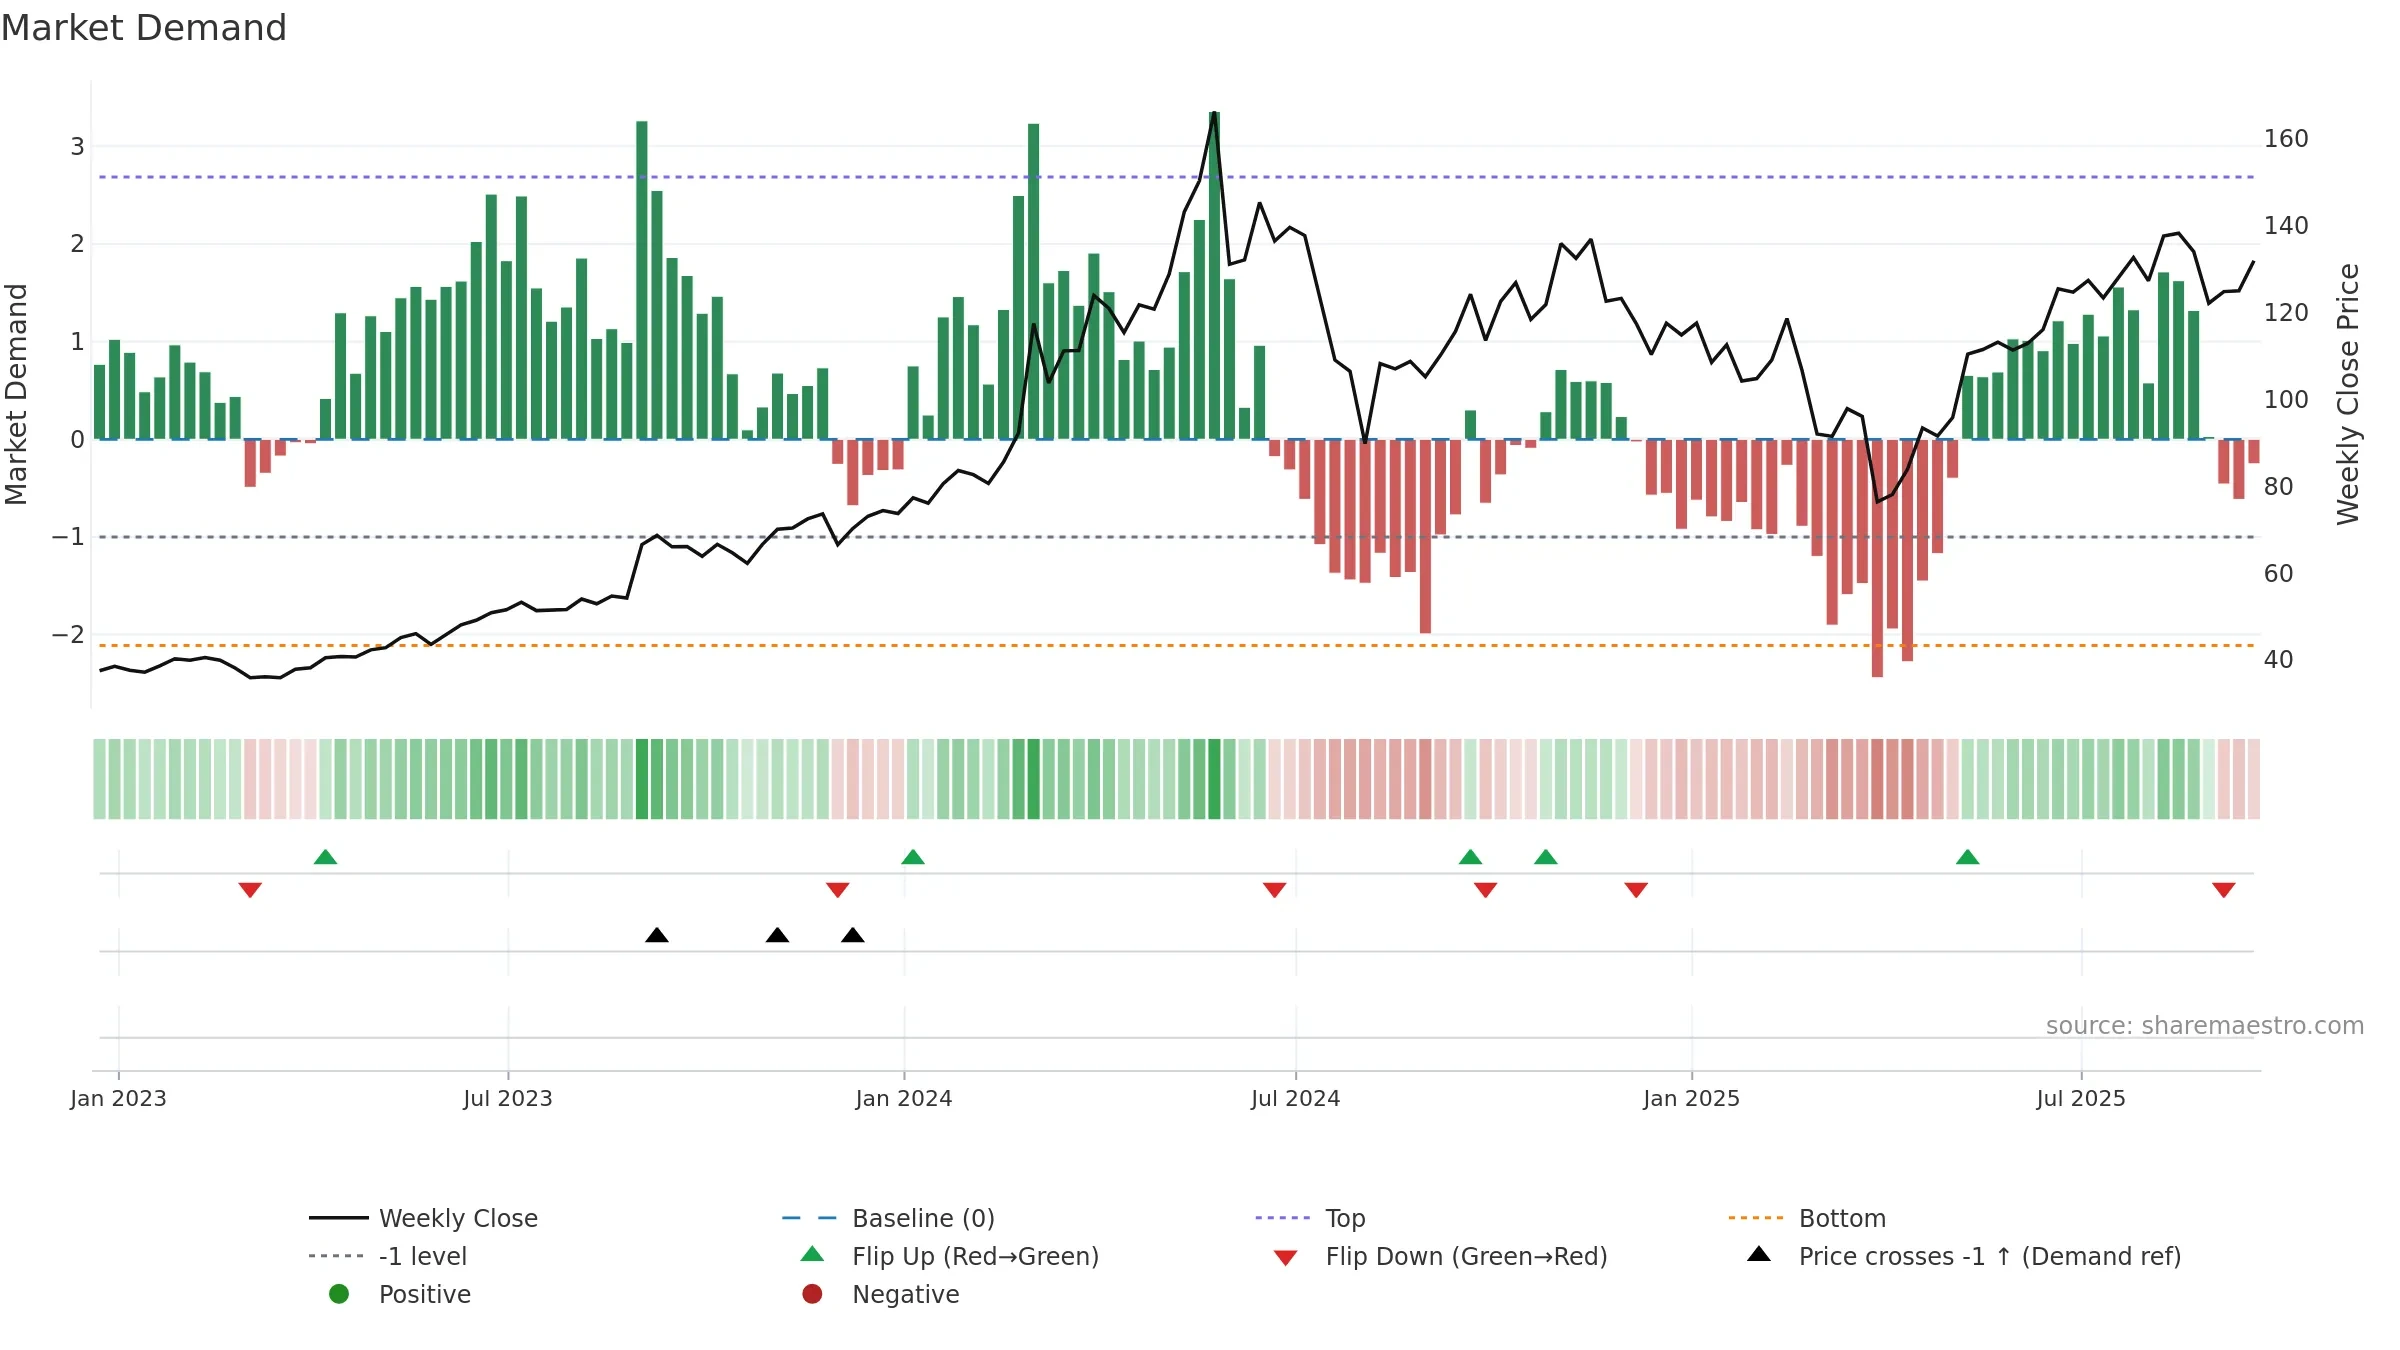
Relative strength is Positive
(> 0%, outperforming).
Latest MRS: 7.15% (week ending Fri, 19 Sep 2025).
Slope: Falling over 8w.
Notes:
- Holding above the zero line indicates relative bid.
- MRS slope falling over ~8 weeks.
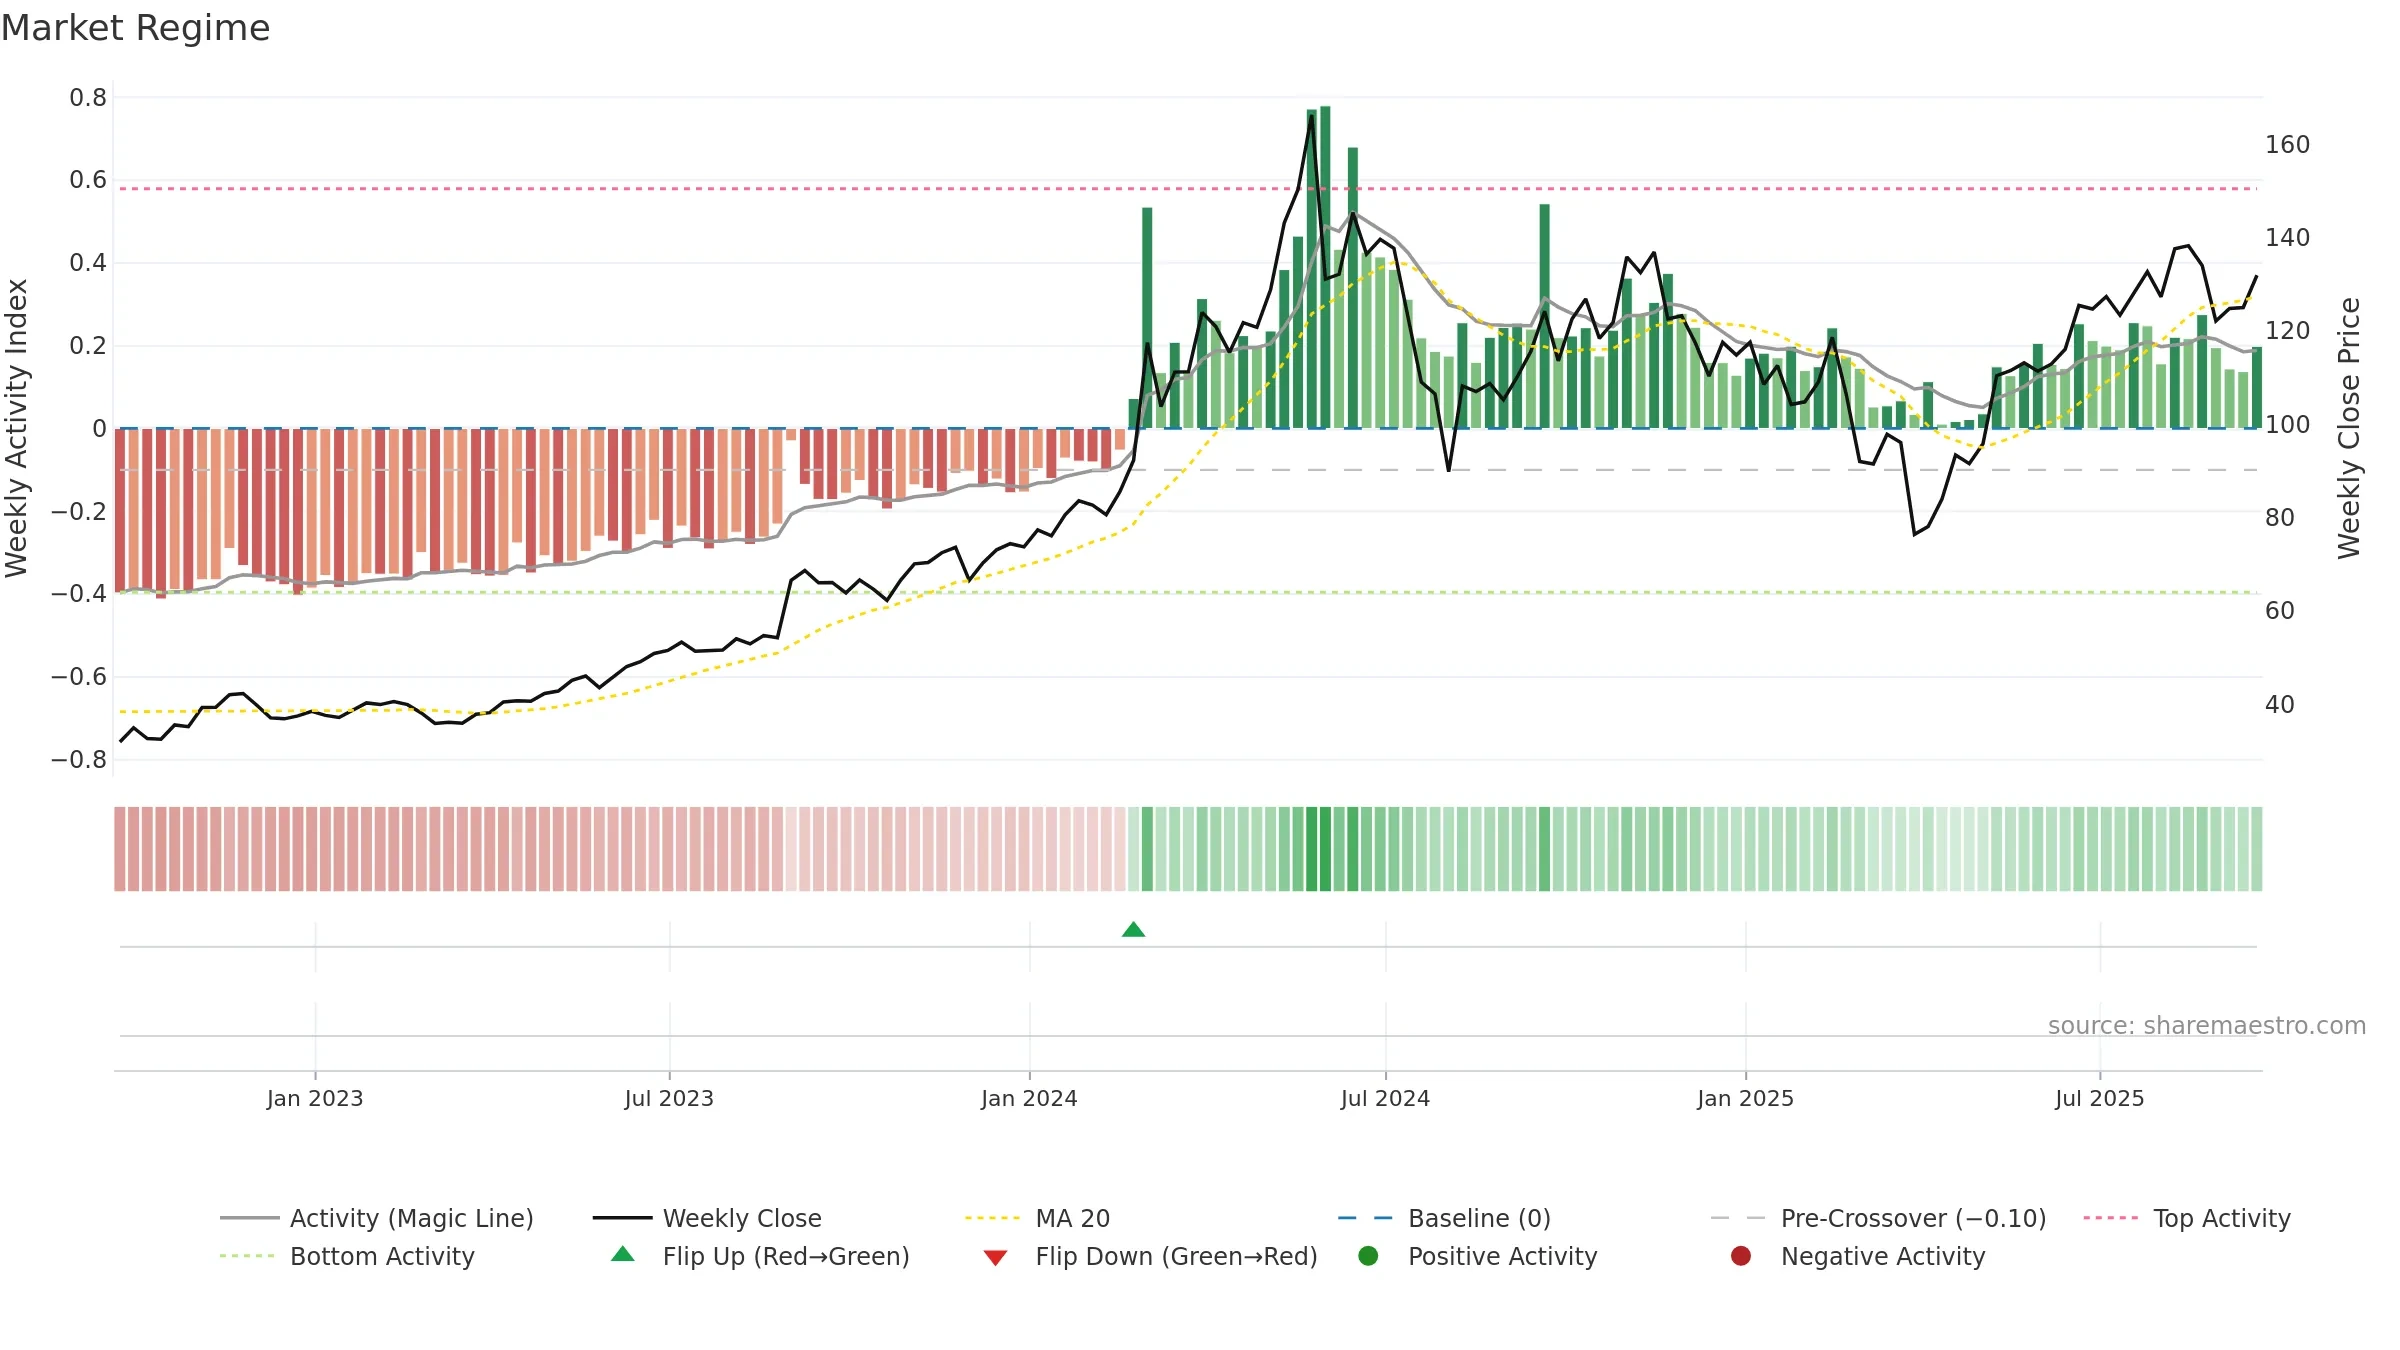
Conclusion
Neutral setup. ★★★⯪☆ confidence. Trend: Uptrend at Risk · 3.63% over window · vol 1.95% · liquidity divergence · posture above · RS outperforming · leaning positive
- Momentum is bullish and rising
- Price holds above 8–26 week averages
- Low return volatility supports durability
- Mansfield RS: outperforming & rising
- High level but momentum rolling over (topping risk)
- Liquidity diverges from price
Why: Price window 3.63% over w. Close is -4.58% below the prior-window high. Return volatility 1.95%. Volume trend rising. Liquidity divergence with price. Trend state uptrend at risk. Momentum bullish and rising.
Tip: Most metrics include a hover tooltip where they appear in the report.