Abacus Global Management, Inc.
ABL NASDAQ
Weekly Report
Abacus Global Management, Inc. closed at 6.2300 (-3.26% WoW) . Data window ends Fri, 19 Sep 2025.
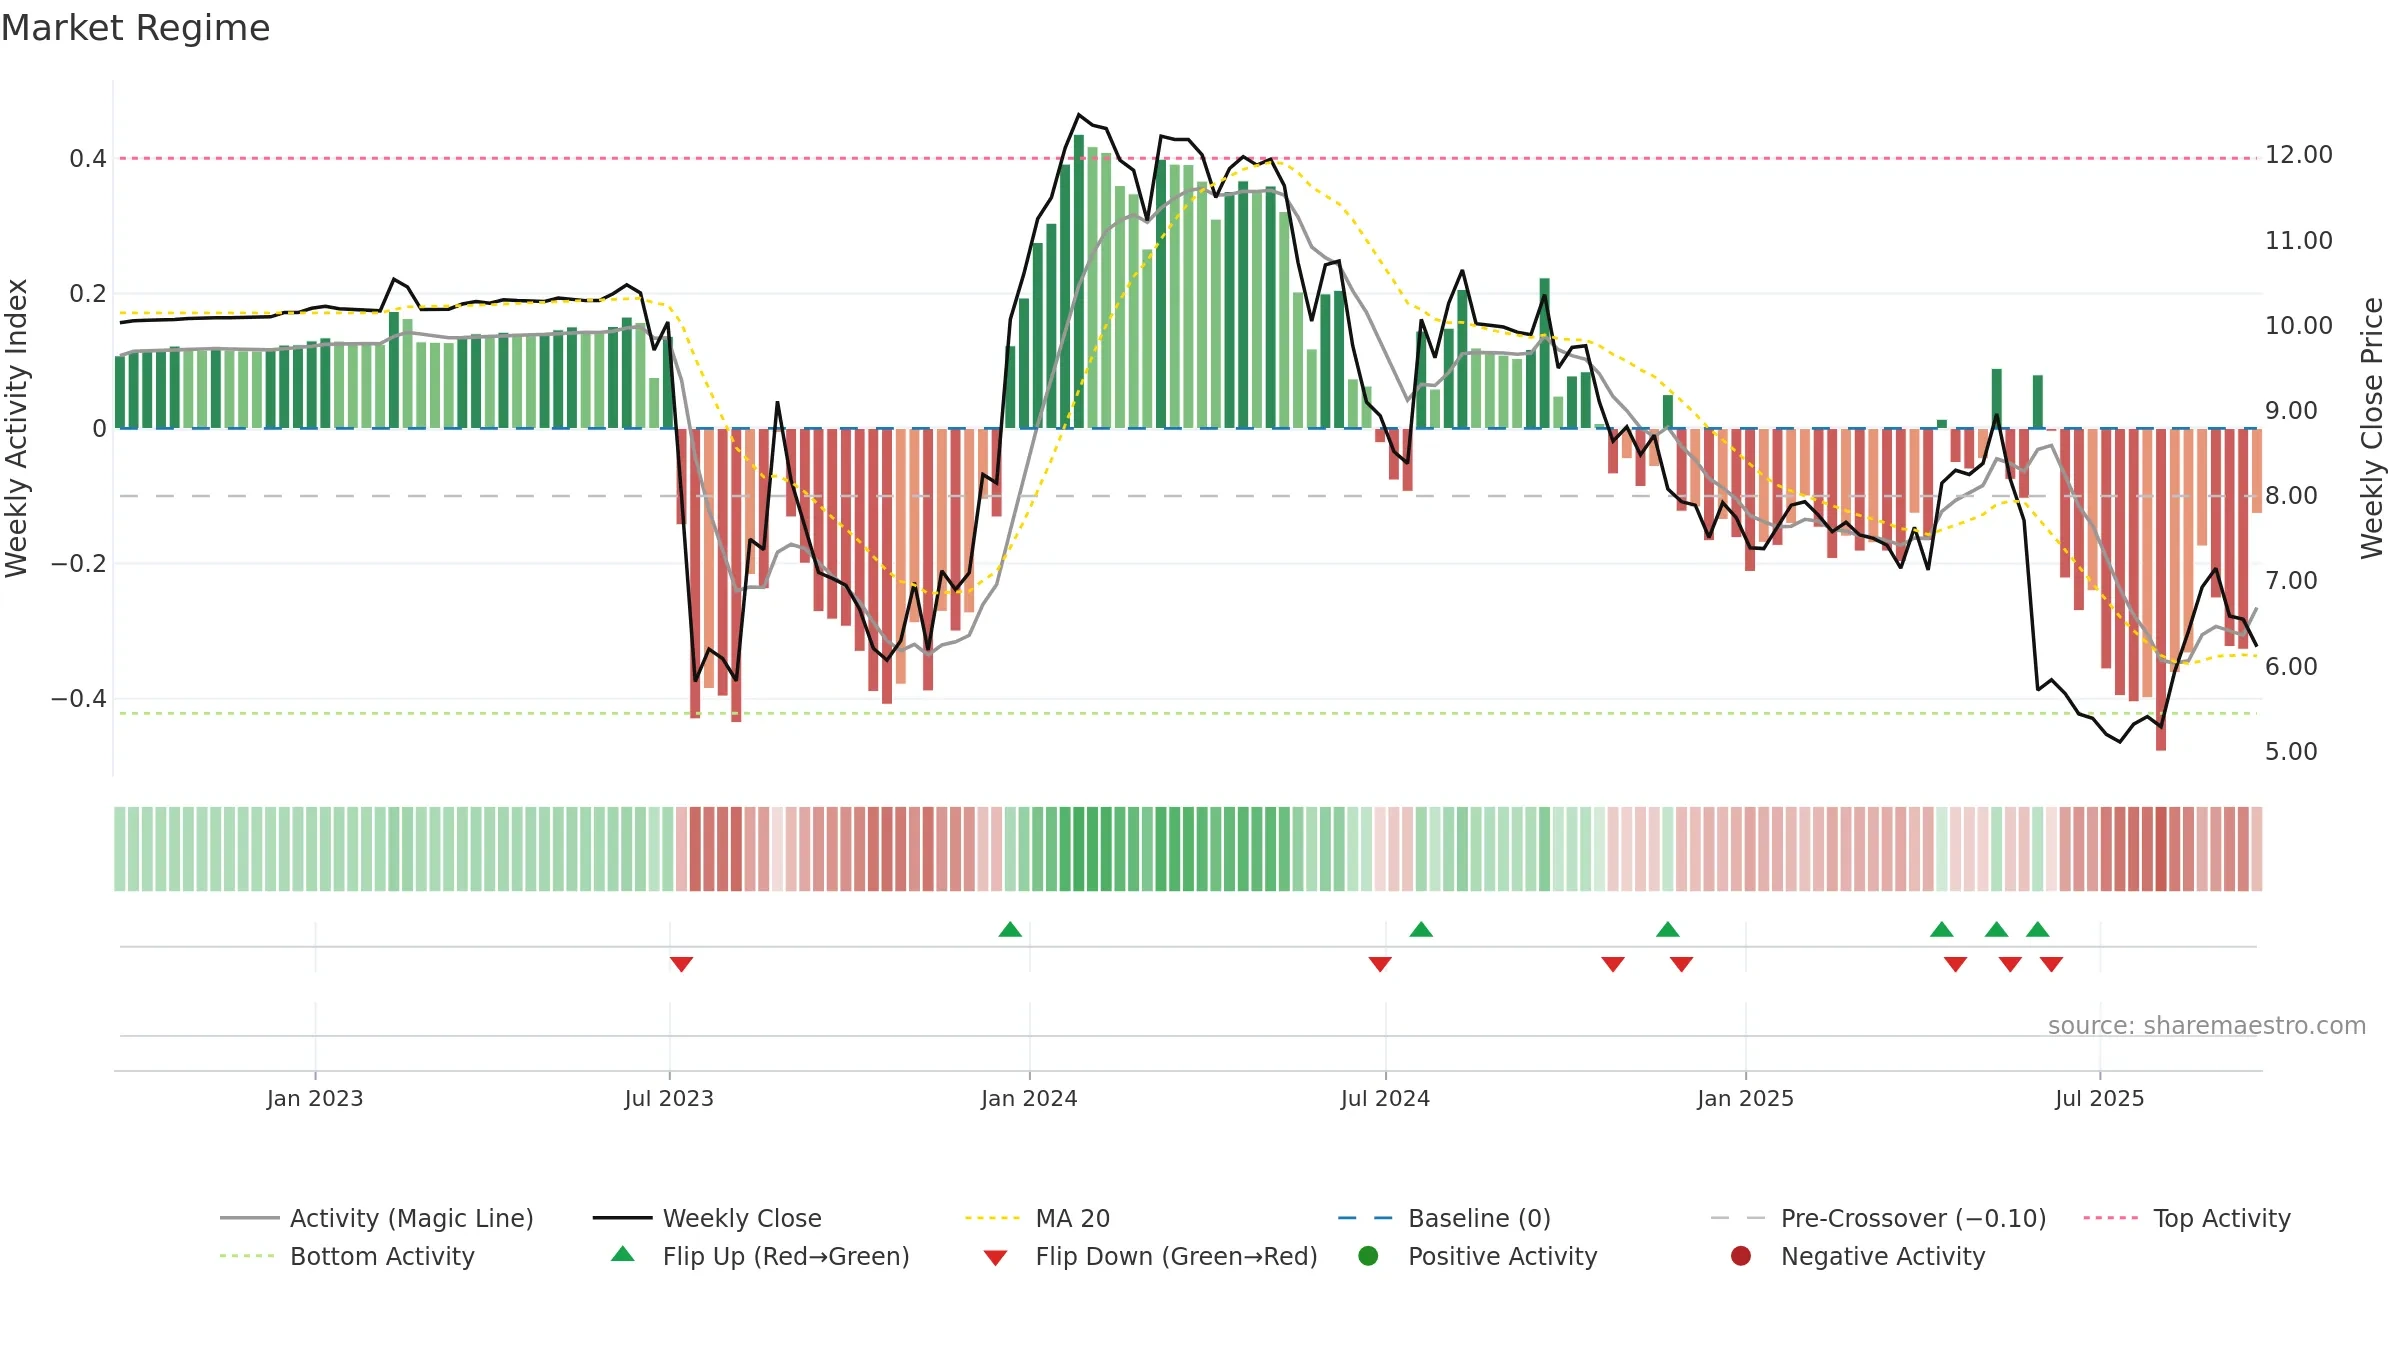
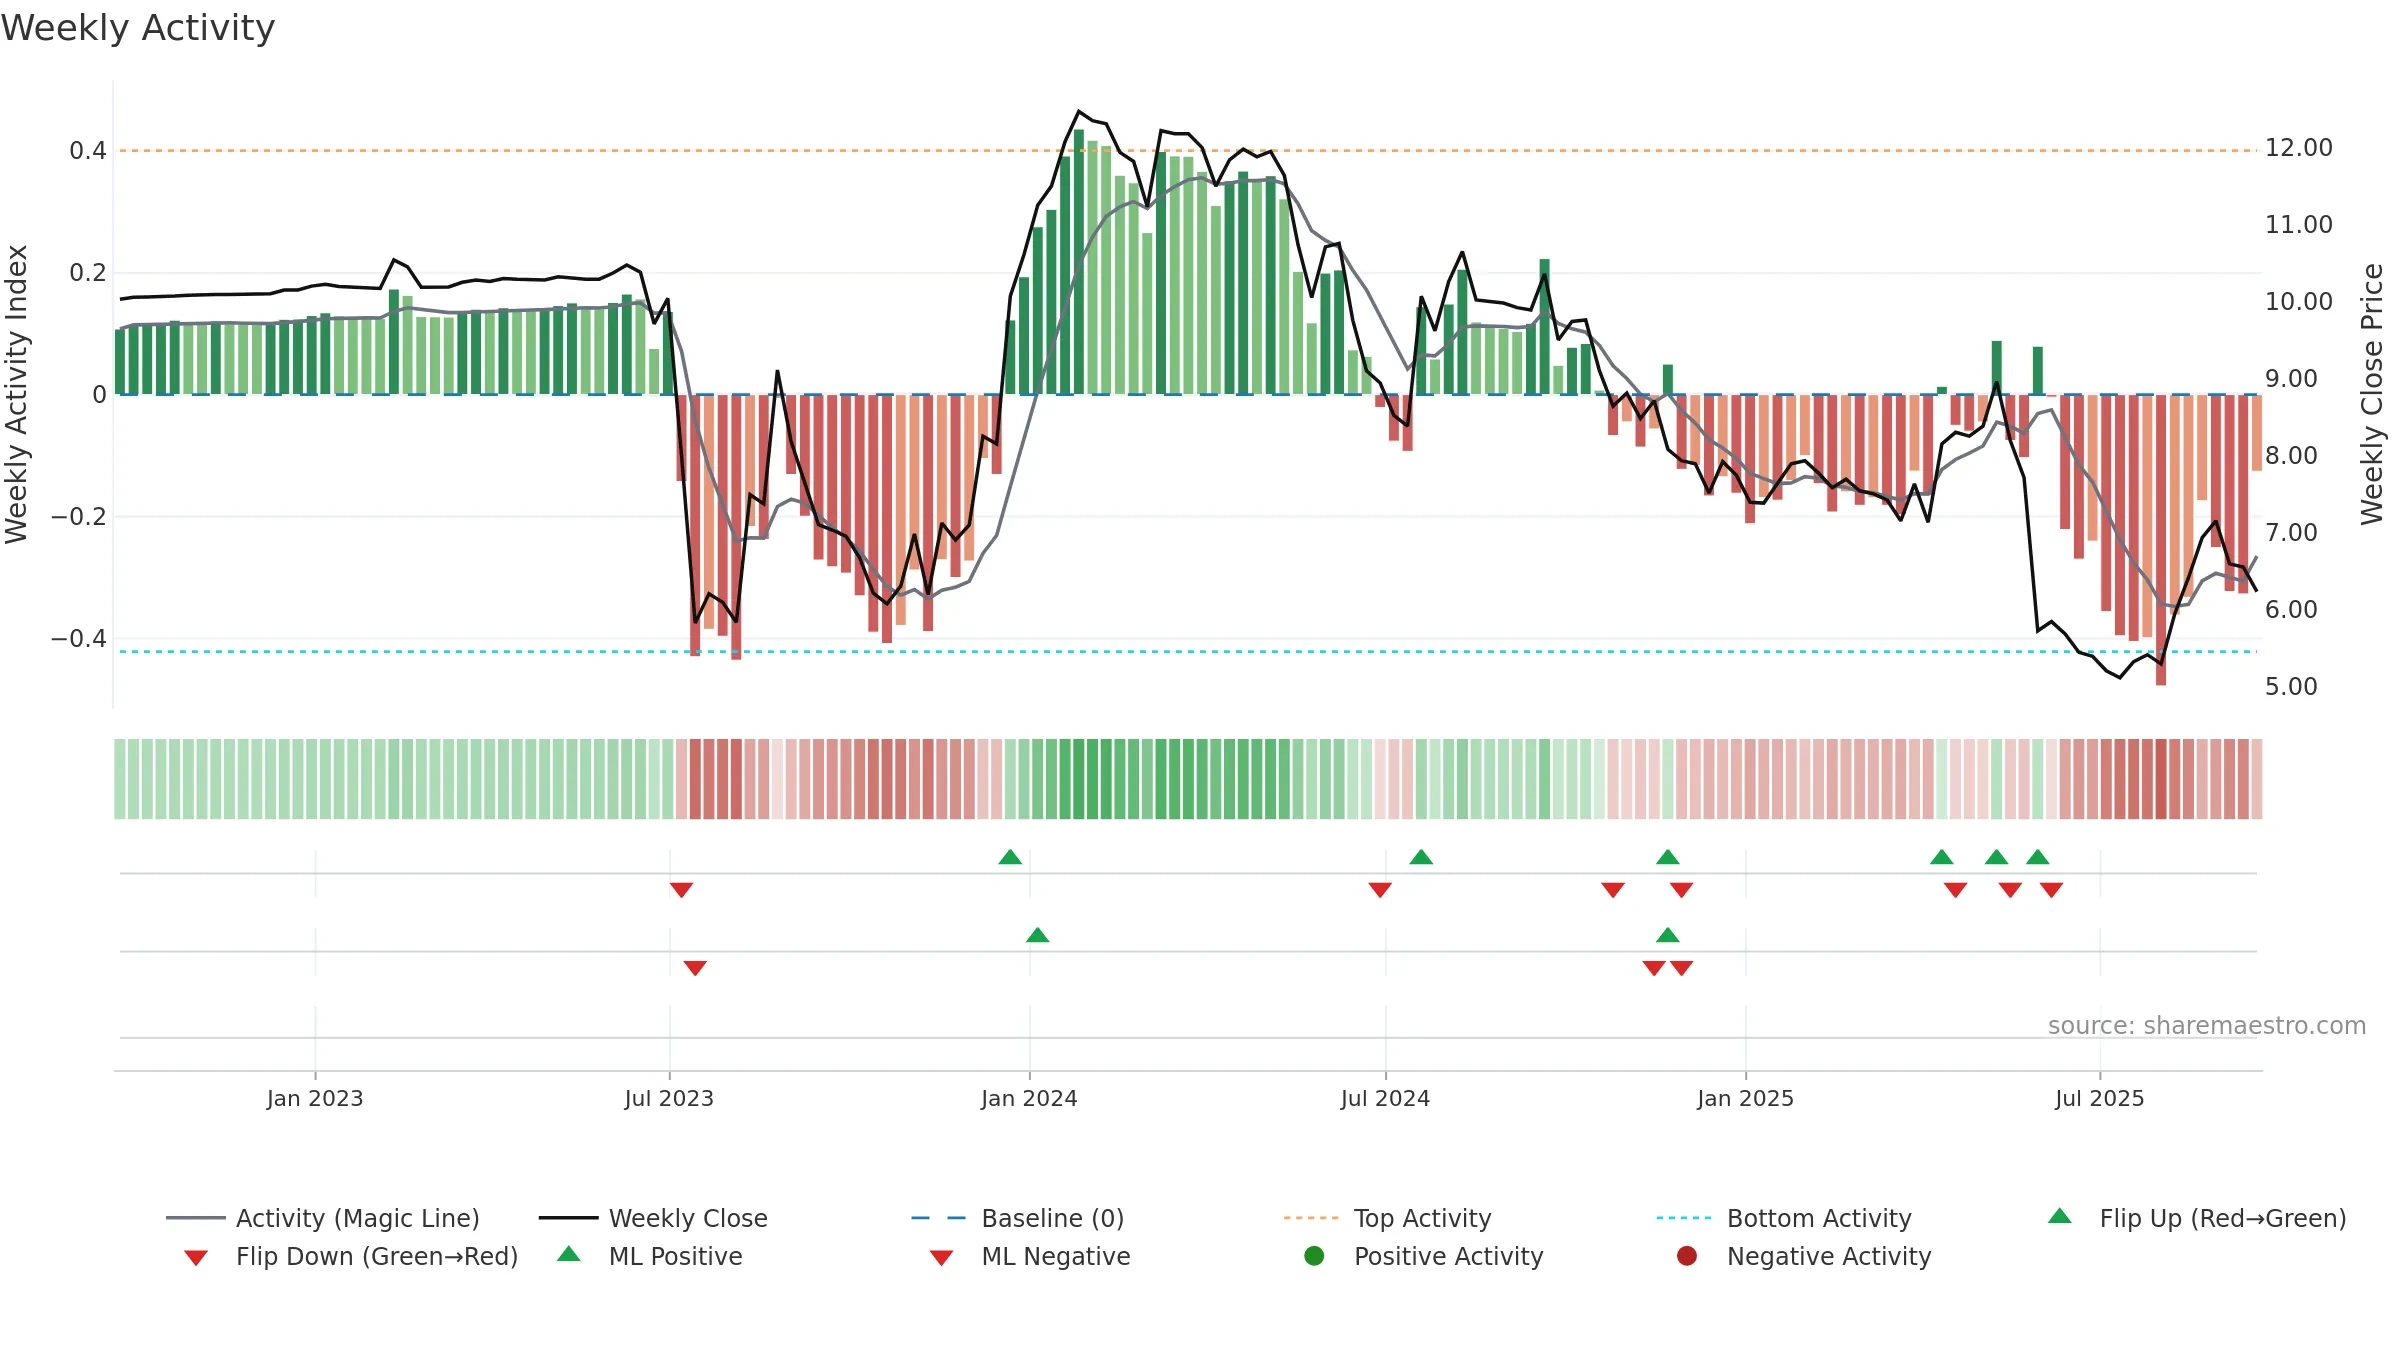
How to read this — Price slope is upward, indicating persistent buying over the window. Volume and price are moving in the same direction — a constructive confirmation. Price sits below key averages, keeping pressure on the tape.
Up-slope supports buying interest; pullbacks may be contained if activity stays firm.
Gauge maps the trend signal to a 0–100 scale.
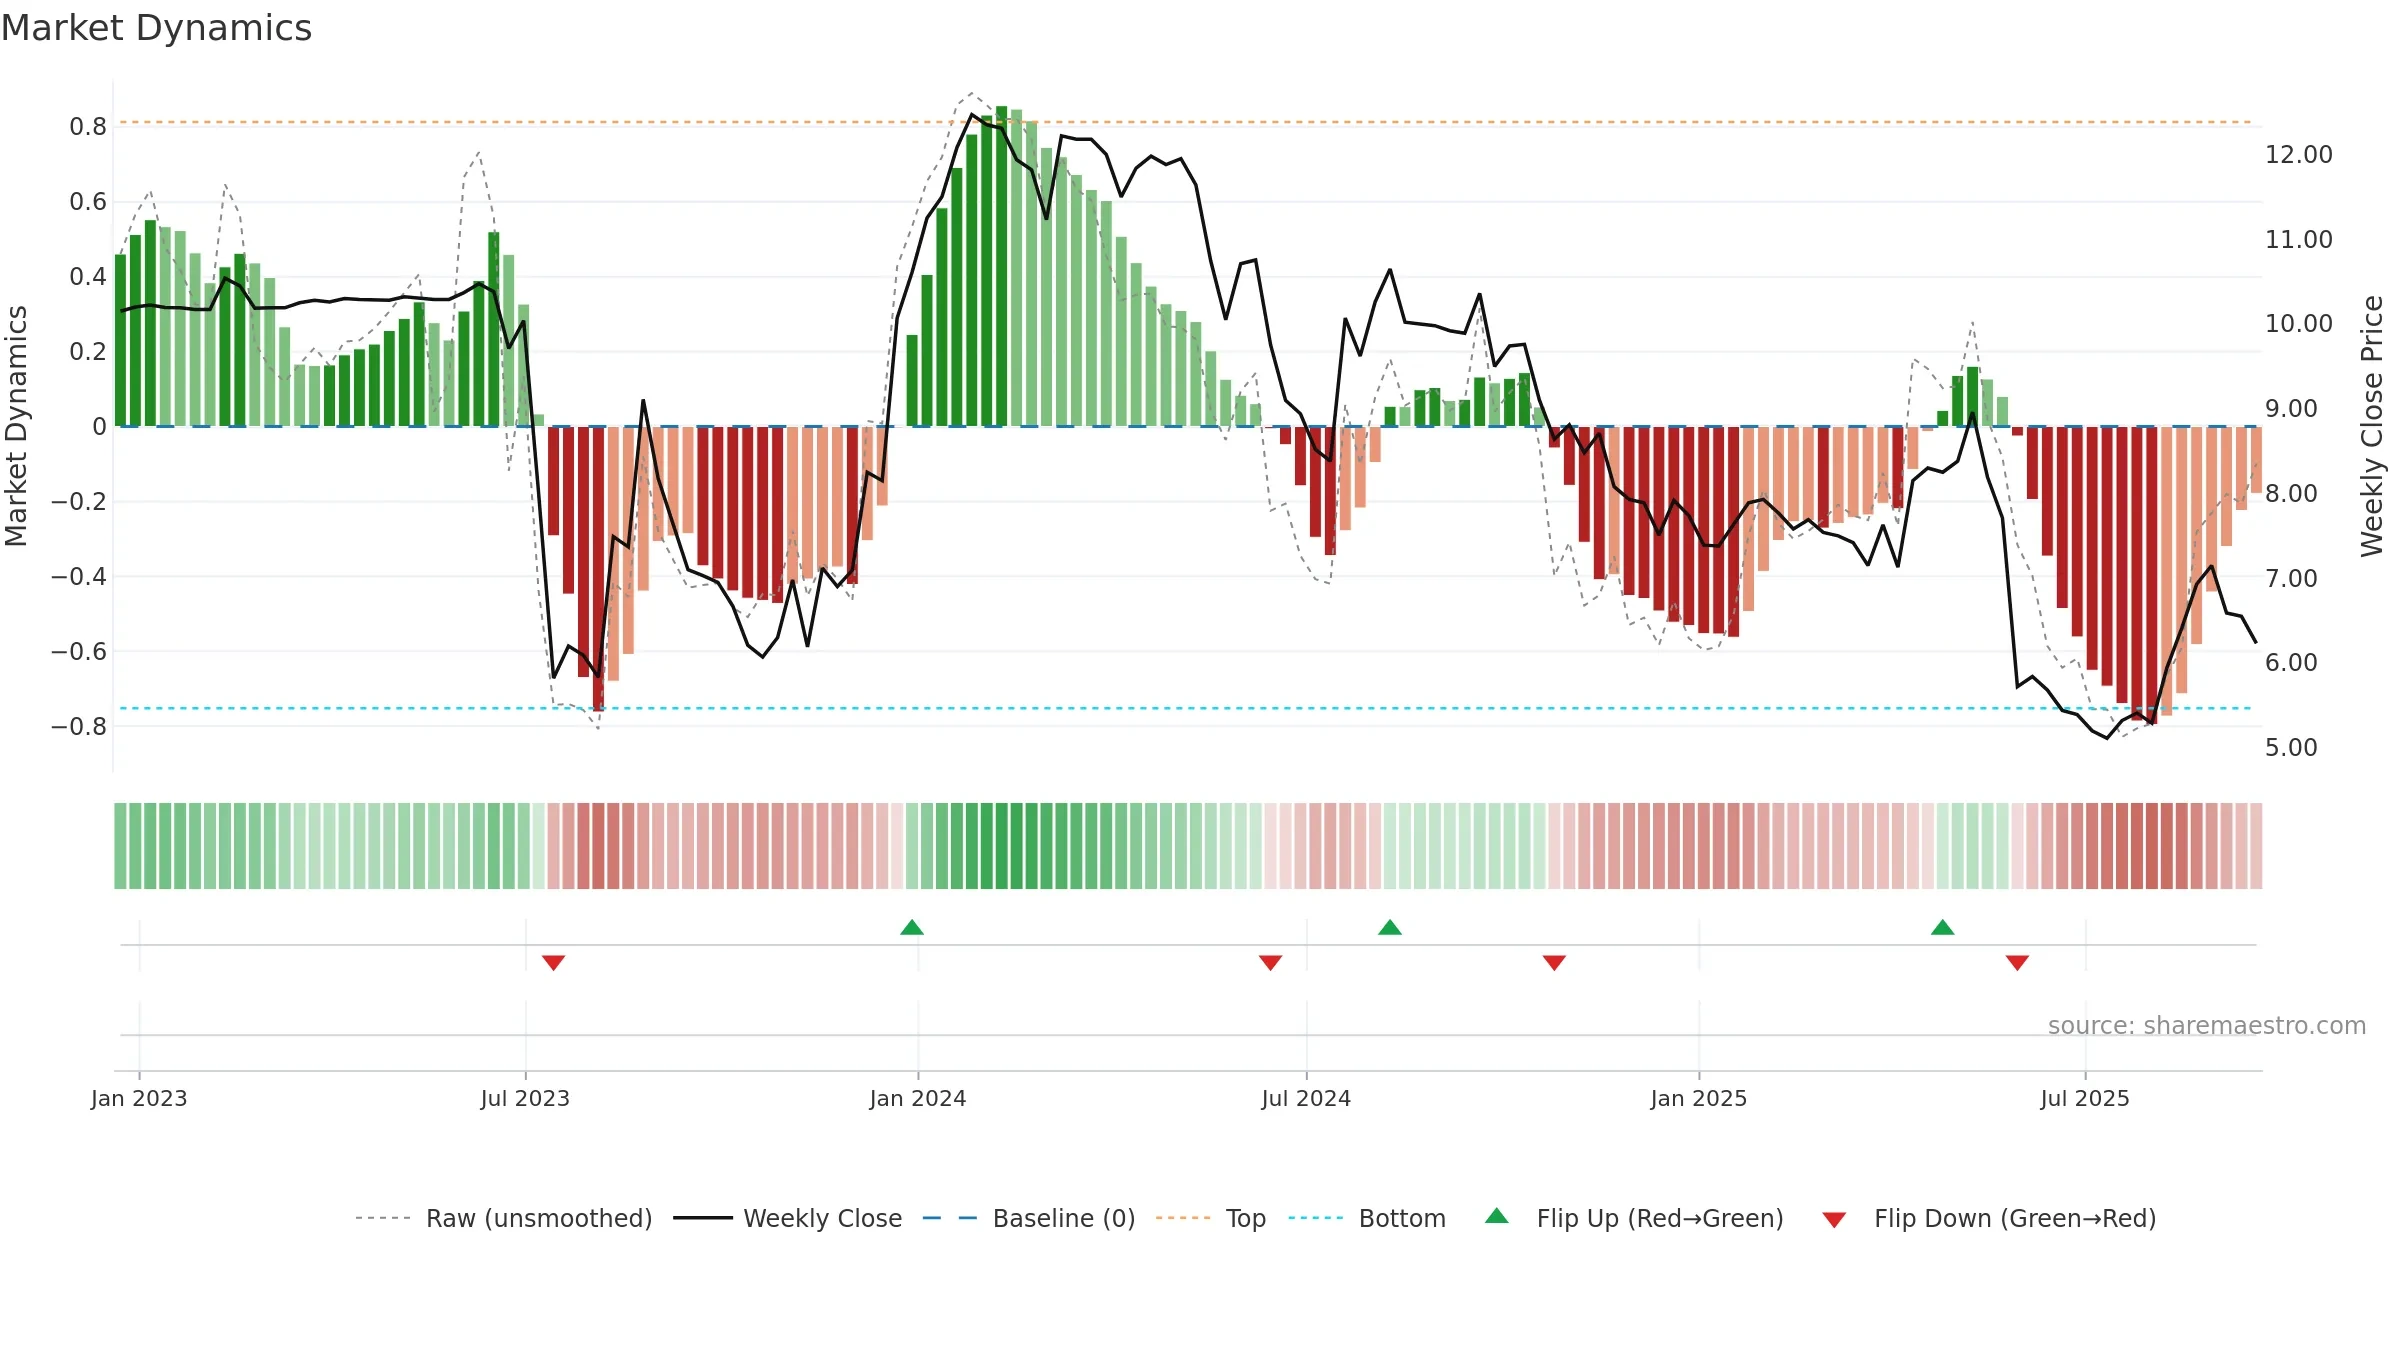
How to read this — Bearish backdrop but short-term momentum is improving; confirmation still needed.
Early improvement — look for a reclaim of 0.50→0.60 to validate.
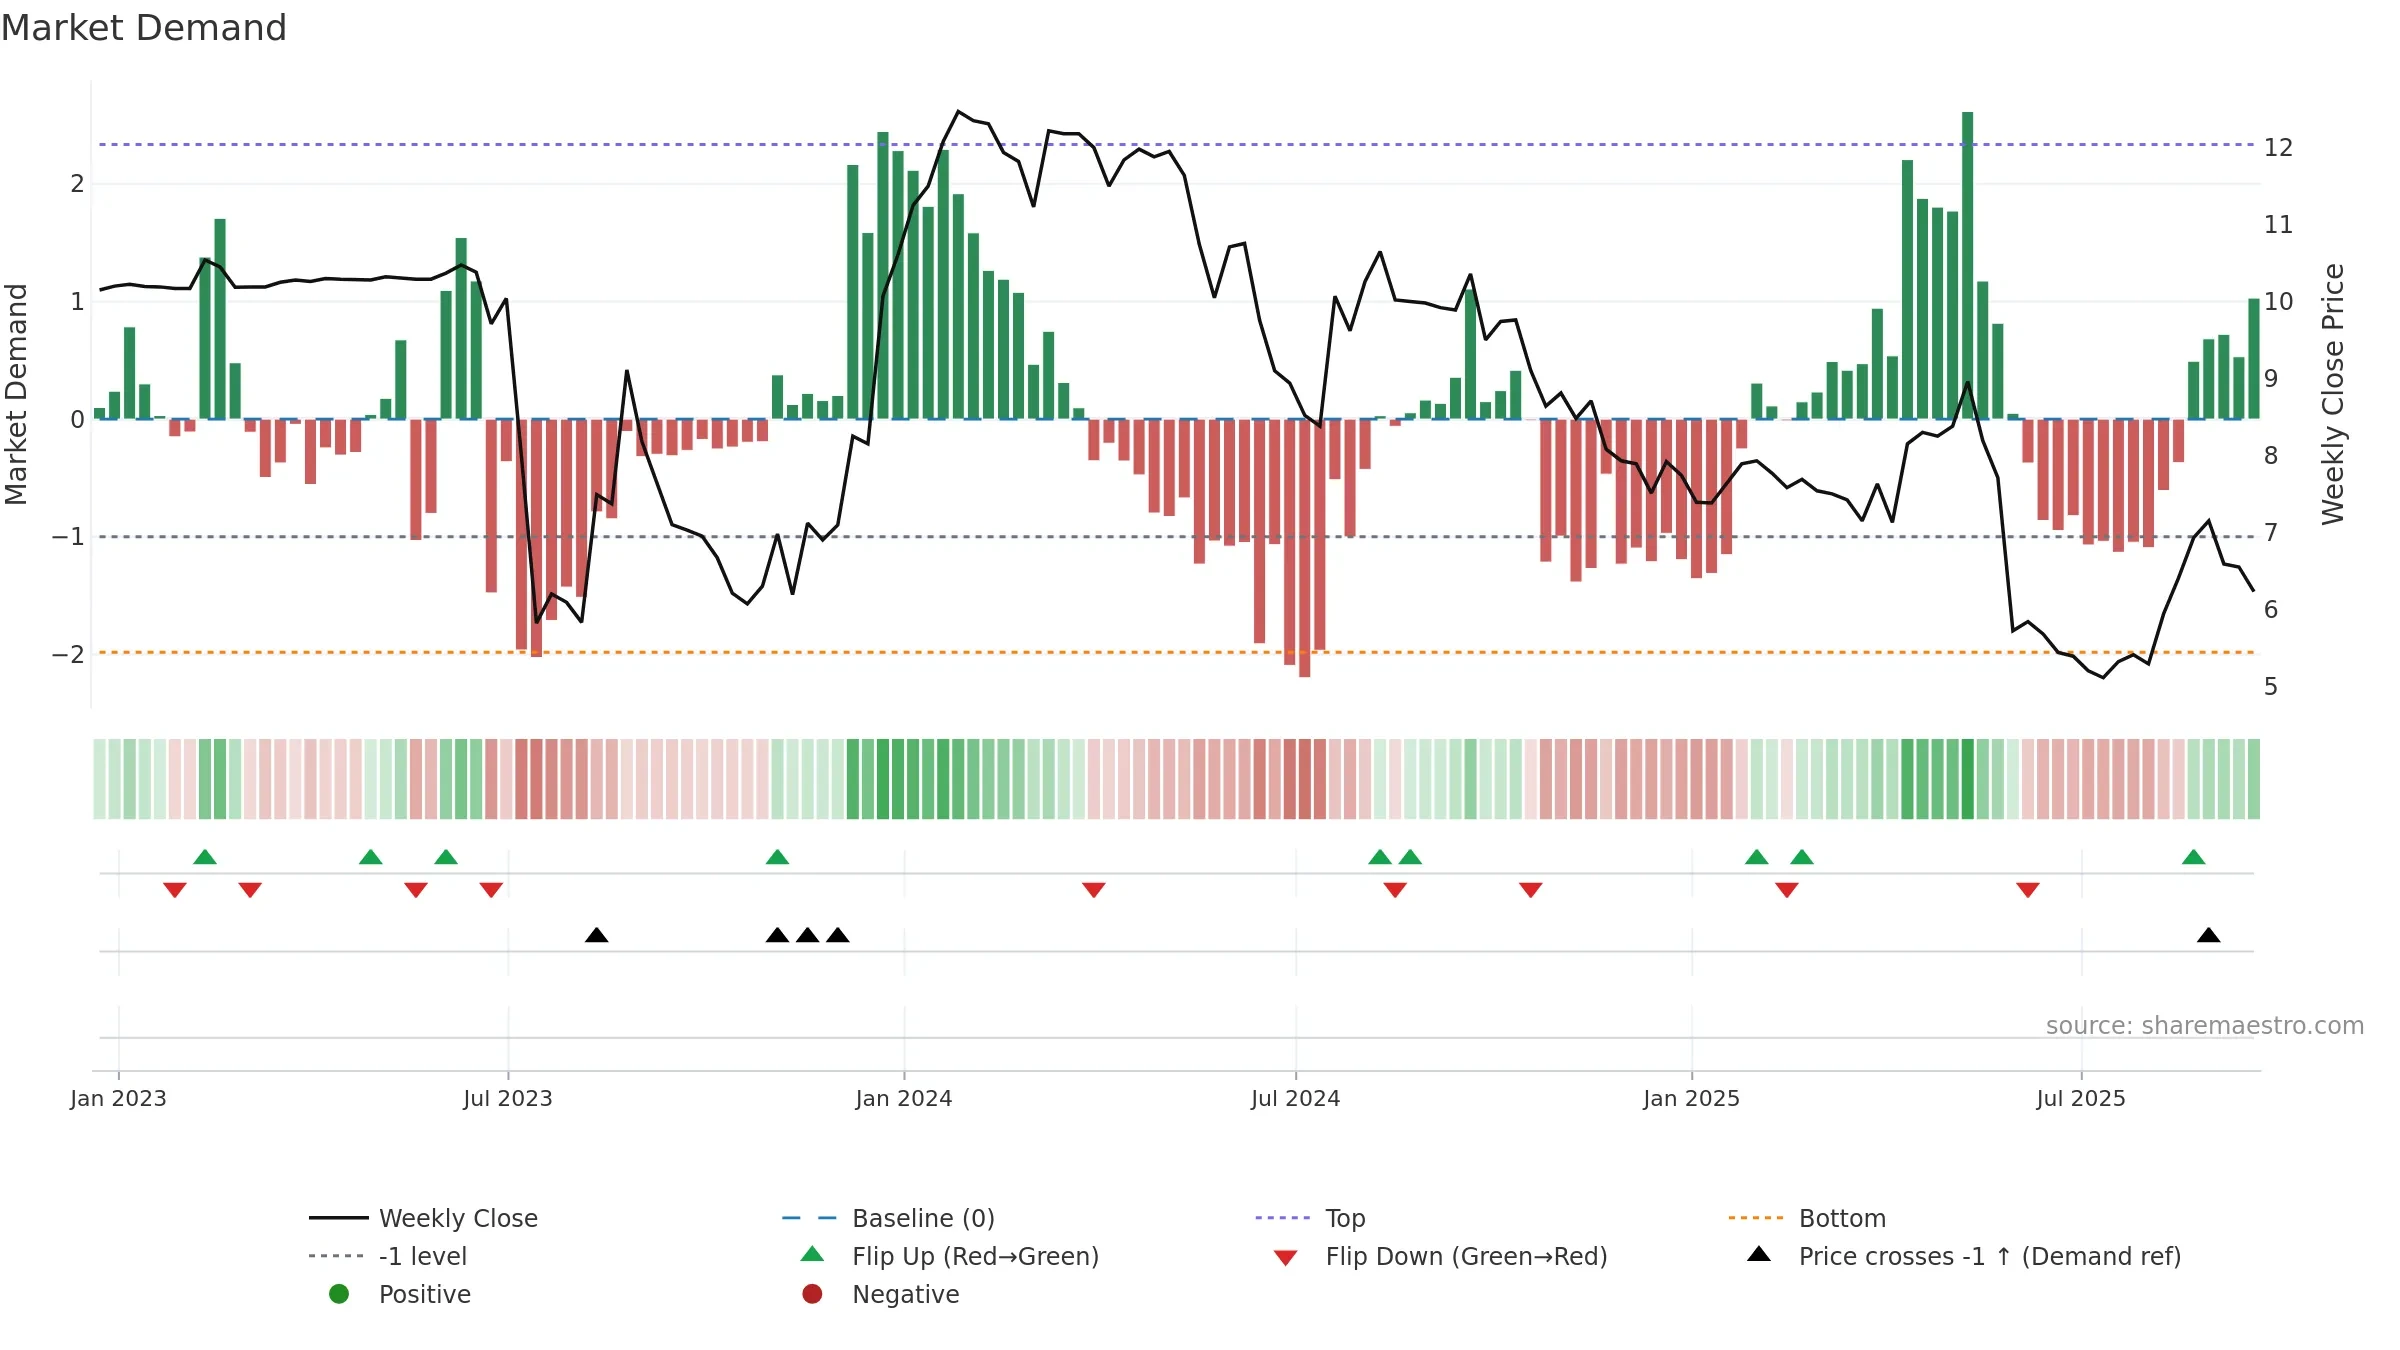
The flag is positive: favourable upside skew with supportive conditions.
Conclusion
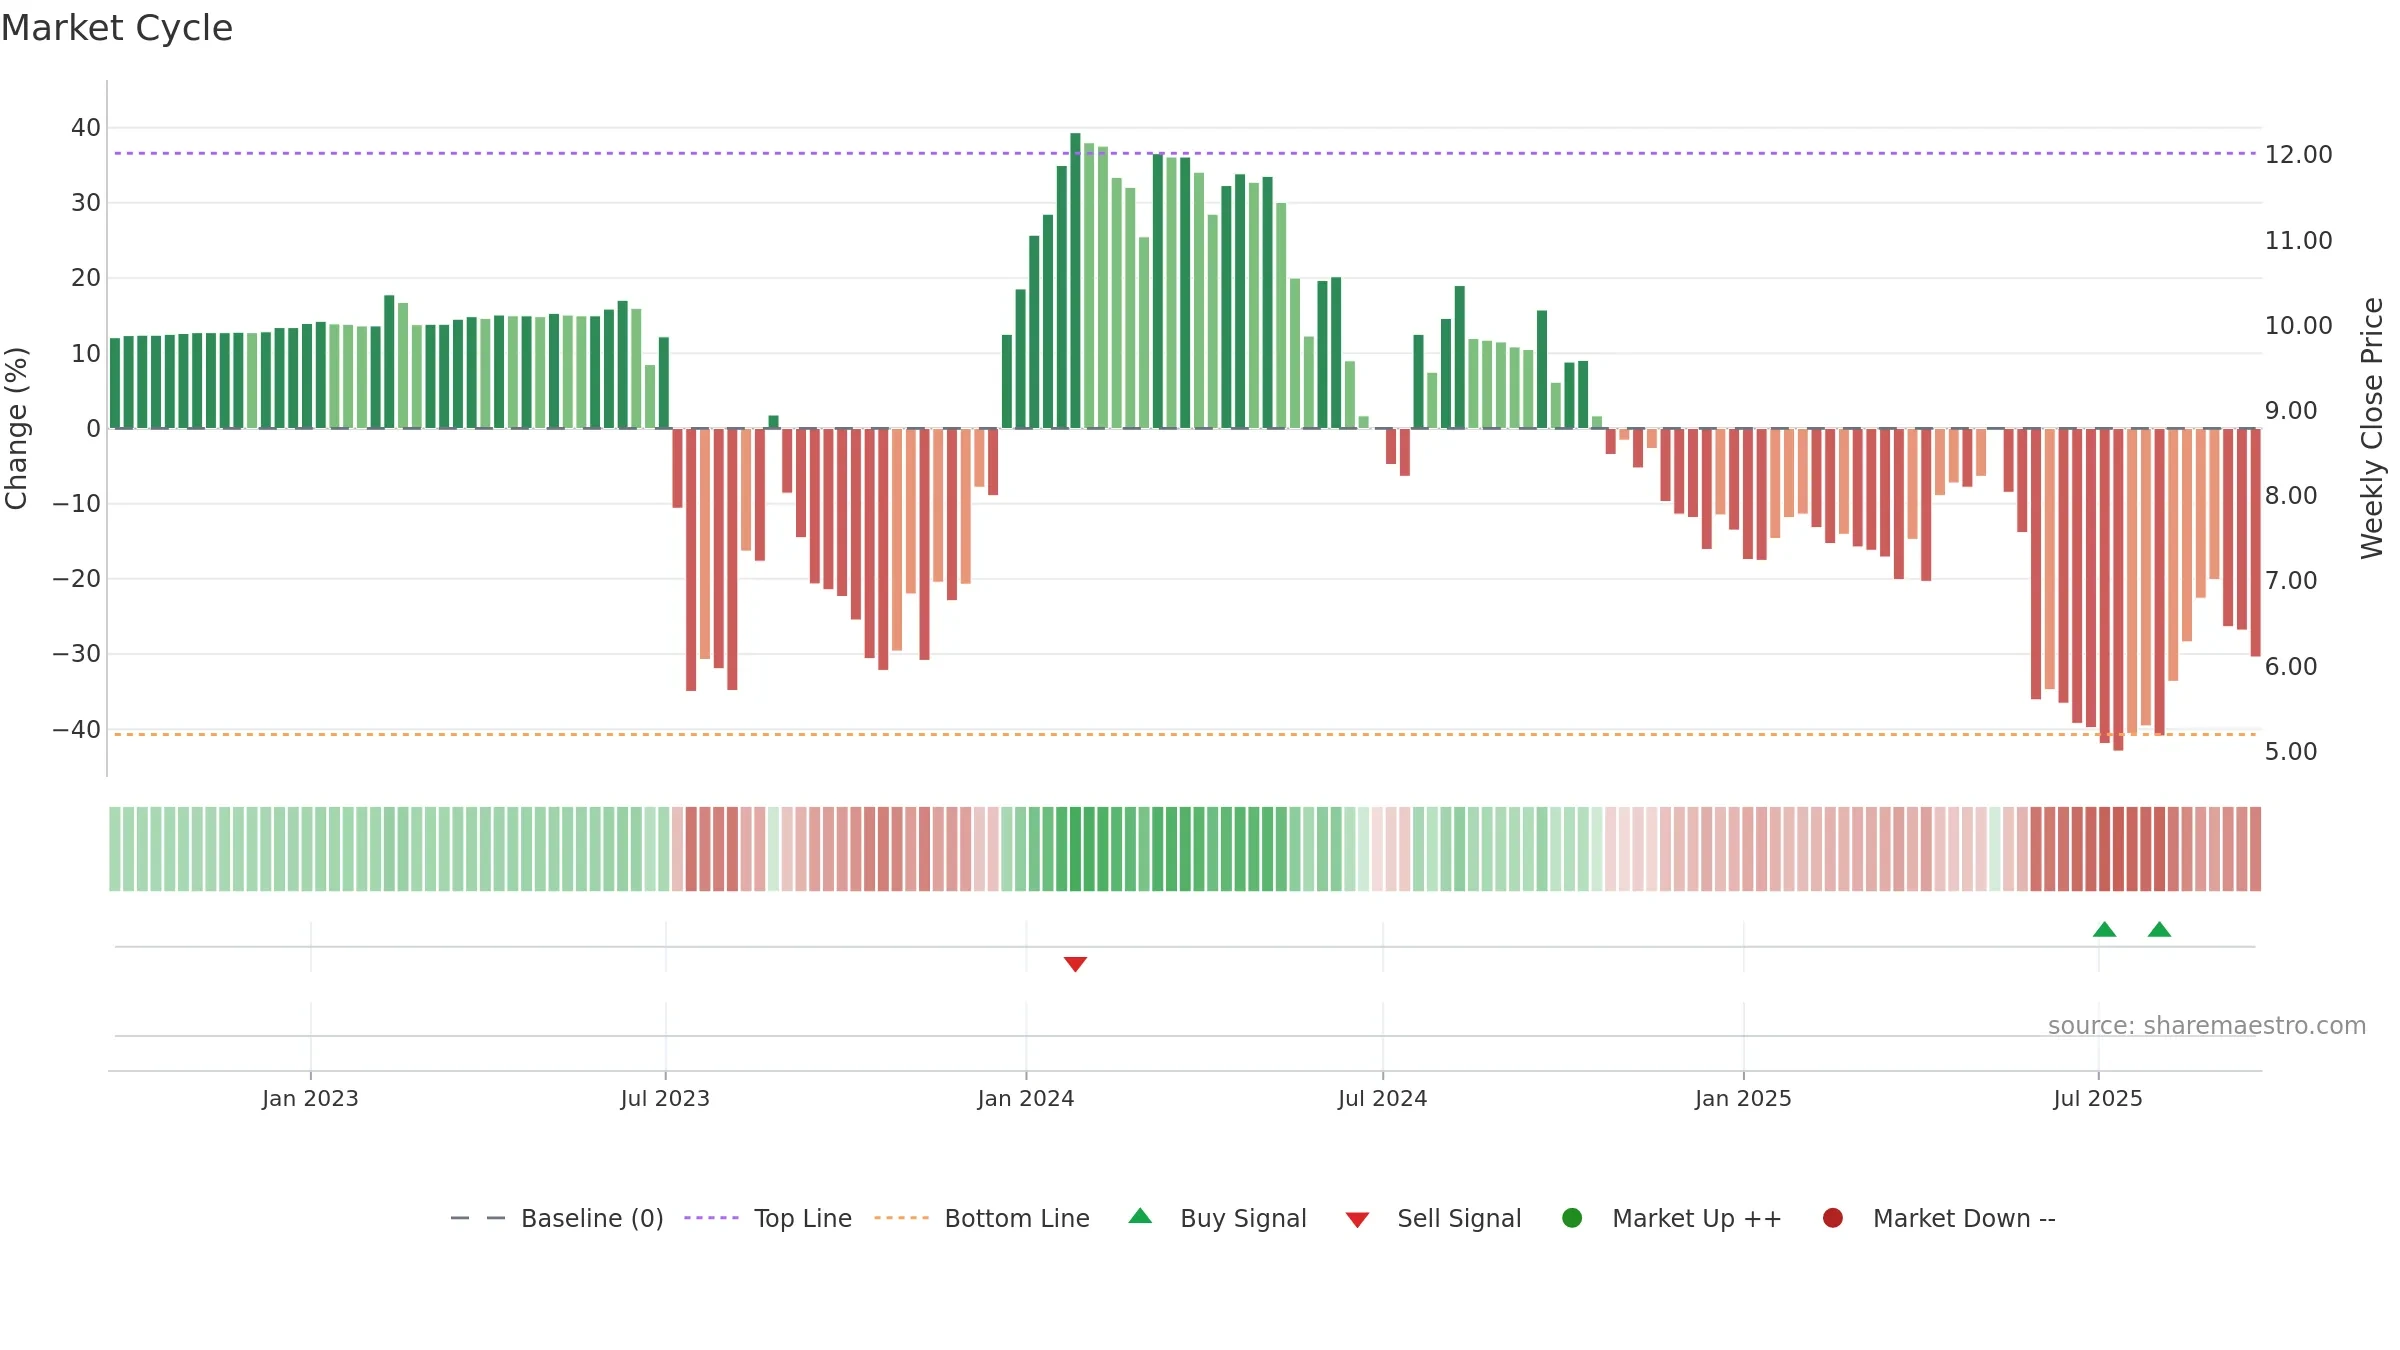
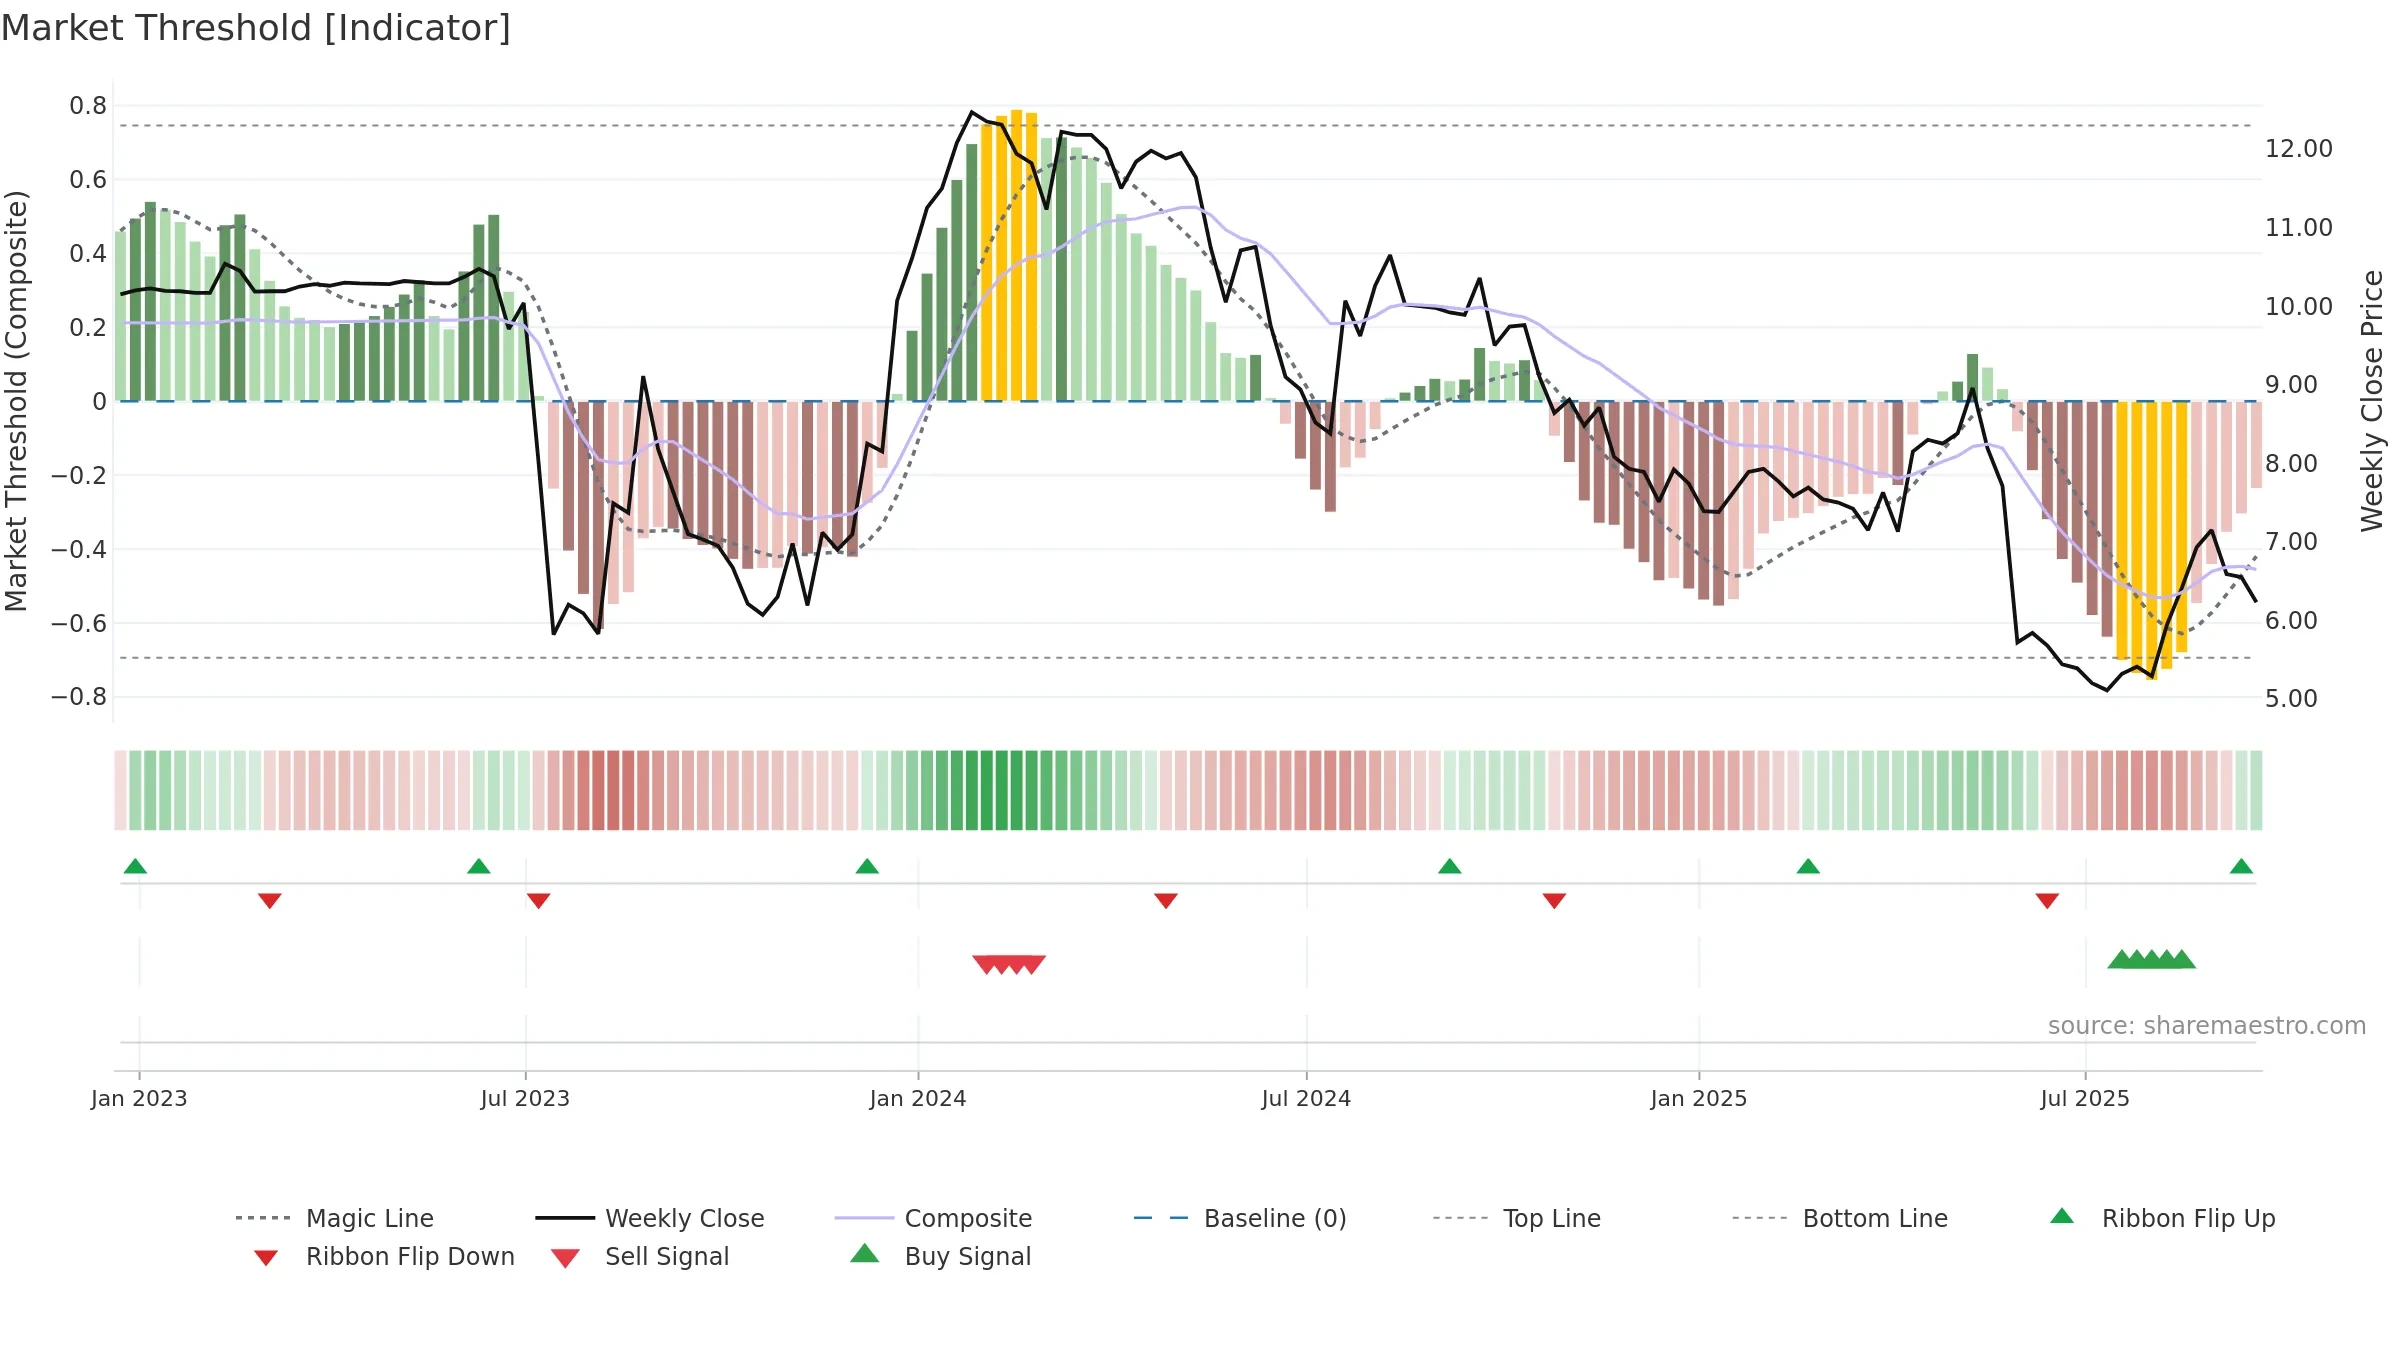
Positive setup. ★★★★☆ confidence. Price window: 17. Trend: Bottoming Attempt; gauge 14. In combination, liquidity confirms the move.
- Early improvement from bearish zone (bottoming attempt)
- Liquidity confirms the price trend
- Solid multi-week performance
- Buyers step in at depressed levels (accumulation)
- Price is not above key averages
Why: Price window 17.77% over 8w. Close is -12.87% below the prior-window high. Volume trend rising. Liquidity convergence with price. Trend state bottoming attempt. Low-regime (≤0.25) upticks 5/7 (71.0%) • Accumulating. Momentum neutral and rising. Valuation stance positive.
Tip: Most metrics include a hover tooltip where they appear in the report.