Sivers Semiconductors AB (publ)
SIVE STO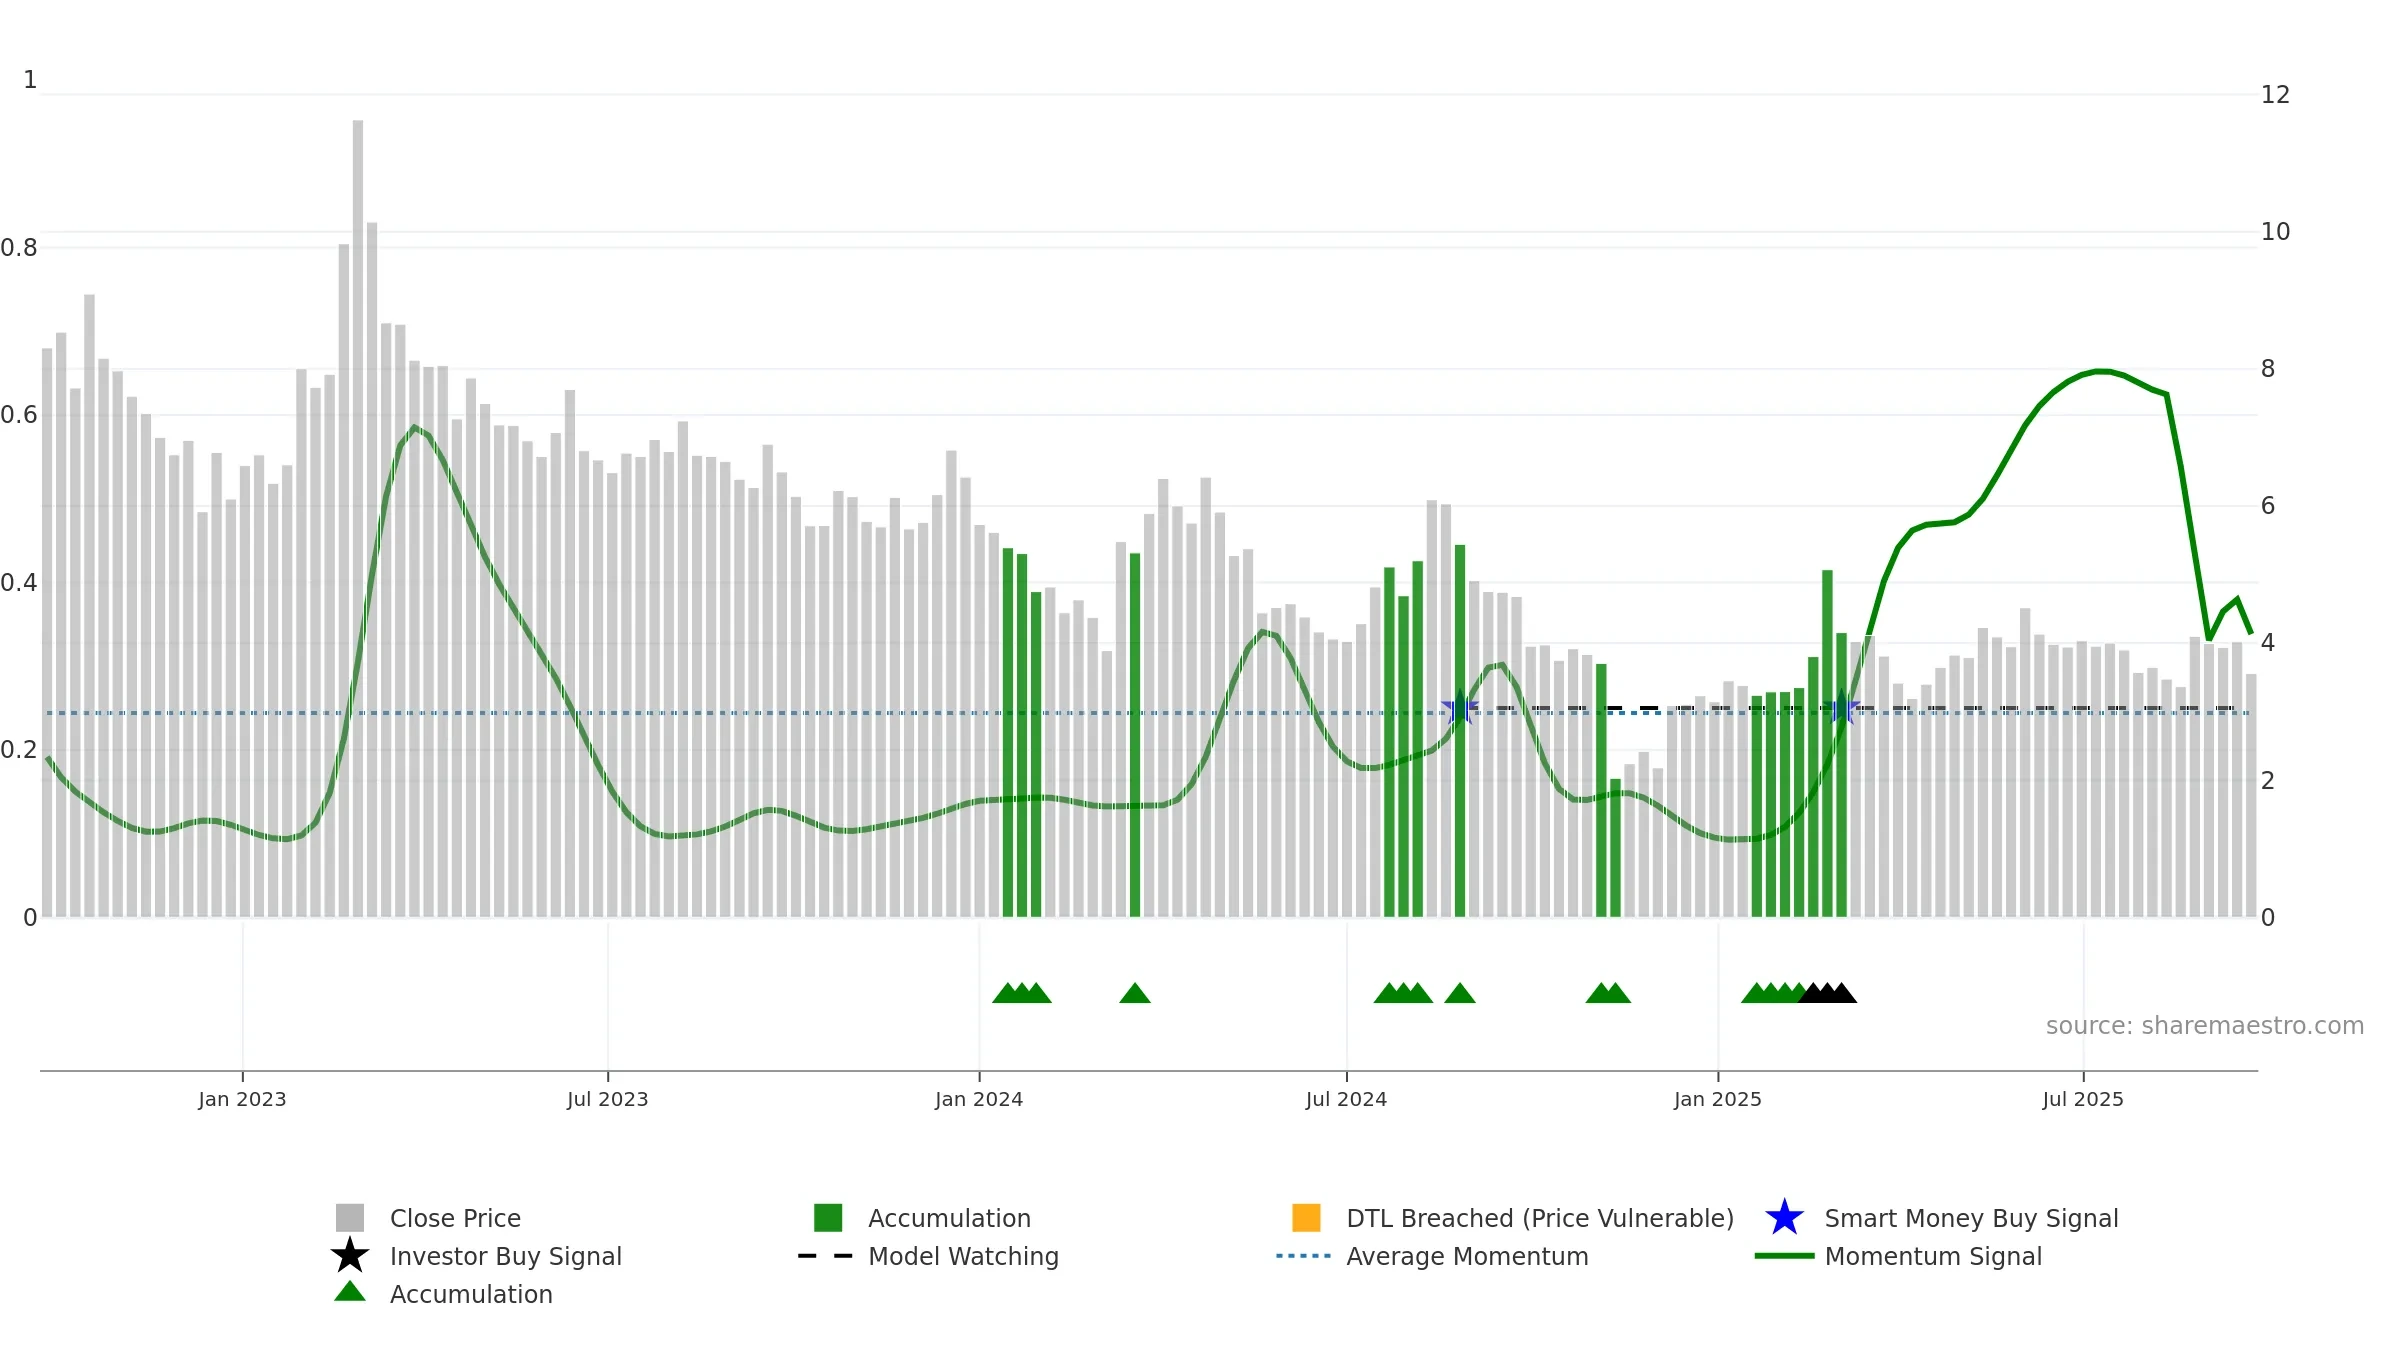
Weekly Summary
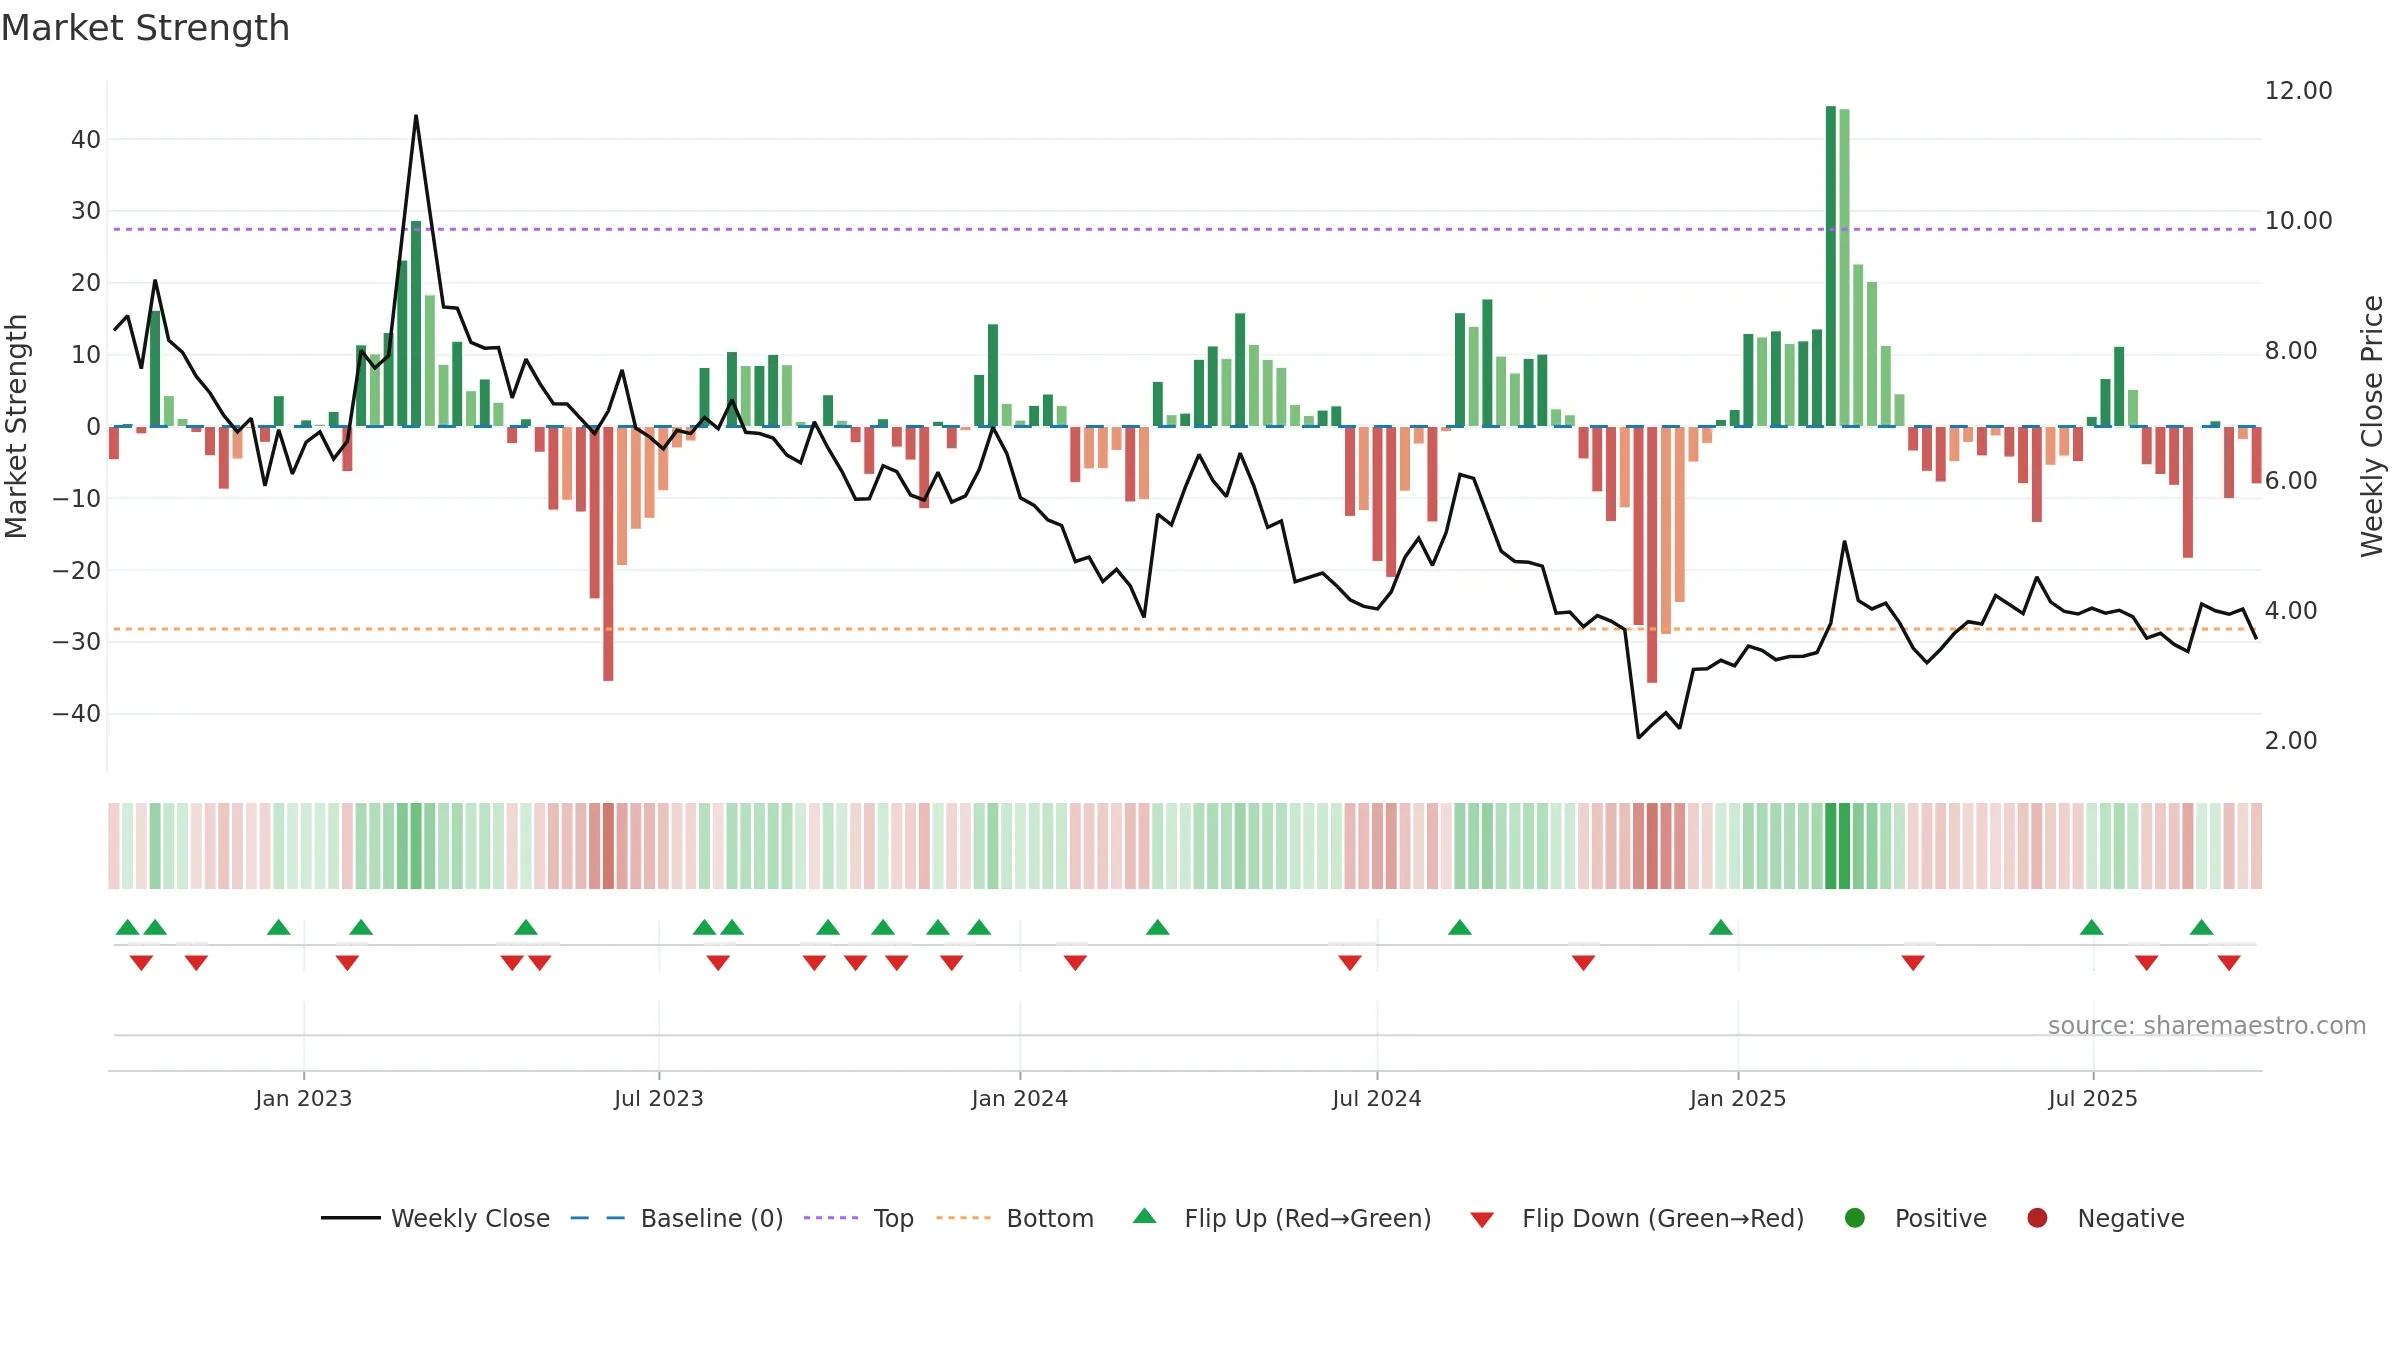
Sivers Semiconductors AB (publ) closed at 3.5540 (-1.50% WoW) . Data window ends Mon, 22 Sep 2025.
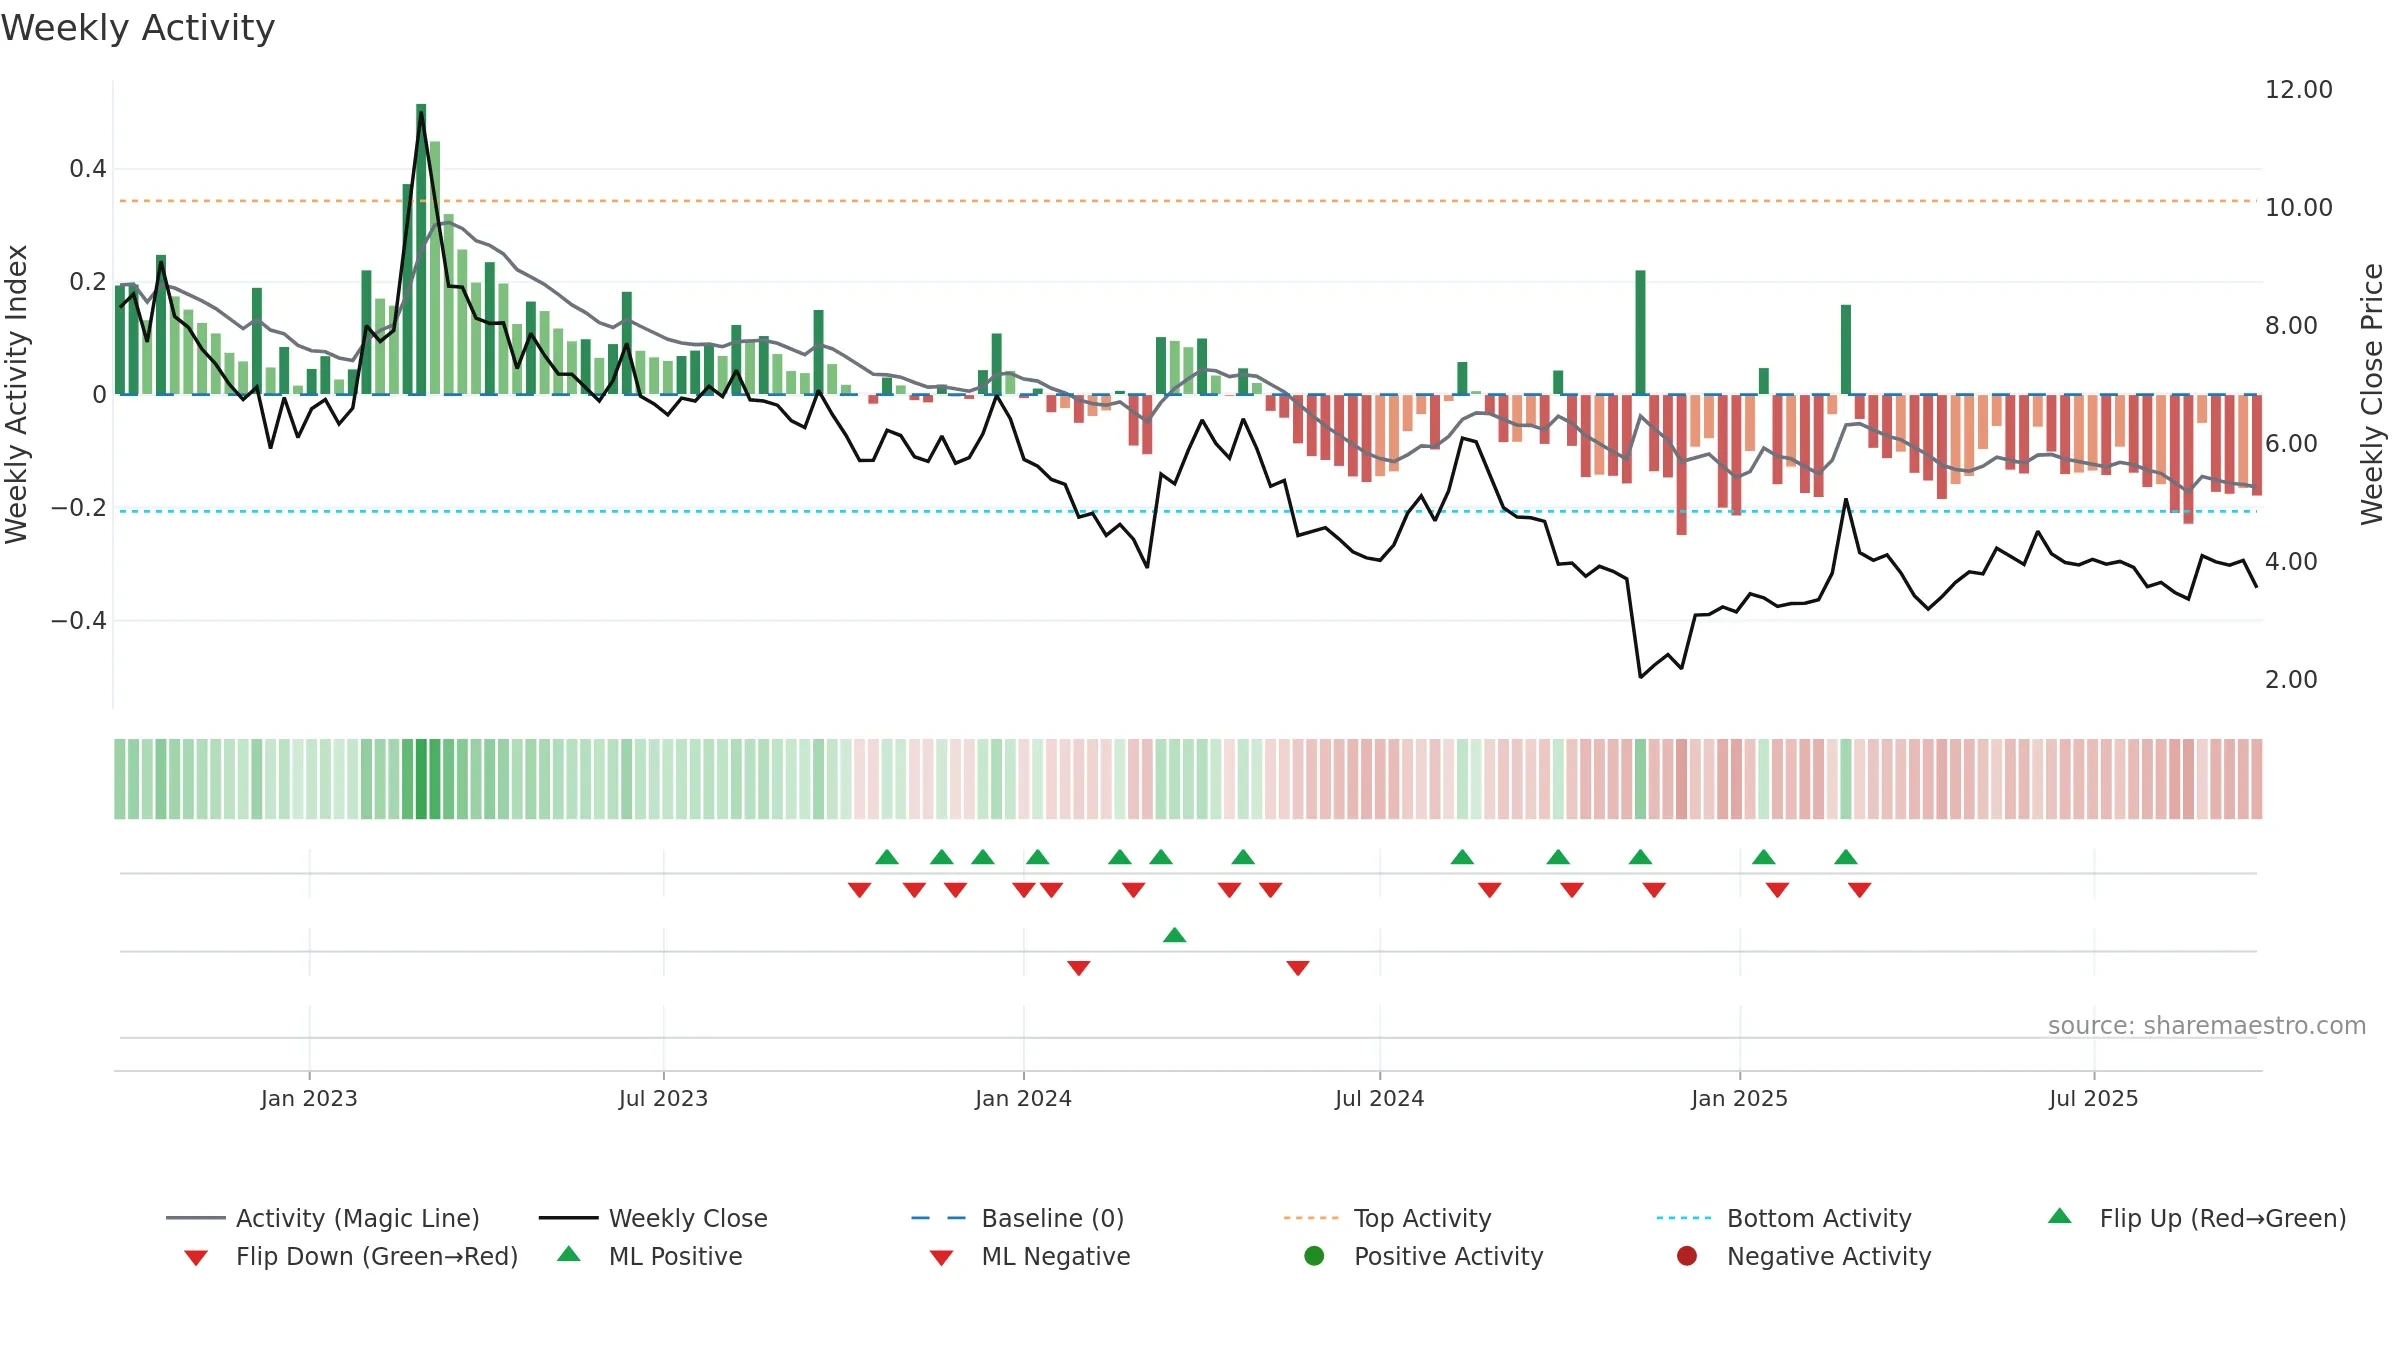
How to read this — Price slope is upward, indicating persistent buying over the window. Elevated weekly volatility increases whipsaw risk. Volume trend diverges from price — watch for fatigue or rotation. Returns are positively correlated with volume — strength tends to arrive on higher activity. Price sits below key averages, keeping pressure on the tape.
Up-slope supports buying interest; pullbacks may be contained if activity stays firm. Because liquidity isn’t confirming, prefer evidence of fresh demand before chasing moves.
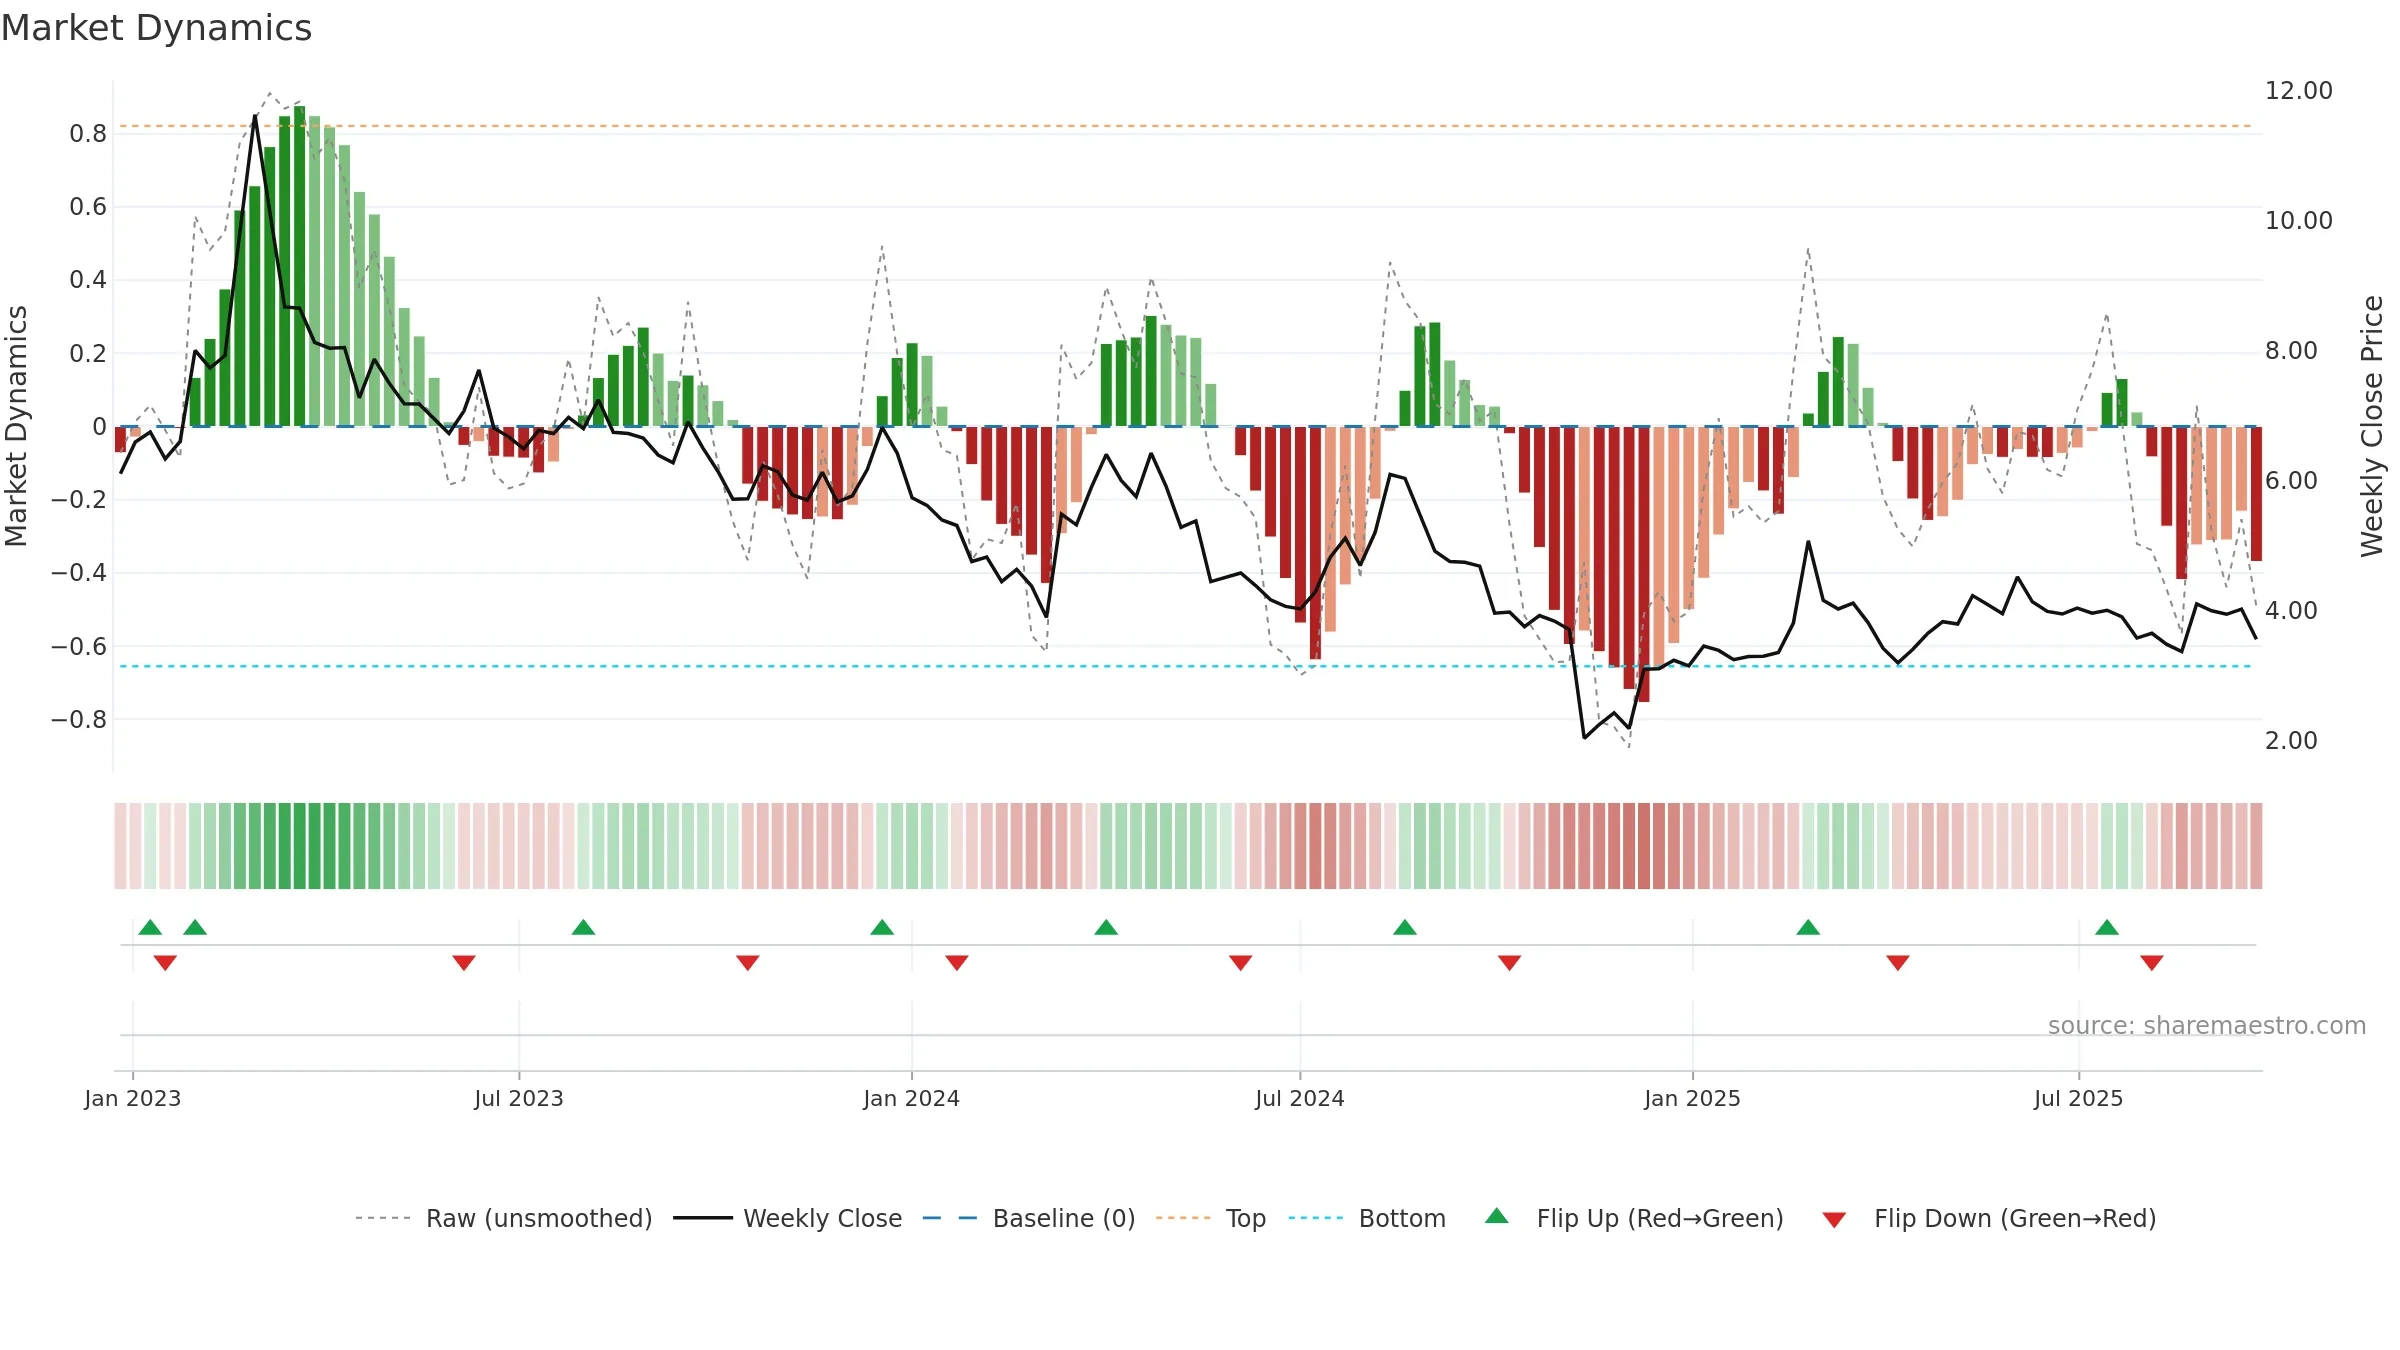
Gauge maps the trend signal to a 0–100 scale.
How to read this — Range-bound conditions; conviction is limited until a break or acceleration emerges.
Wait for a directional break or improving acceleration.

Relative strength is Negative
(< 0%, underperforming).
Latest MRS: -7.79% (week ending Fri, 26 Sep 2025).
Slope: Falling over 8w.
Notes:
- Below zero line indicates relative weakness vs benchmark.
- MRS slope falling over ~8 weeks.
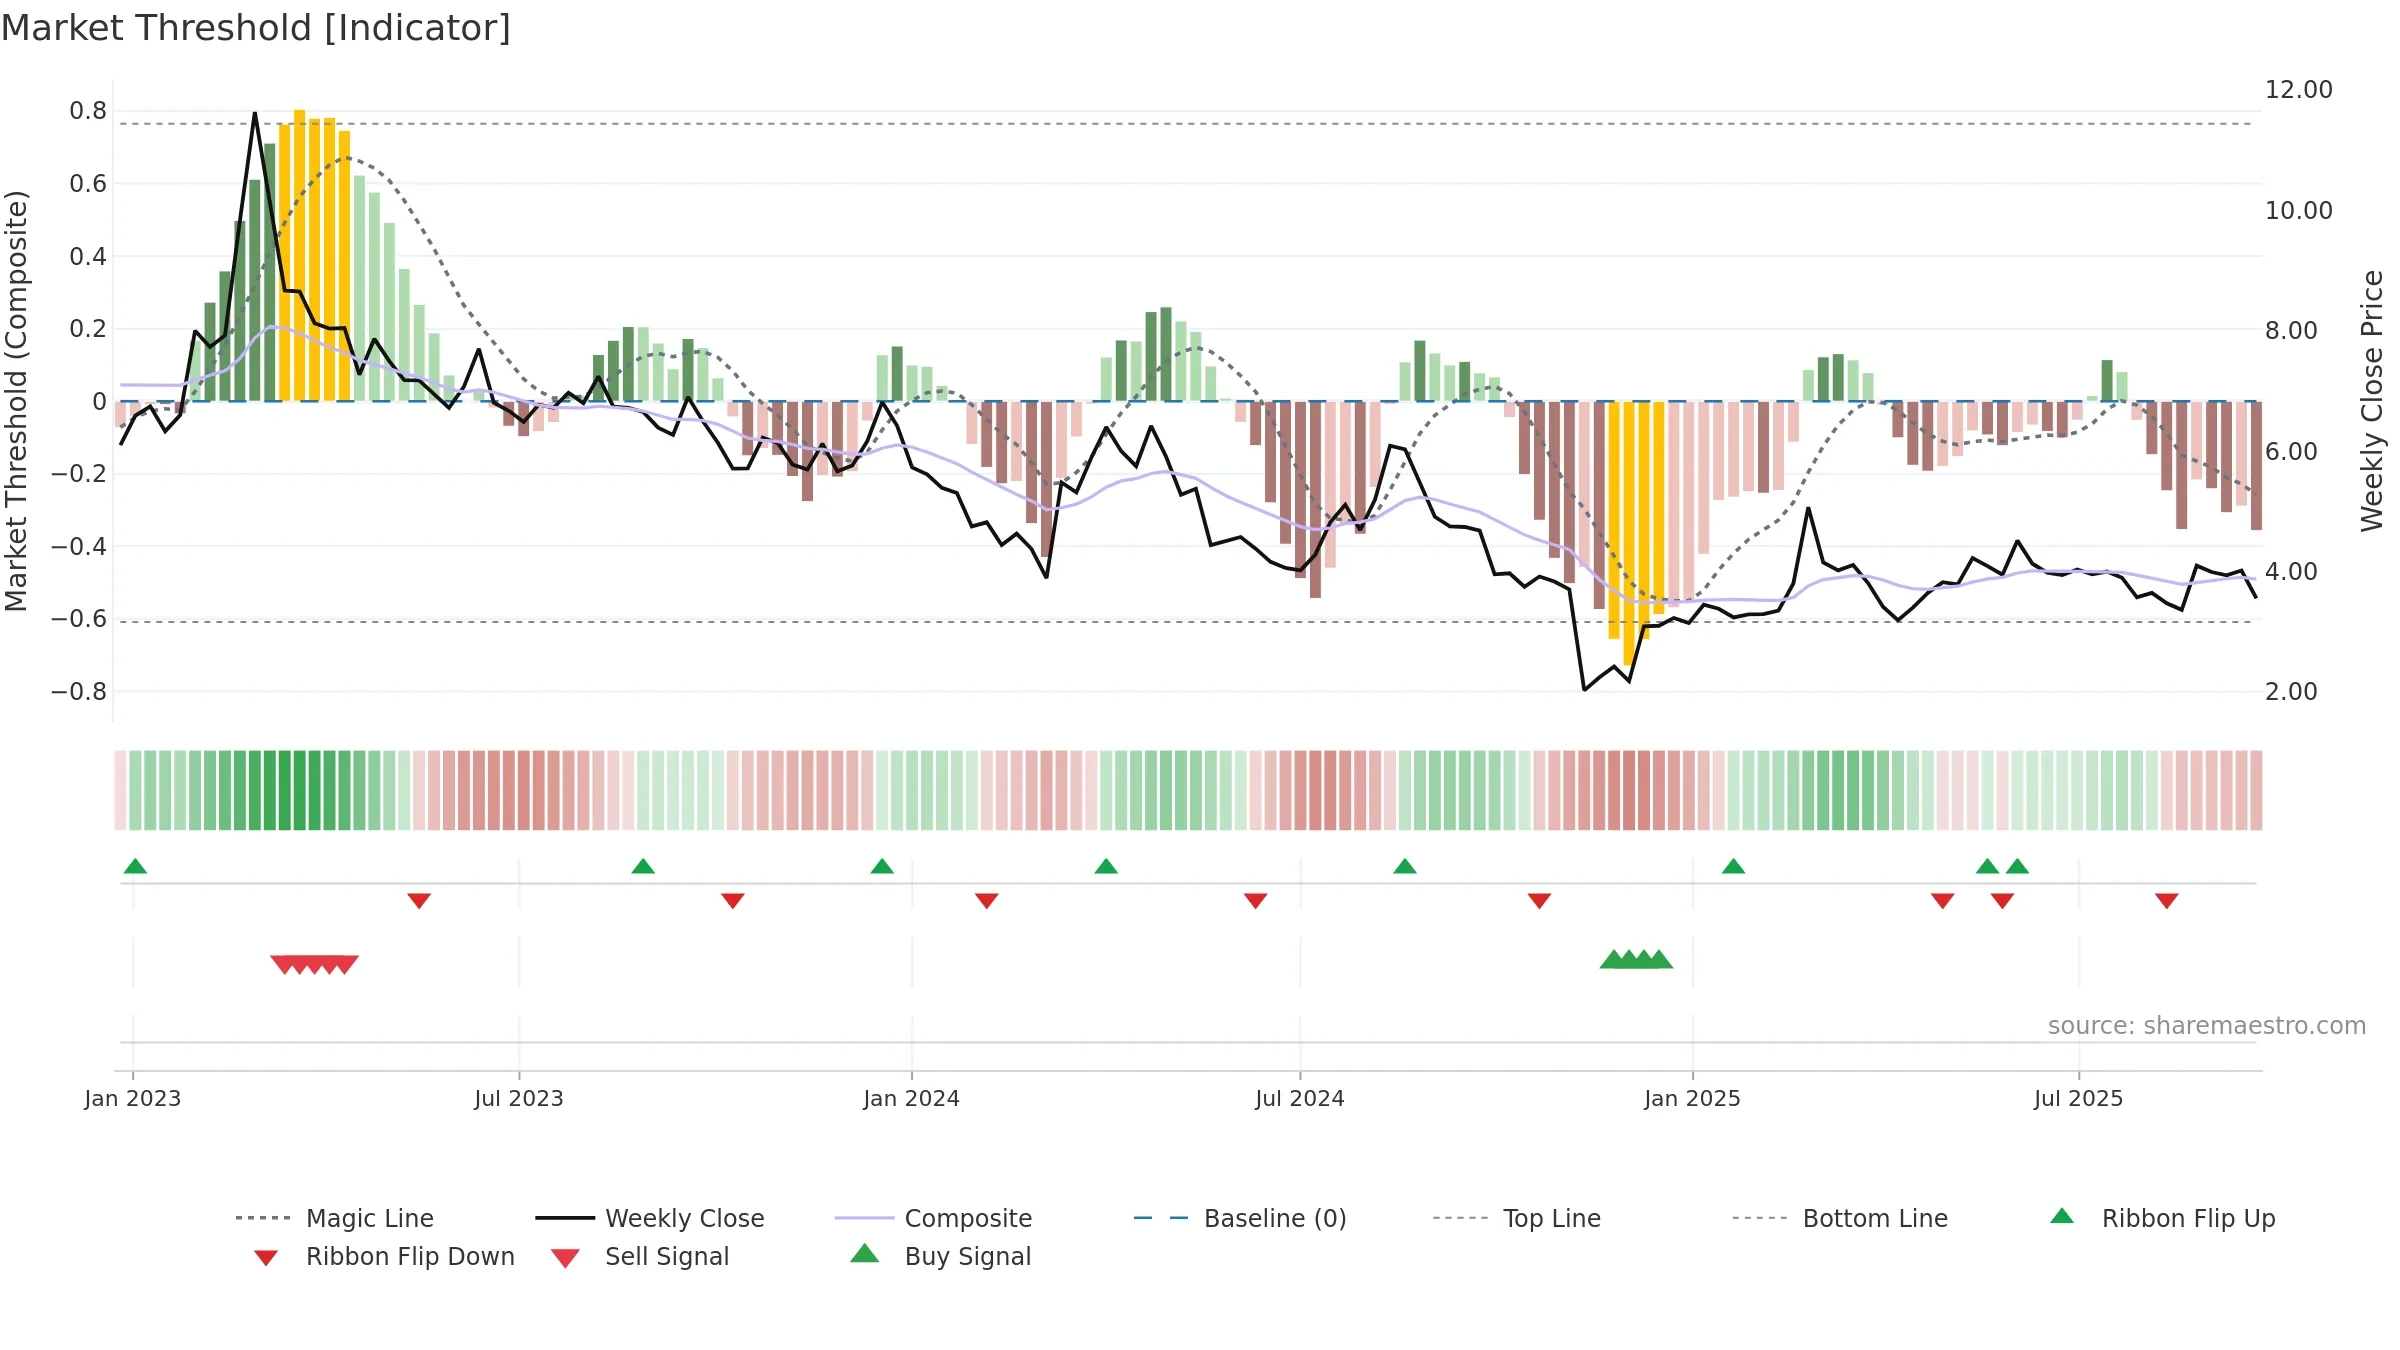
Conclusion
Negative setup. ⯪☆☆☆☆ confidence. Trend: Range / Neutral · -2.52% over window · vol 4.22% · liquidity divergence · posture below · RS weak
- Momentum is weak/falling
- Price is not above key averages
- Liquidity diverges from price
- High return volatility raises whipsaw risk
Why: Price window -2.52% over w. Close is -13.27% below the prior-window high. Return volatility 4.22%. Volume trend falling. Liquidity divergence with price. Trend state range / neutral. Momentum bearish and falling.
Tip: Most metrics include a hover tooltip where they appear in the report.