New Oriental Education & Technology Group Inc.
9901 HKG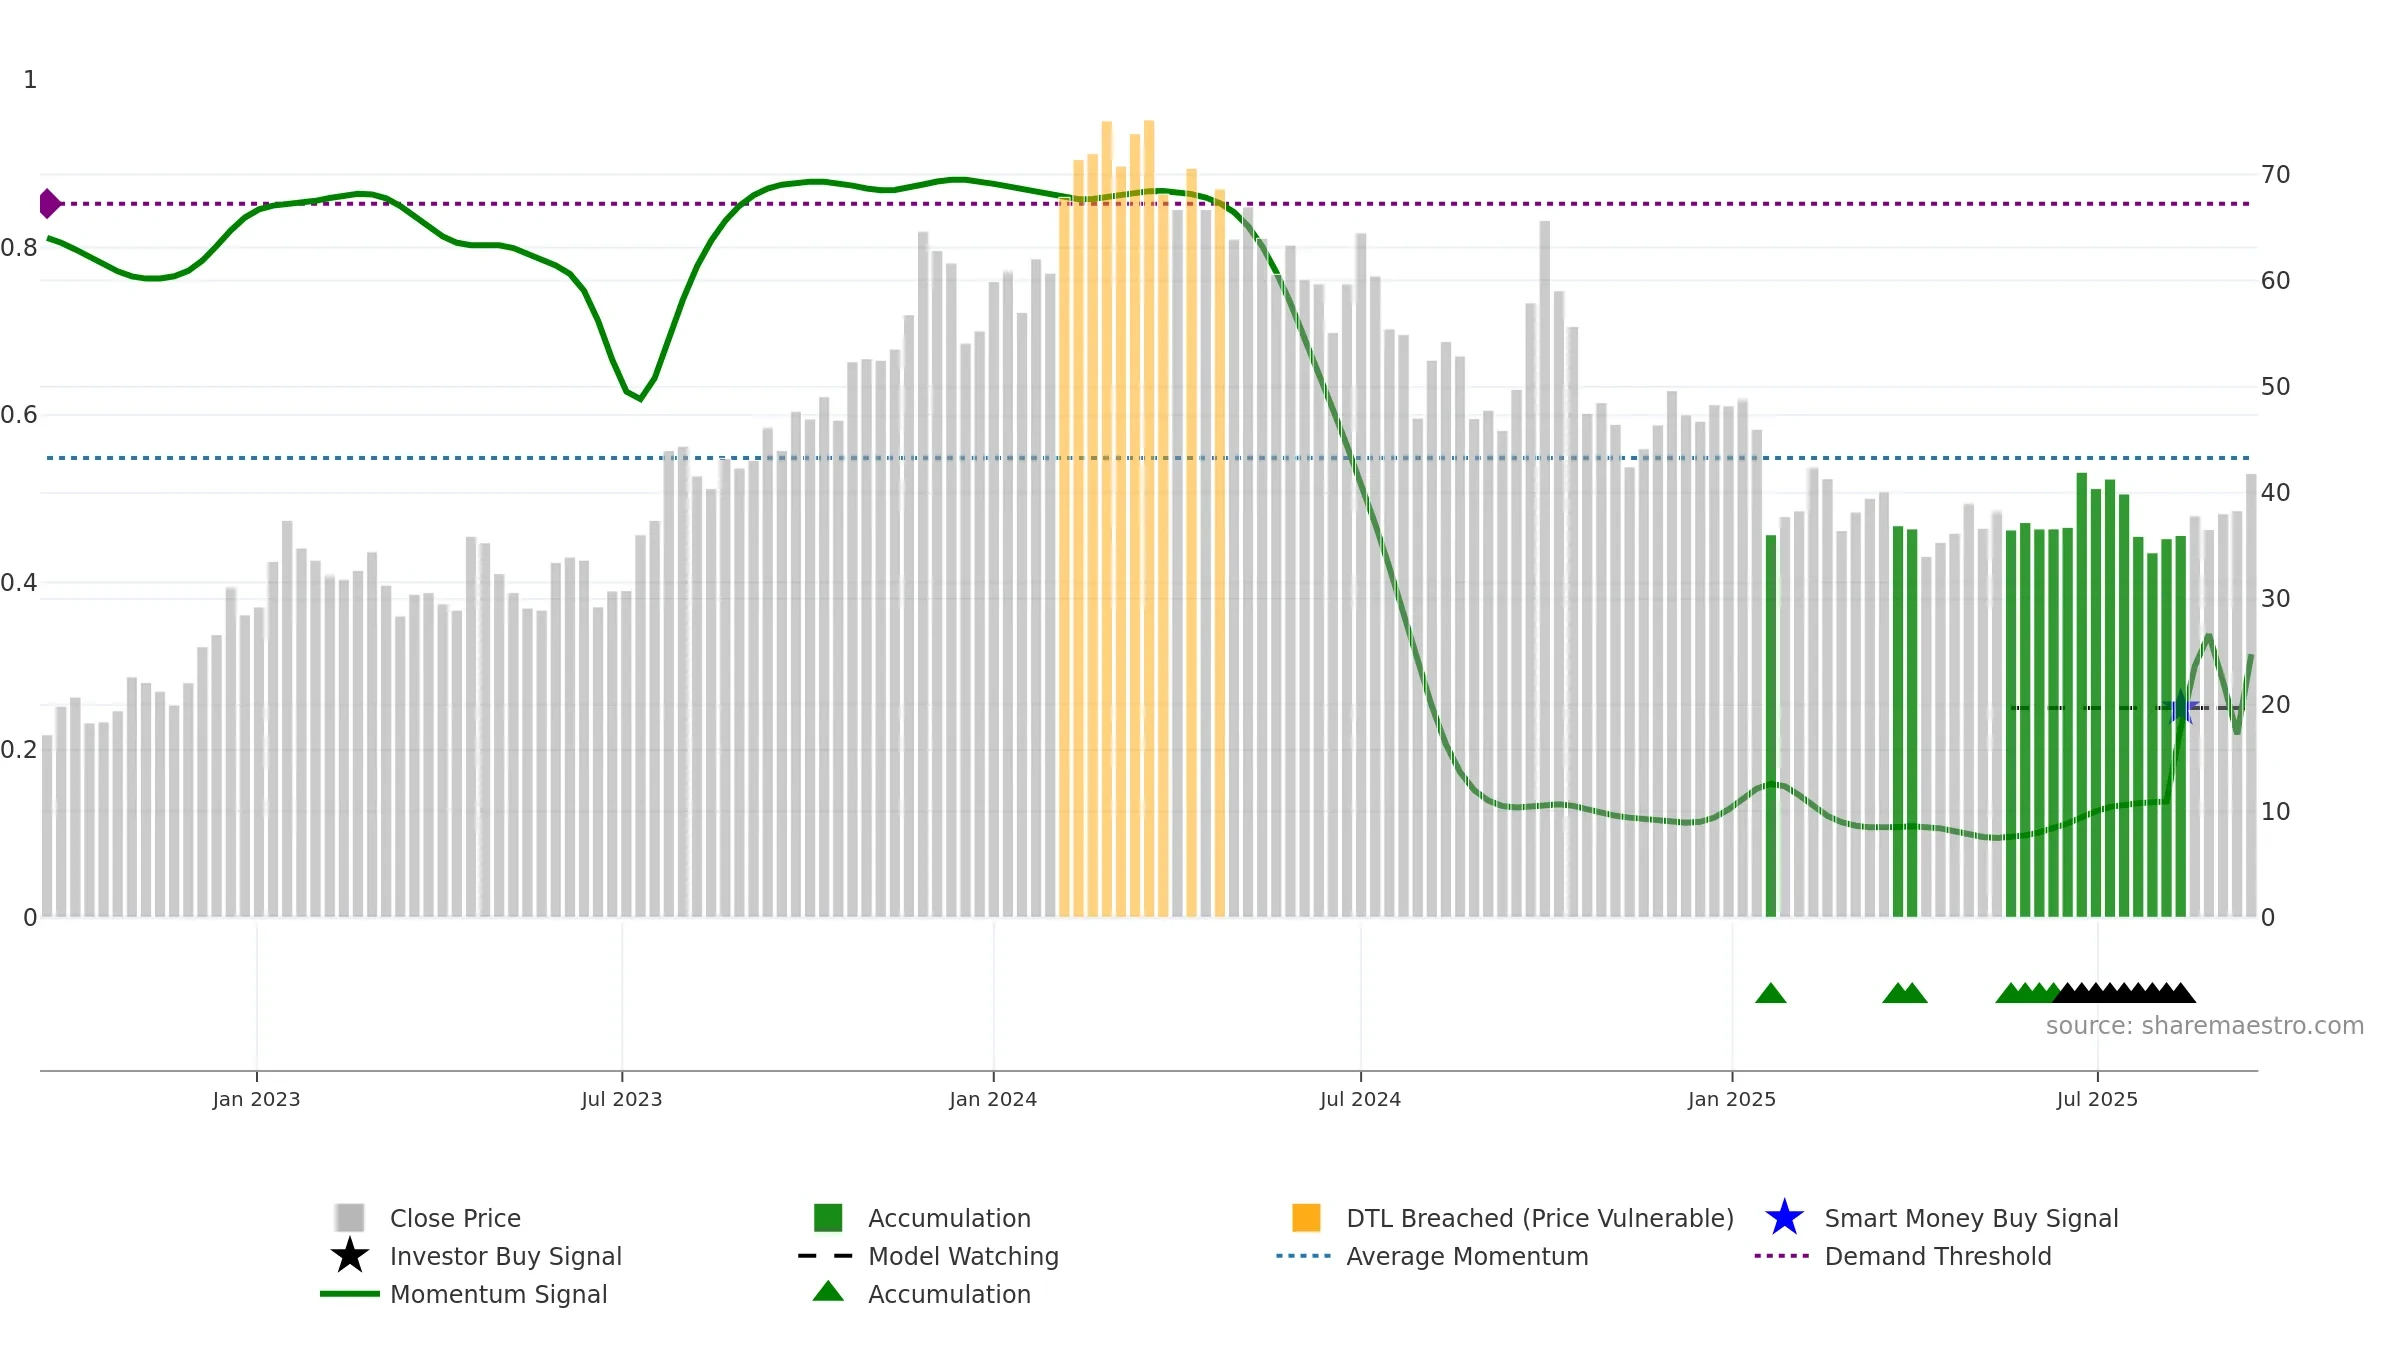
Weekly Report
New Oriental Education & Technology Group Inc. closed at 41.8400 (0.92% WoW) . Data window ends Mon, 15 Sep 2025.
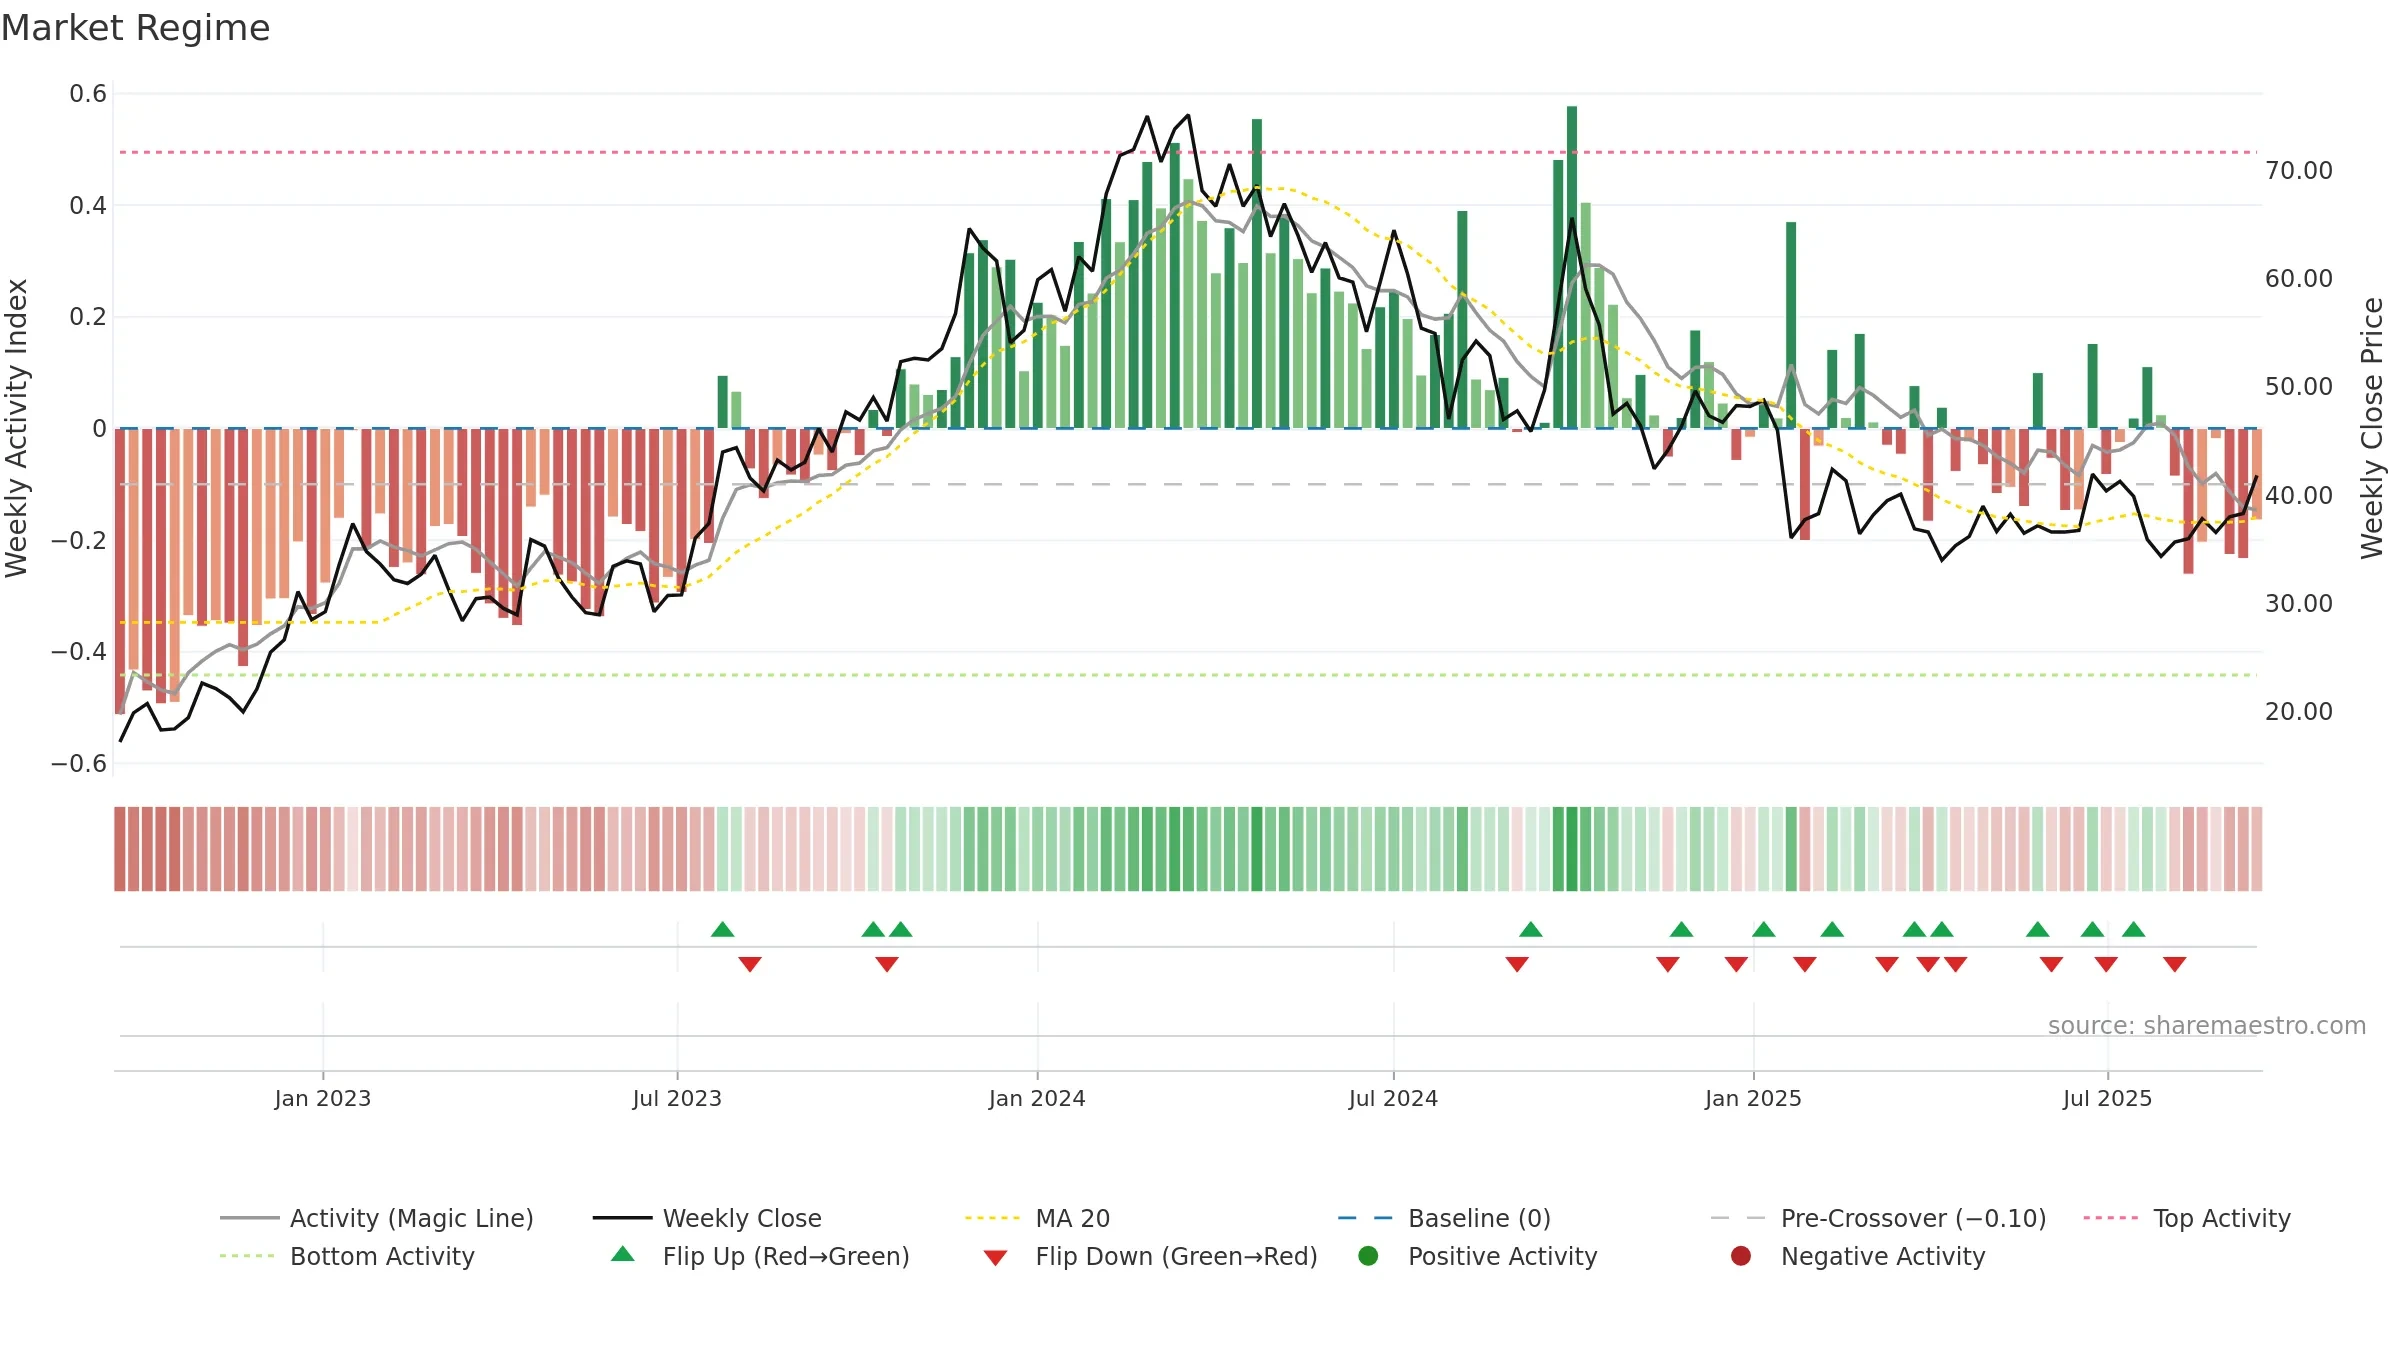
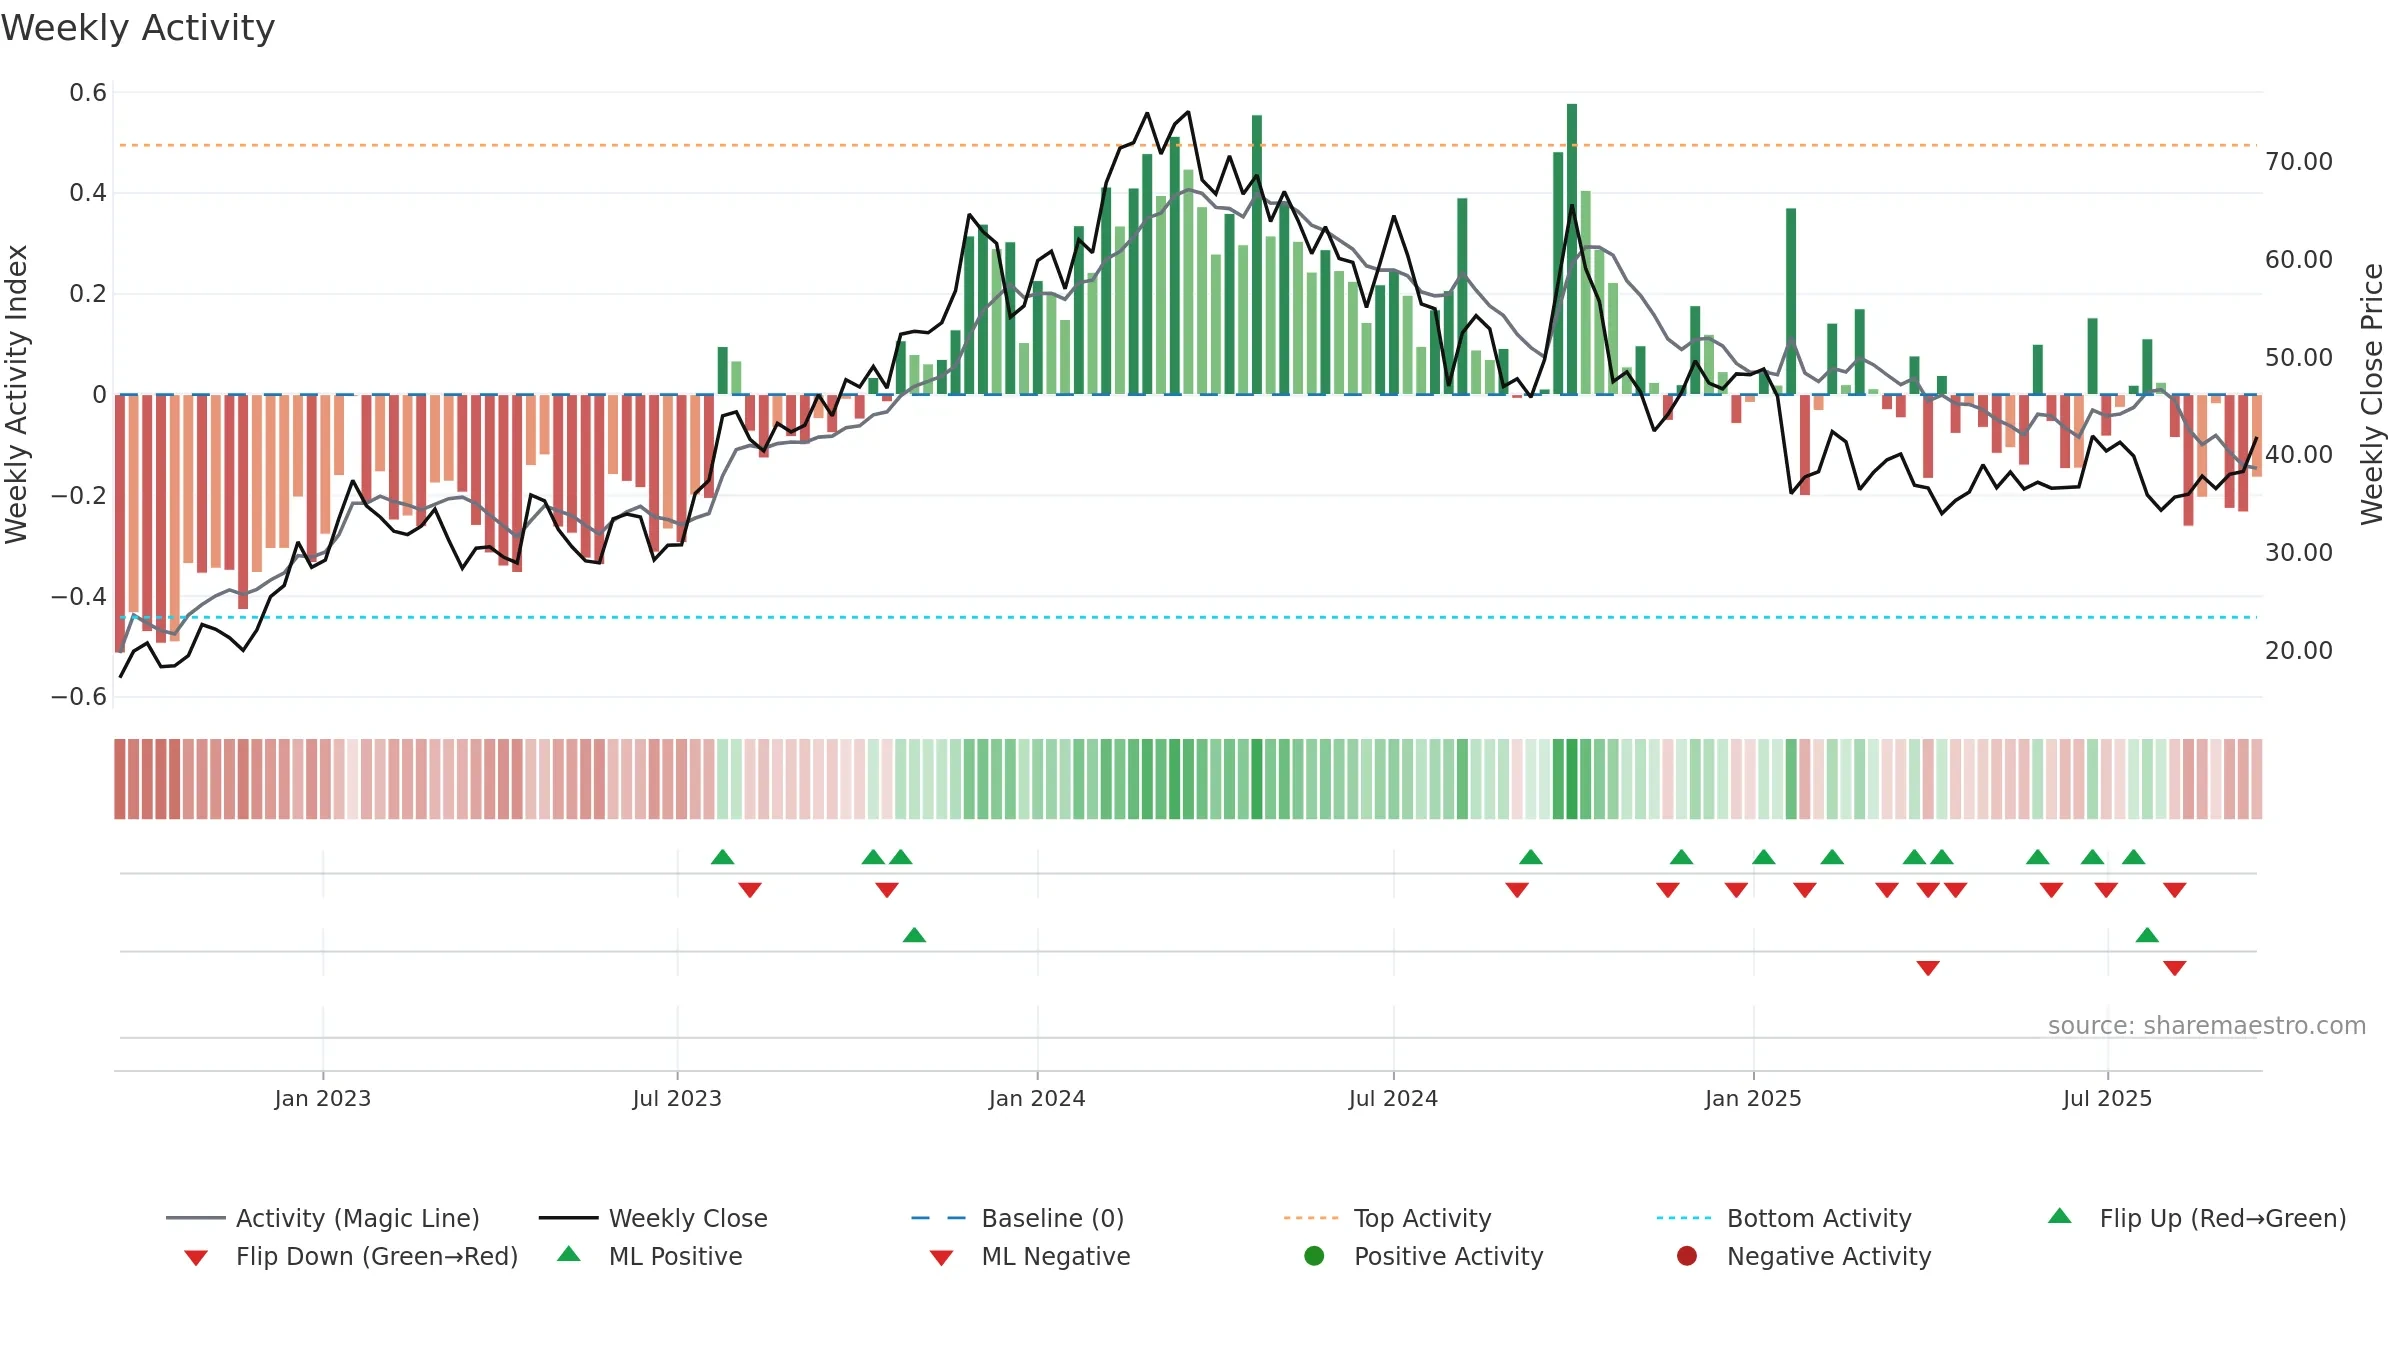
How to read this — Price slope is upward, indicating persistent buying over the window. Volume trend diverges from price — watch for fatigue or rotation. Returns are negatively correlated with volume — strength may come on lighter activity. Price holds above key averages, indicating constructive participation.
Up-slope supports buying interest; pullbacks may be contained if activity stays firm. Because liquidity isn’t confirming, prefer evidence of fresh demand before chasing moves.
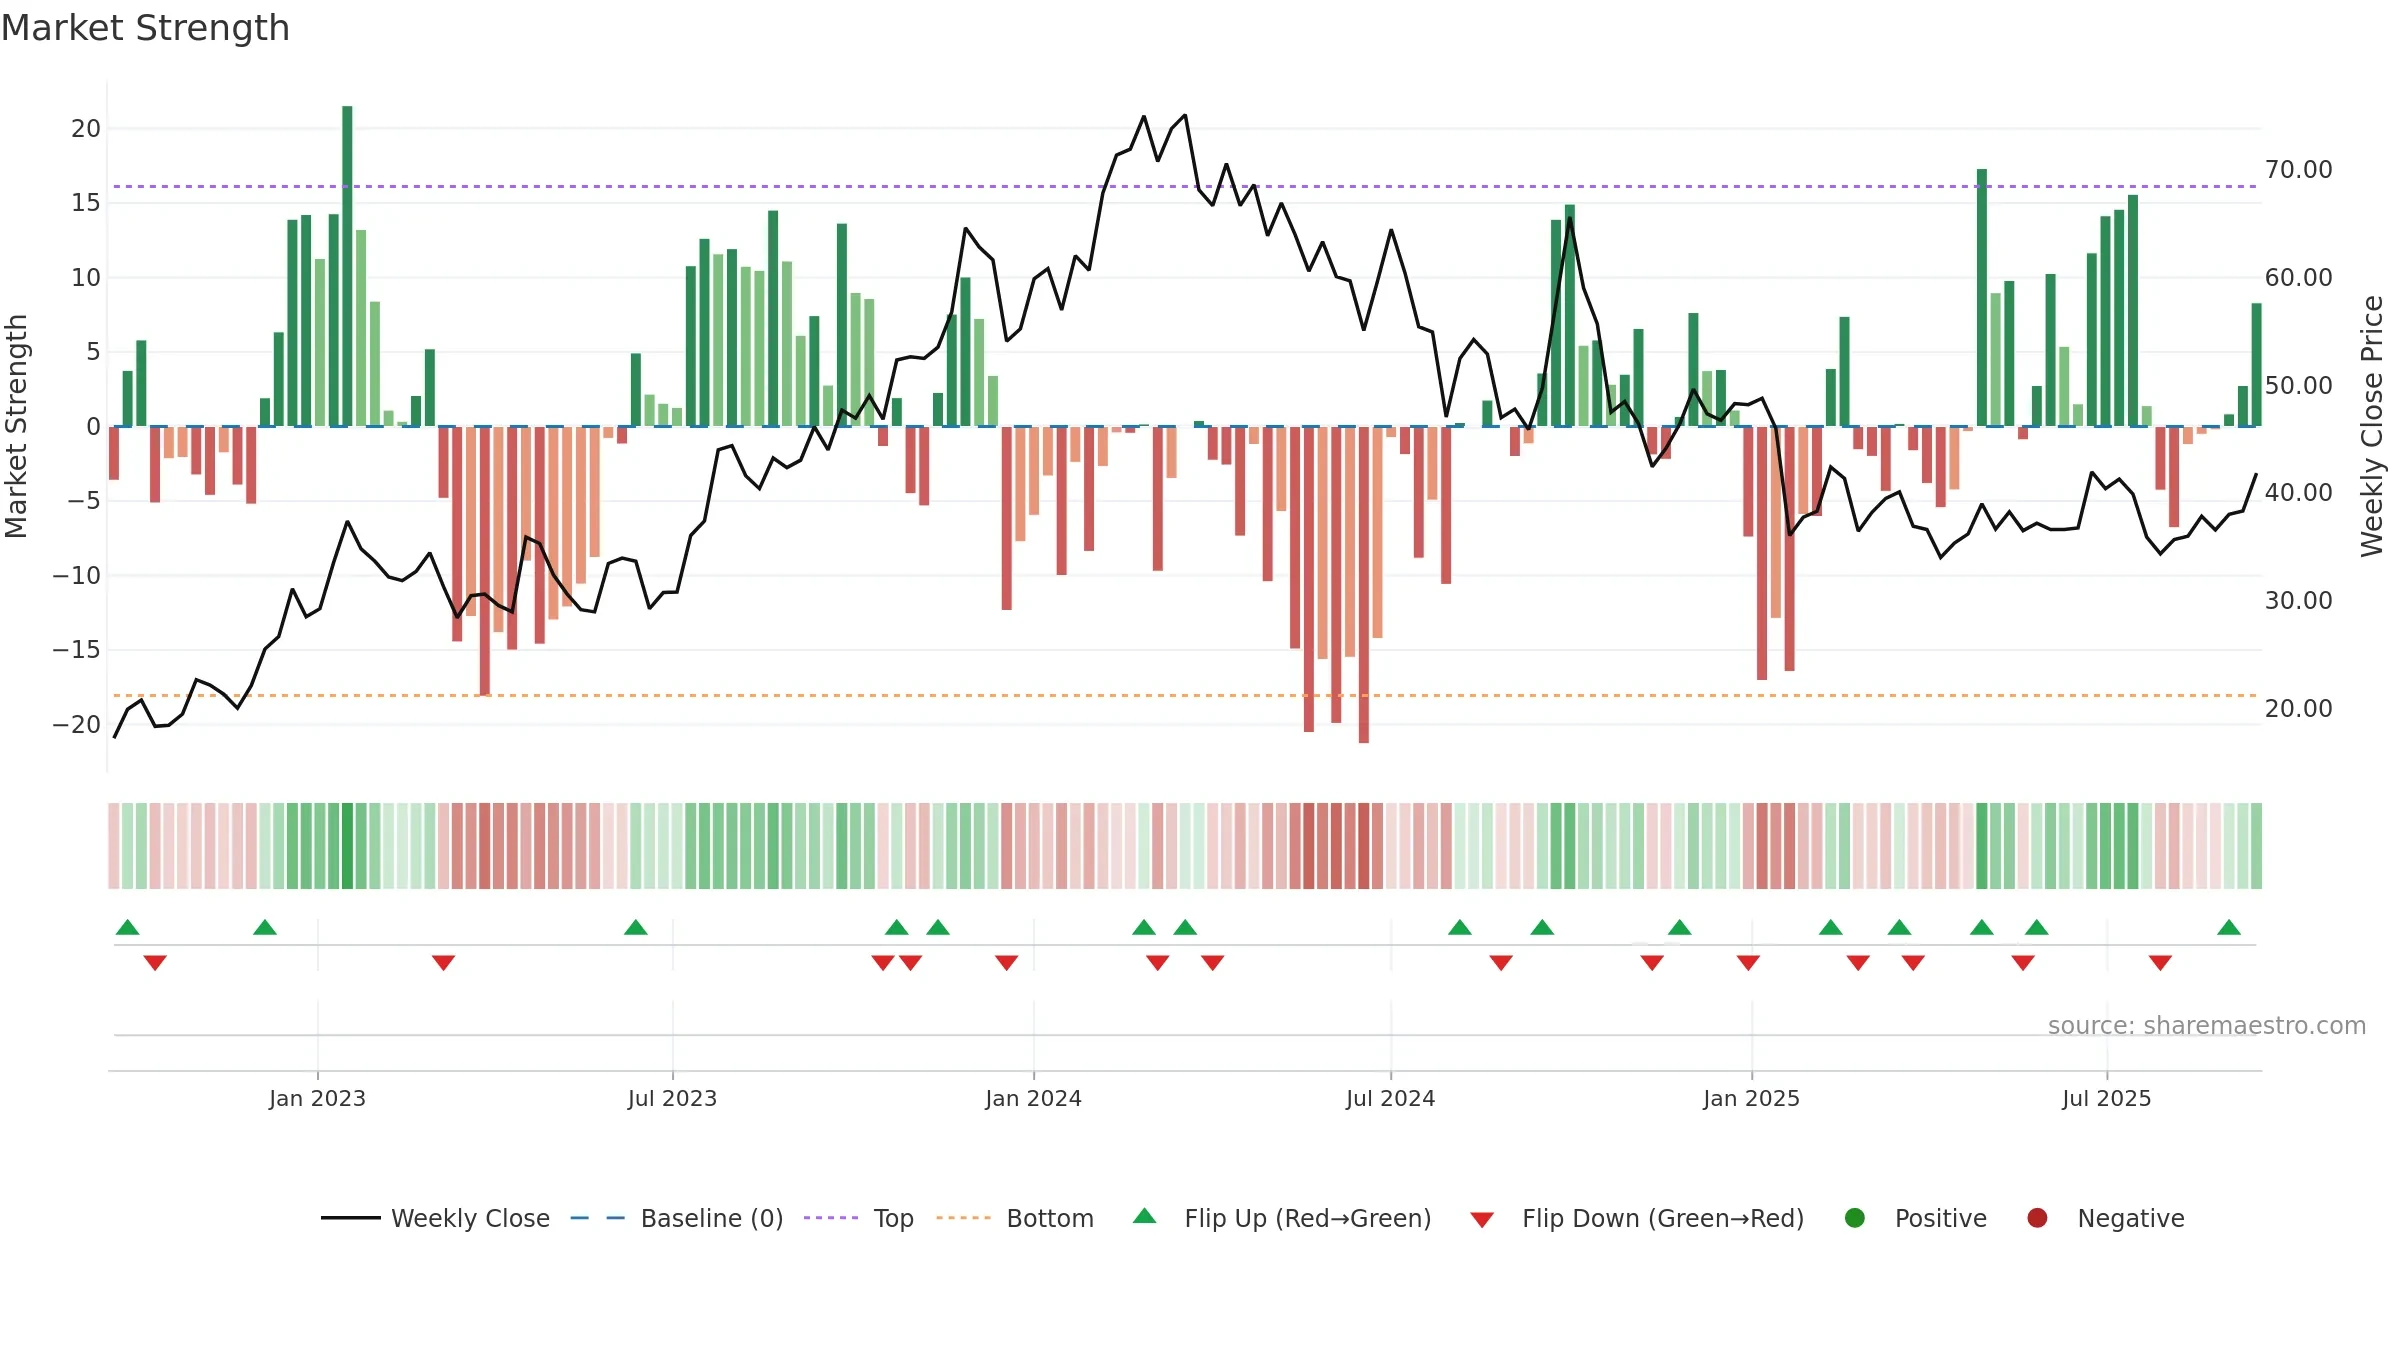
Gauge maps the trend signal to a 0–100 scale.
How to read this — Range-bound conditions; conviction is limited until a break or acceleration emerges.
Wait for a directional break or improving acceleration.
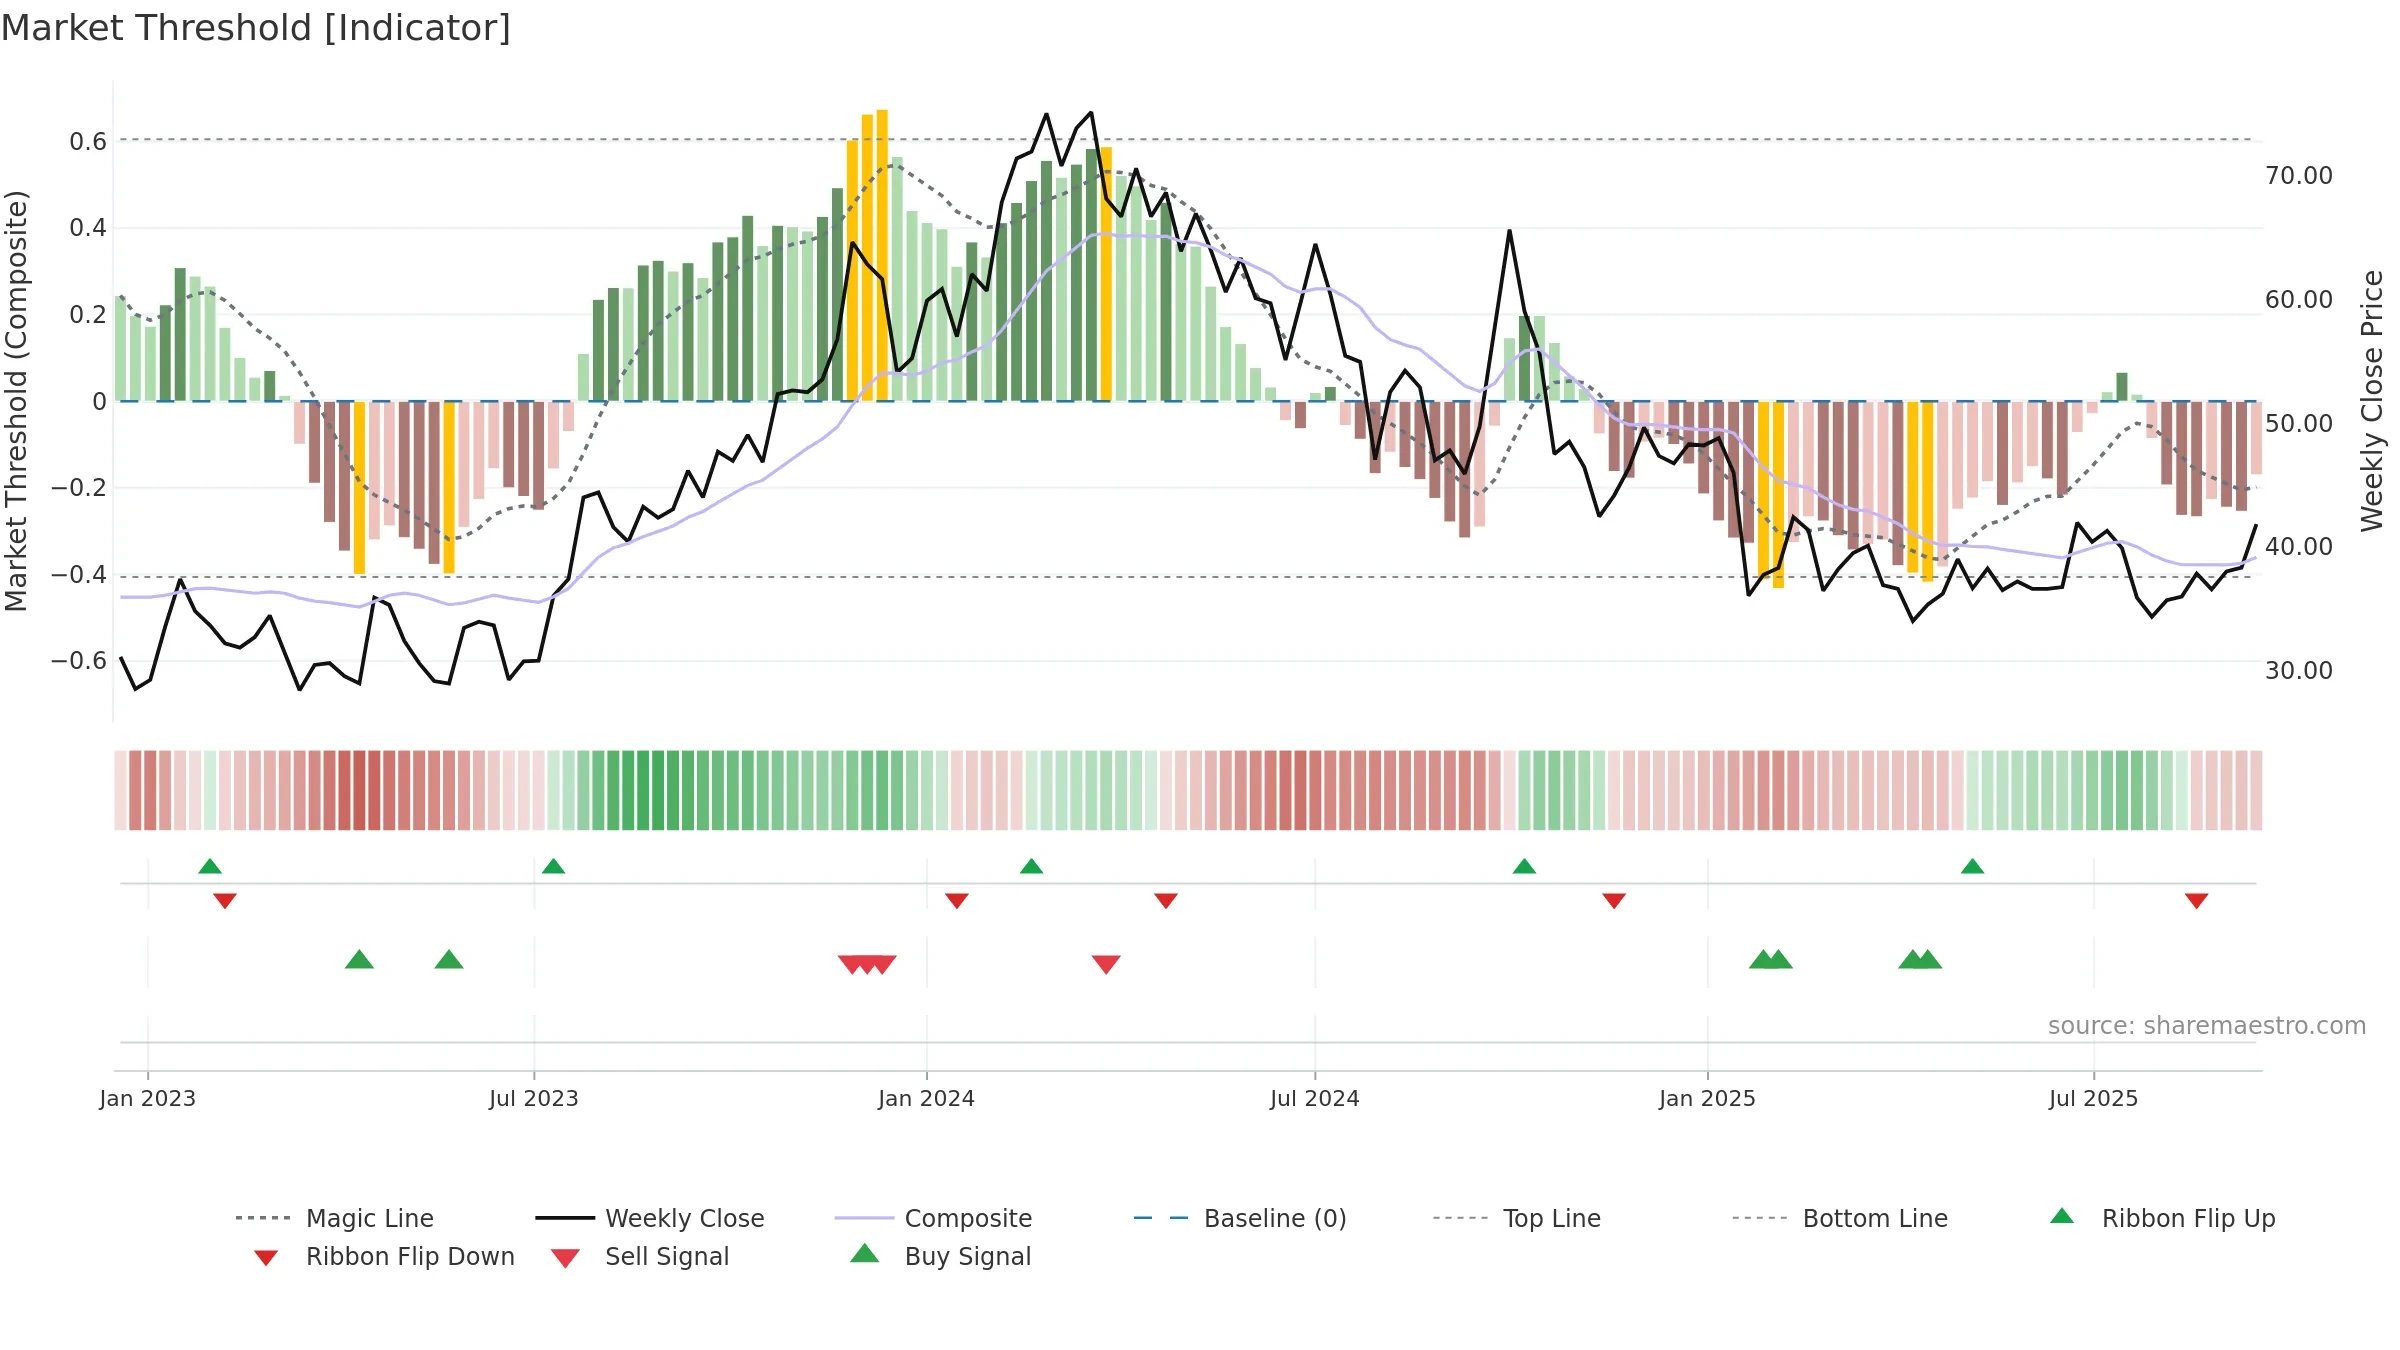
Conclusion
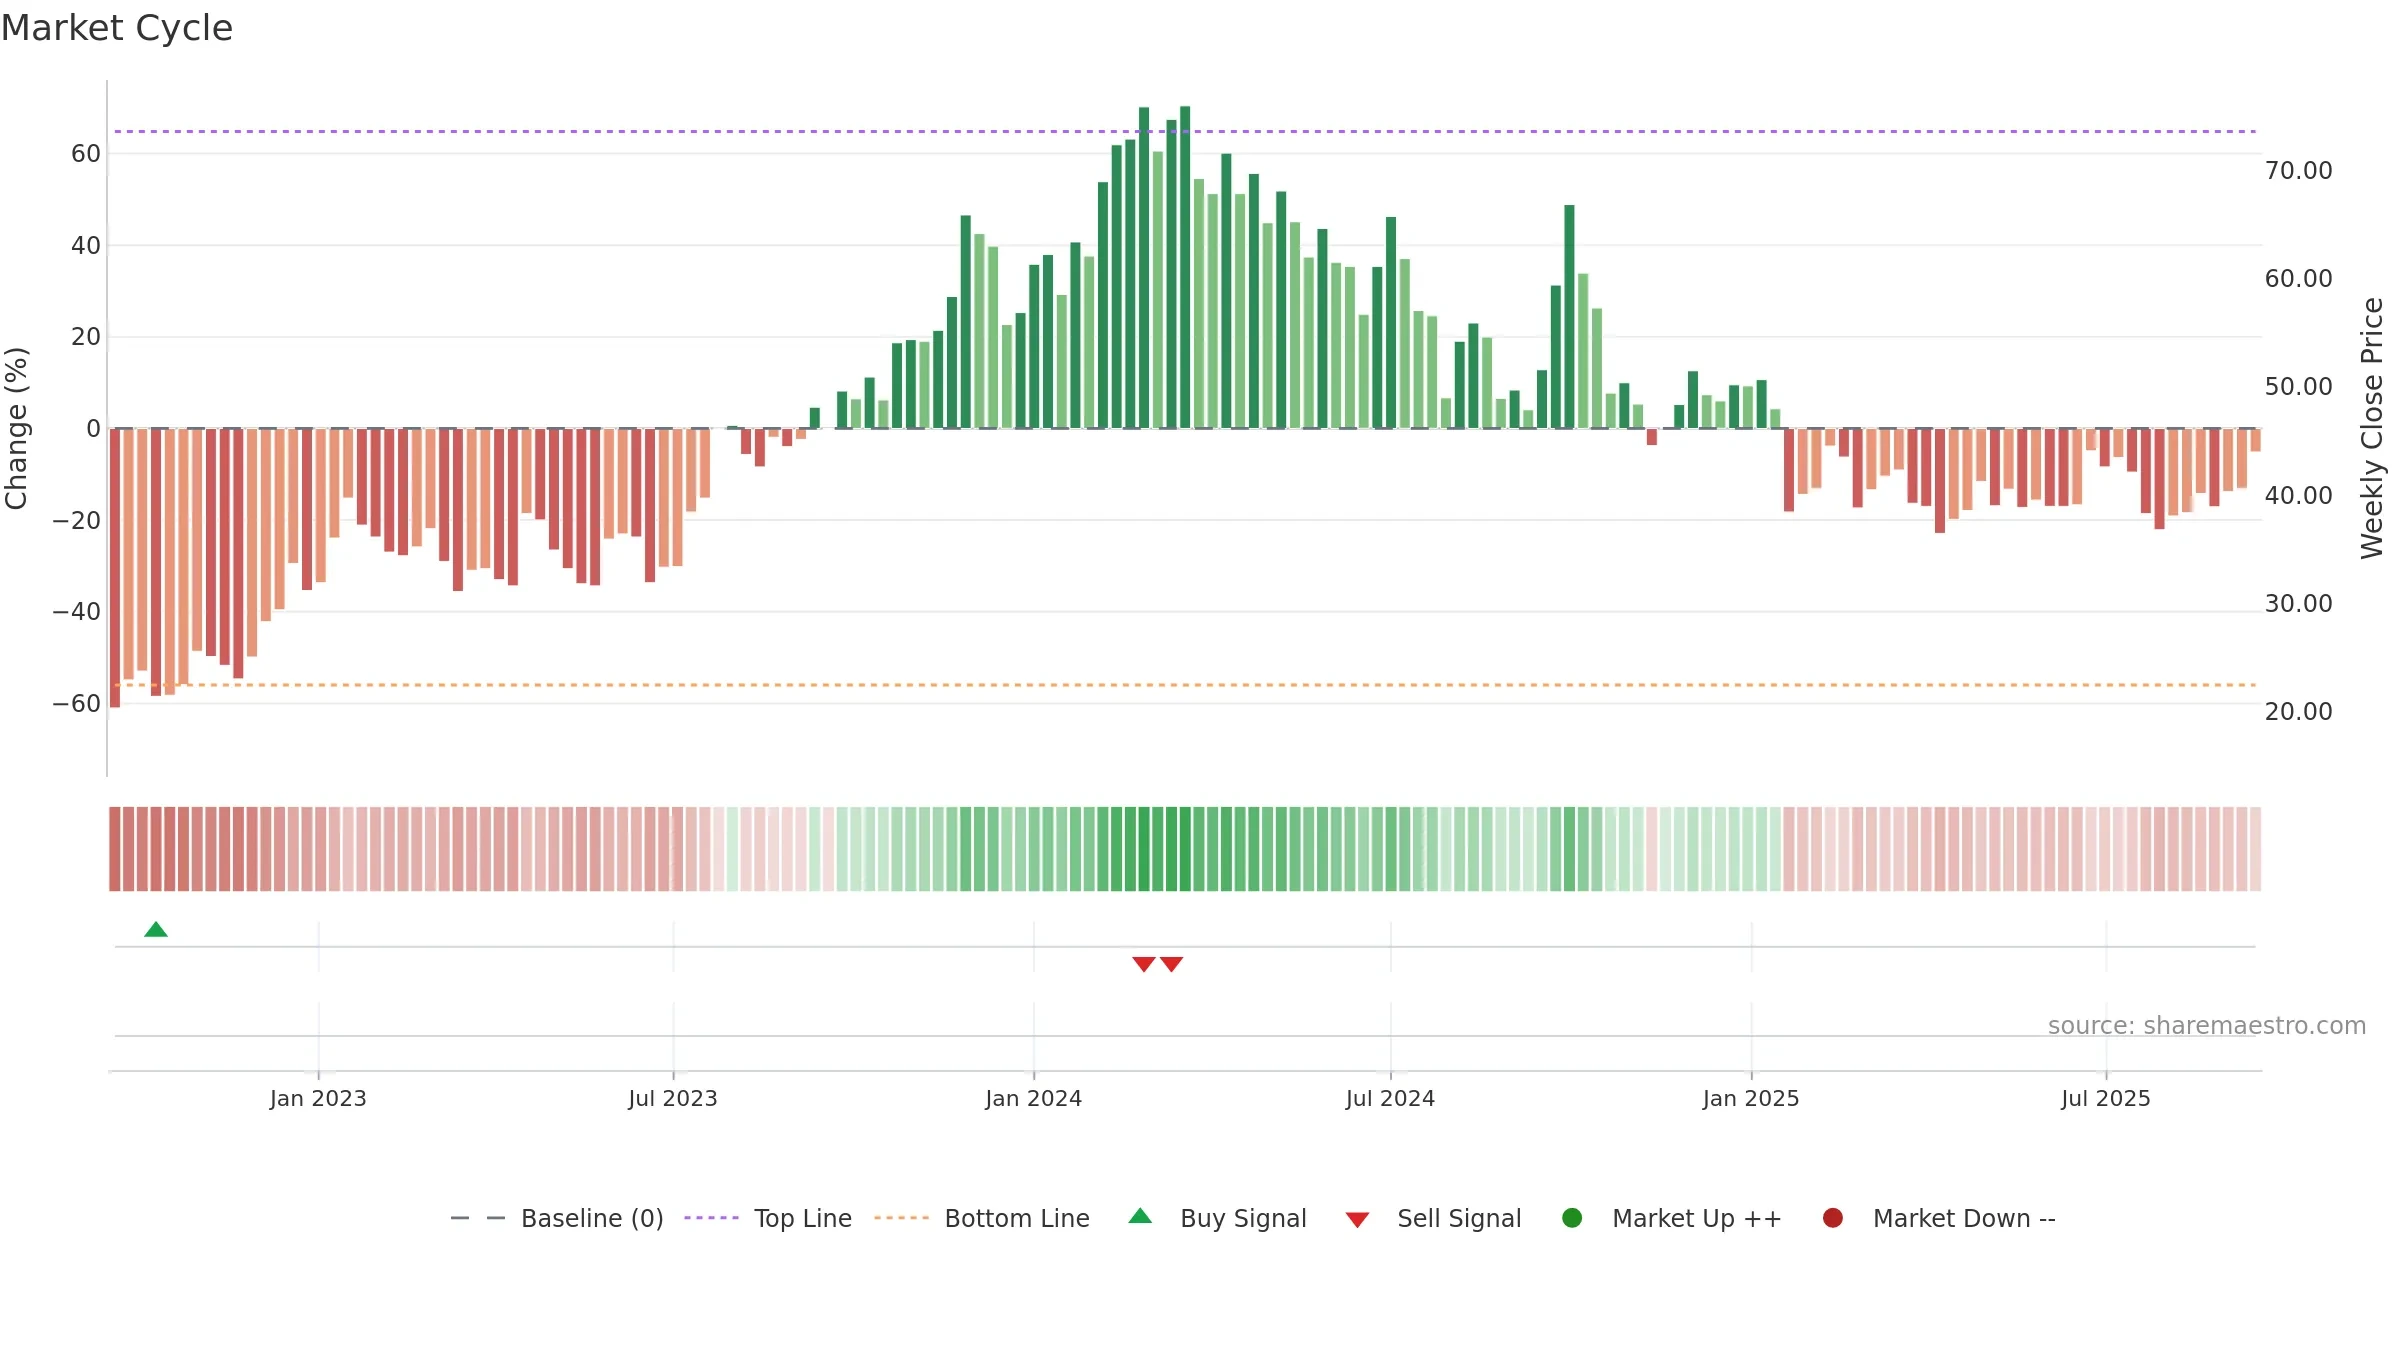
Positive setup. ★★★★☆ confidence. Price window: 21. Trend: Range / Neutral; gauge 31. In combination, liquidity diverges from price.
- Price holds above 8w & 26w averages
- Solid multi-week performance
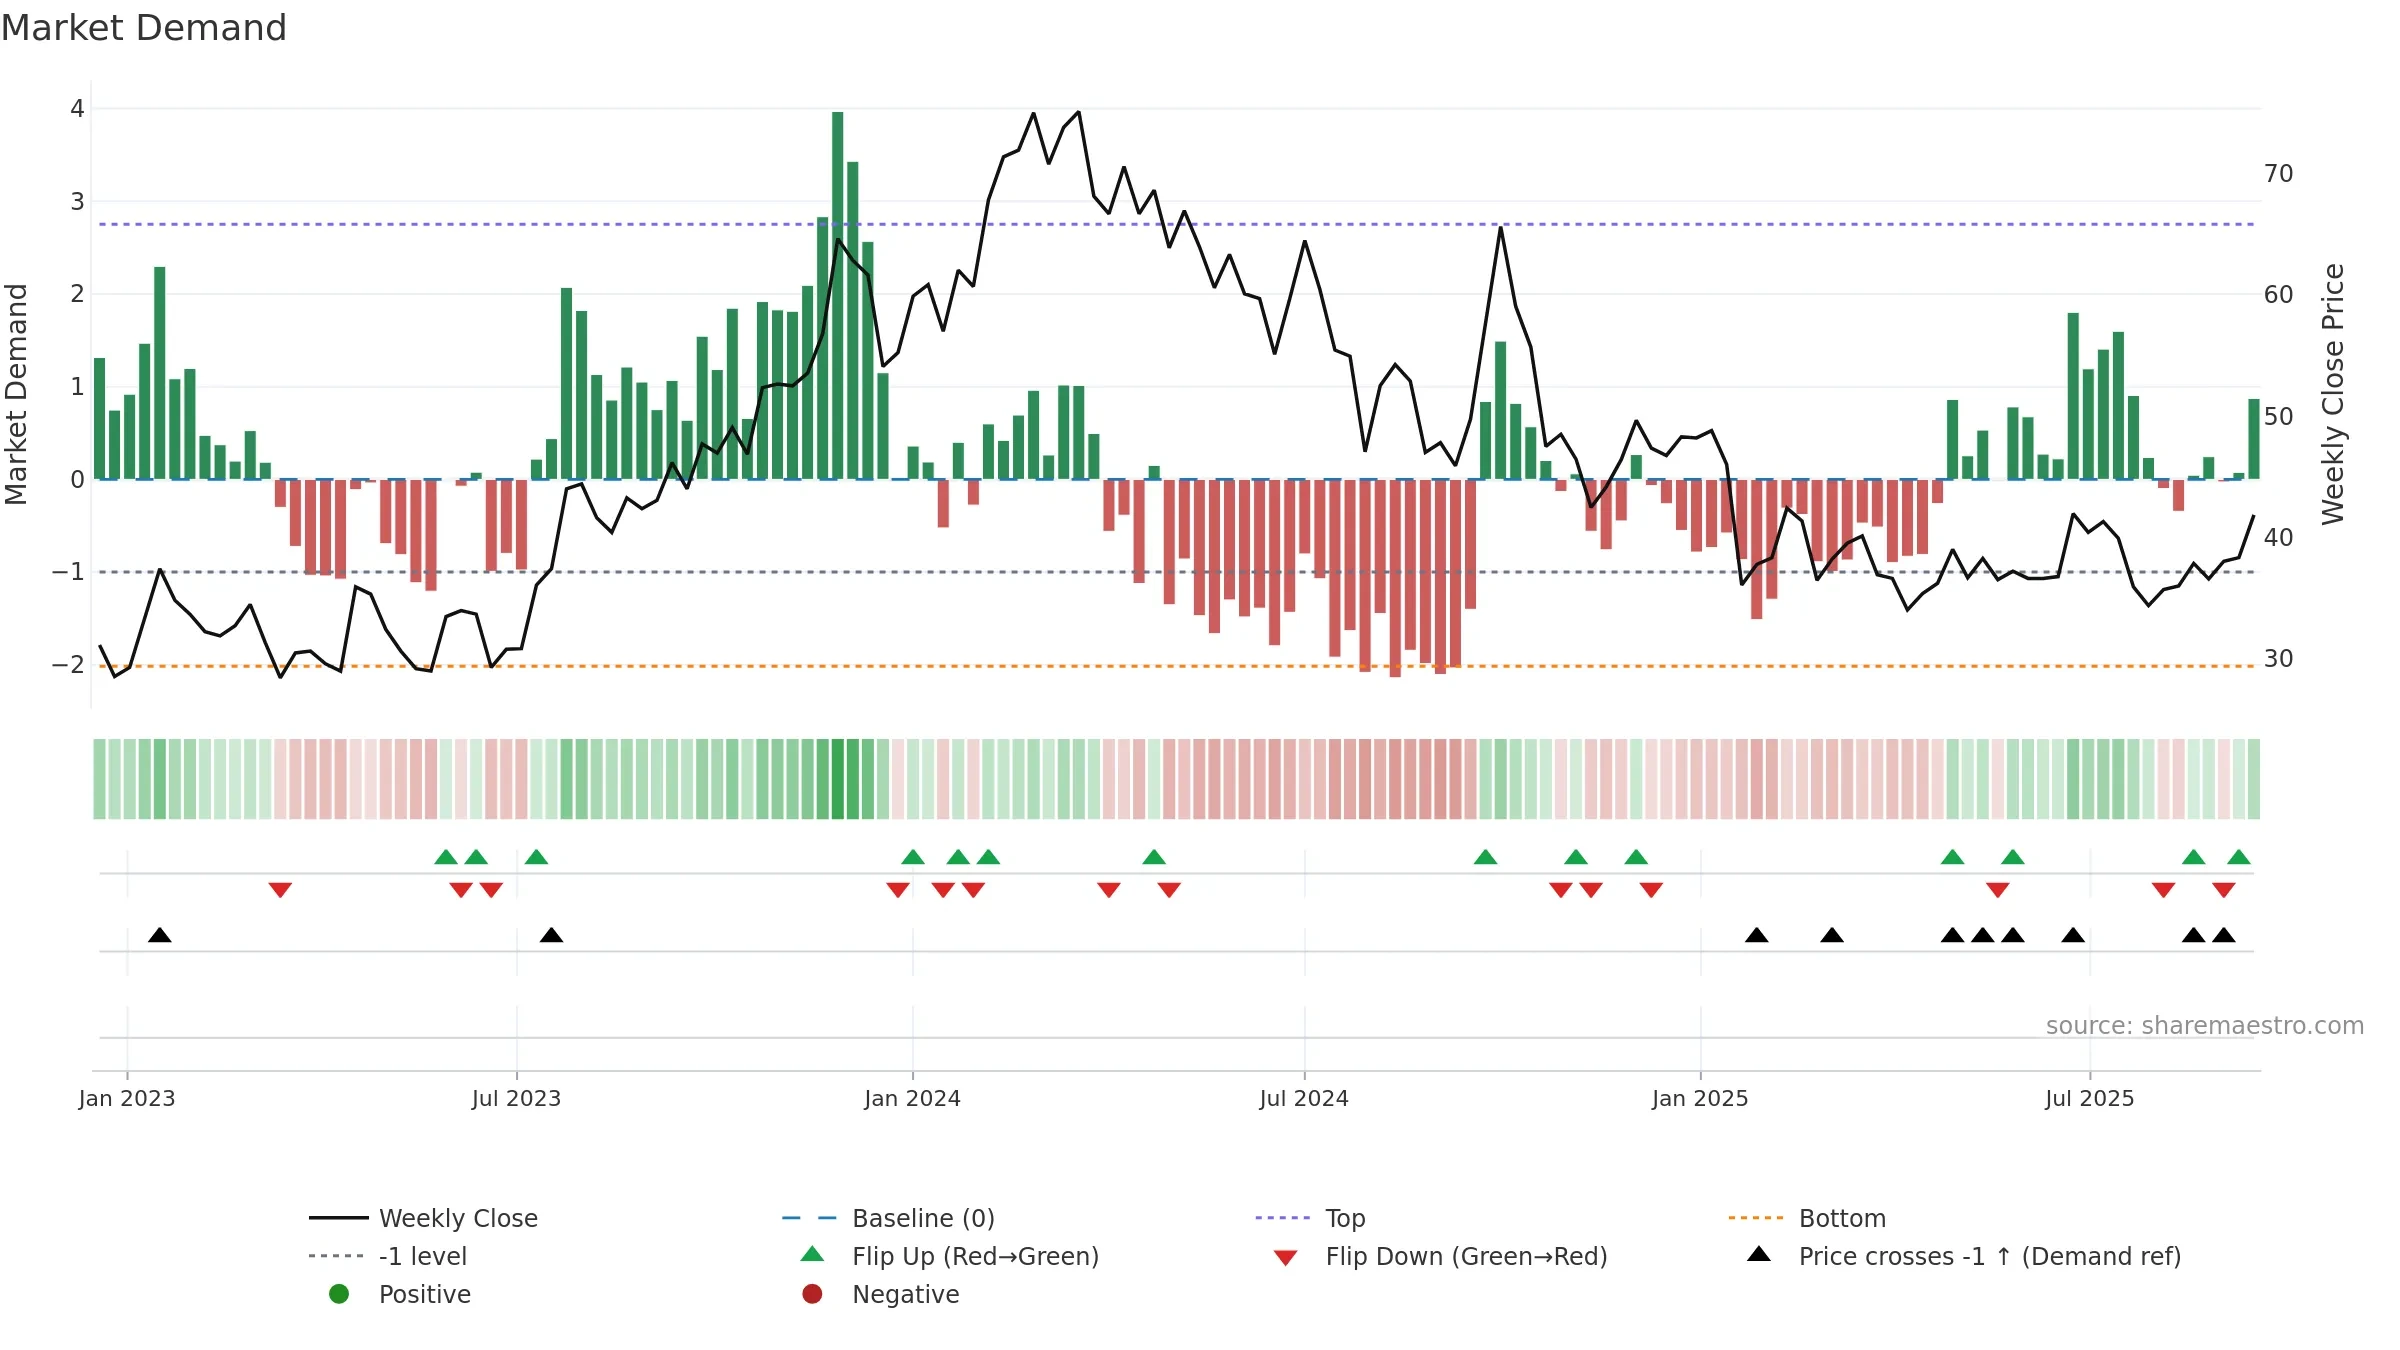
- Buyers step in at depressed levels (accumulation)
- Liquidity diverges from price
Why: Price window 21.80% over 8w. Close is 9.19% above the prior-window high. Volume trend falling. Liquidity divergence with price. Trend state range / neutral. Low-regime (≤0.25) upticks 4/4 (100.0%) • Accumulating. Momentum neutral and rising.
Tip: Most metrics include a hover tooltip where they appear in the report.