Beijing Baolande Software Corporation
688058 SHA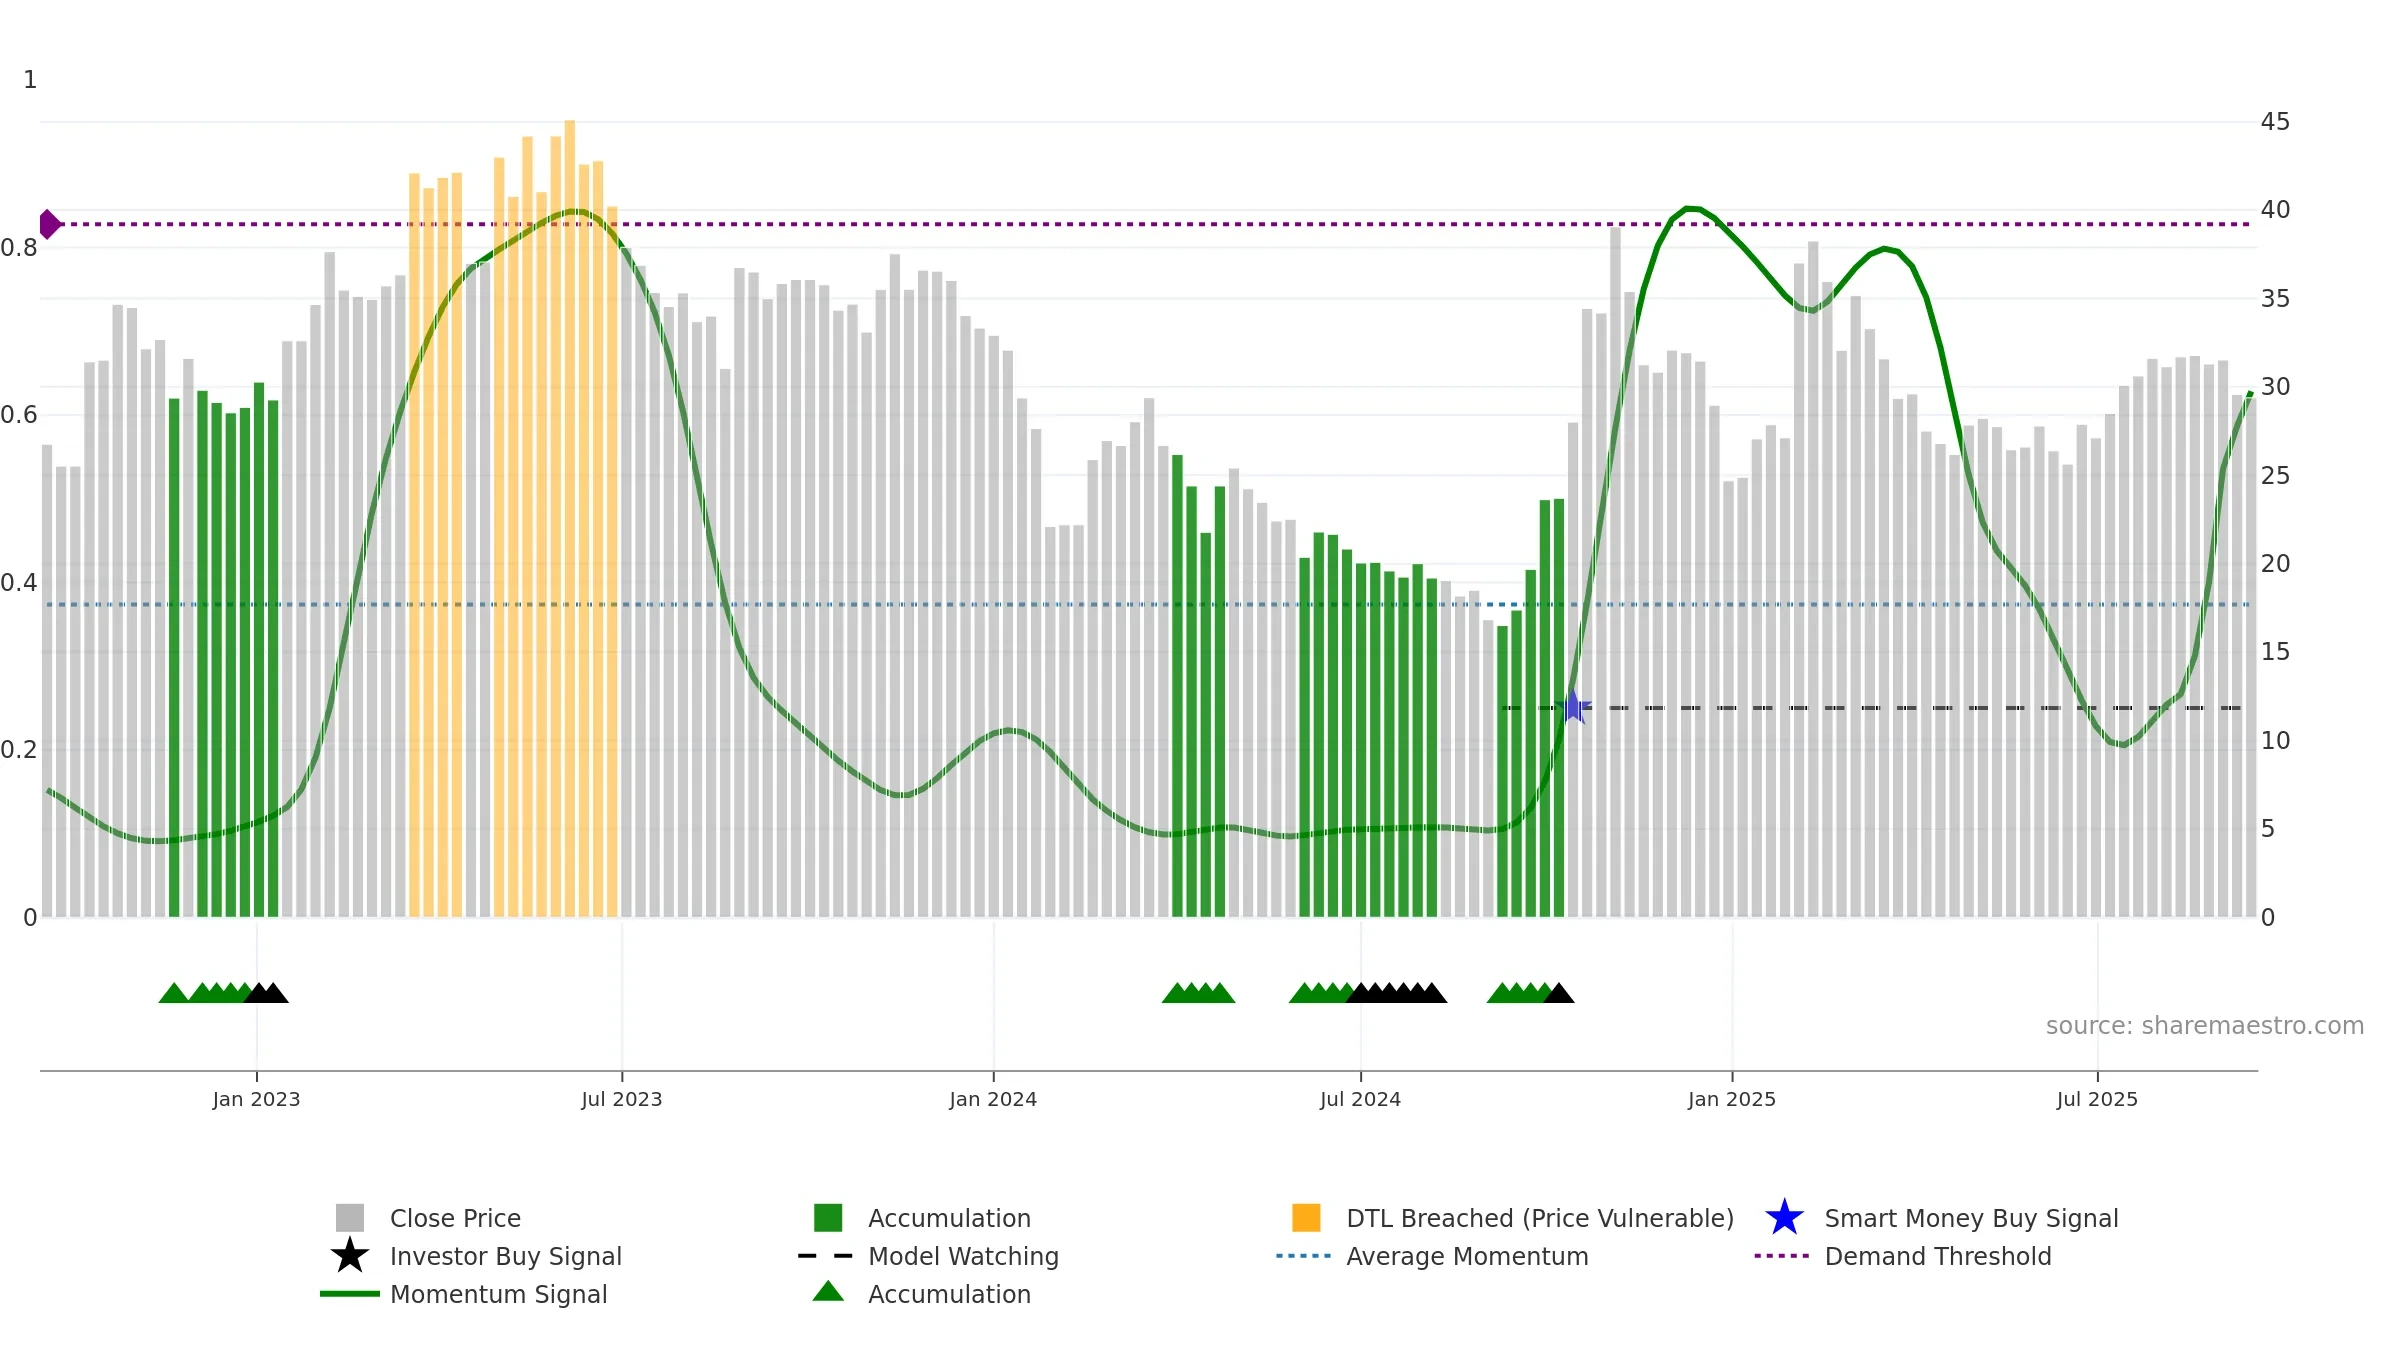
Weekly Report
Beijing Baolande Software Corporation closed at 29.3800 (-1.41% WoW) . Data window ends Mon, 15 Sep 2025.
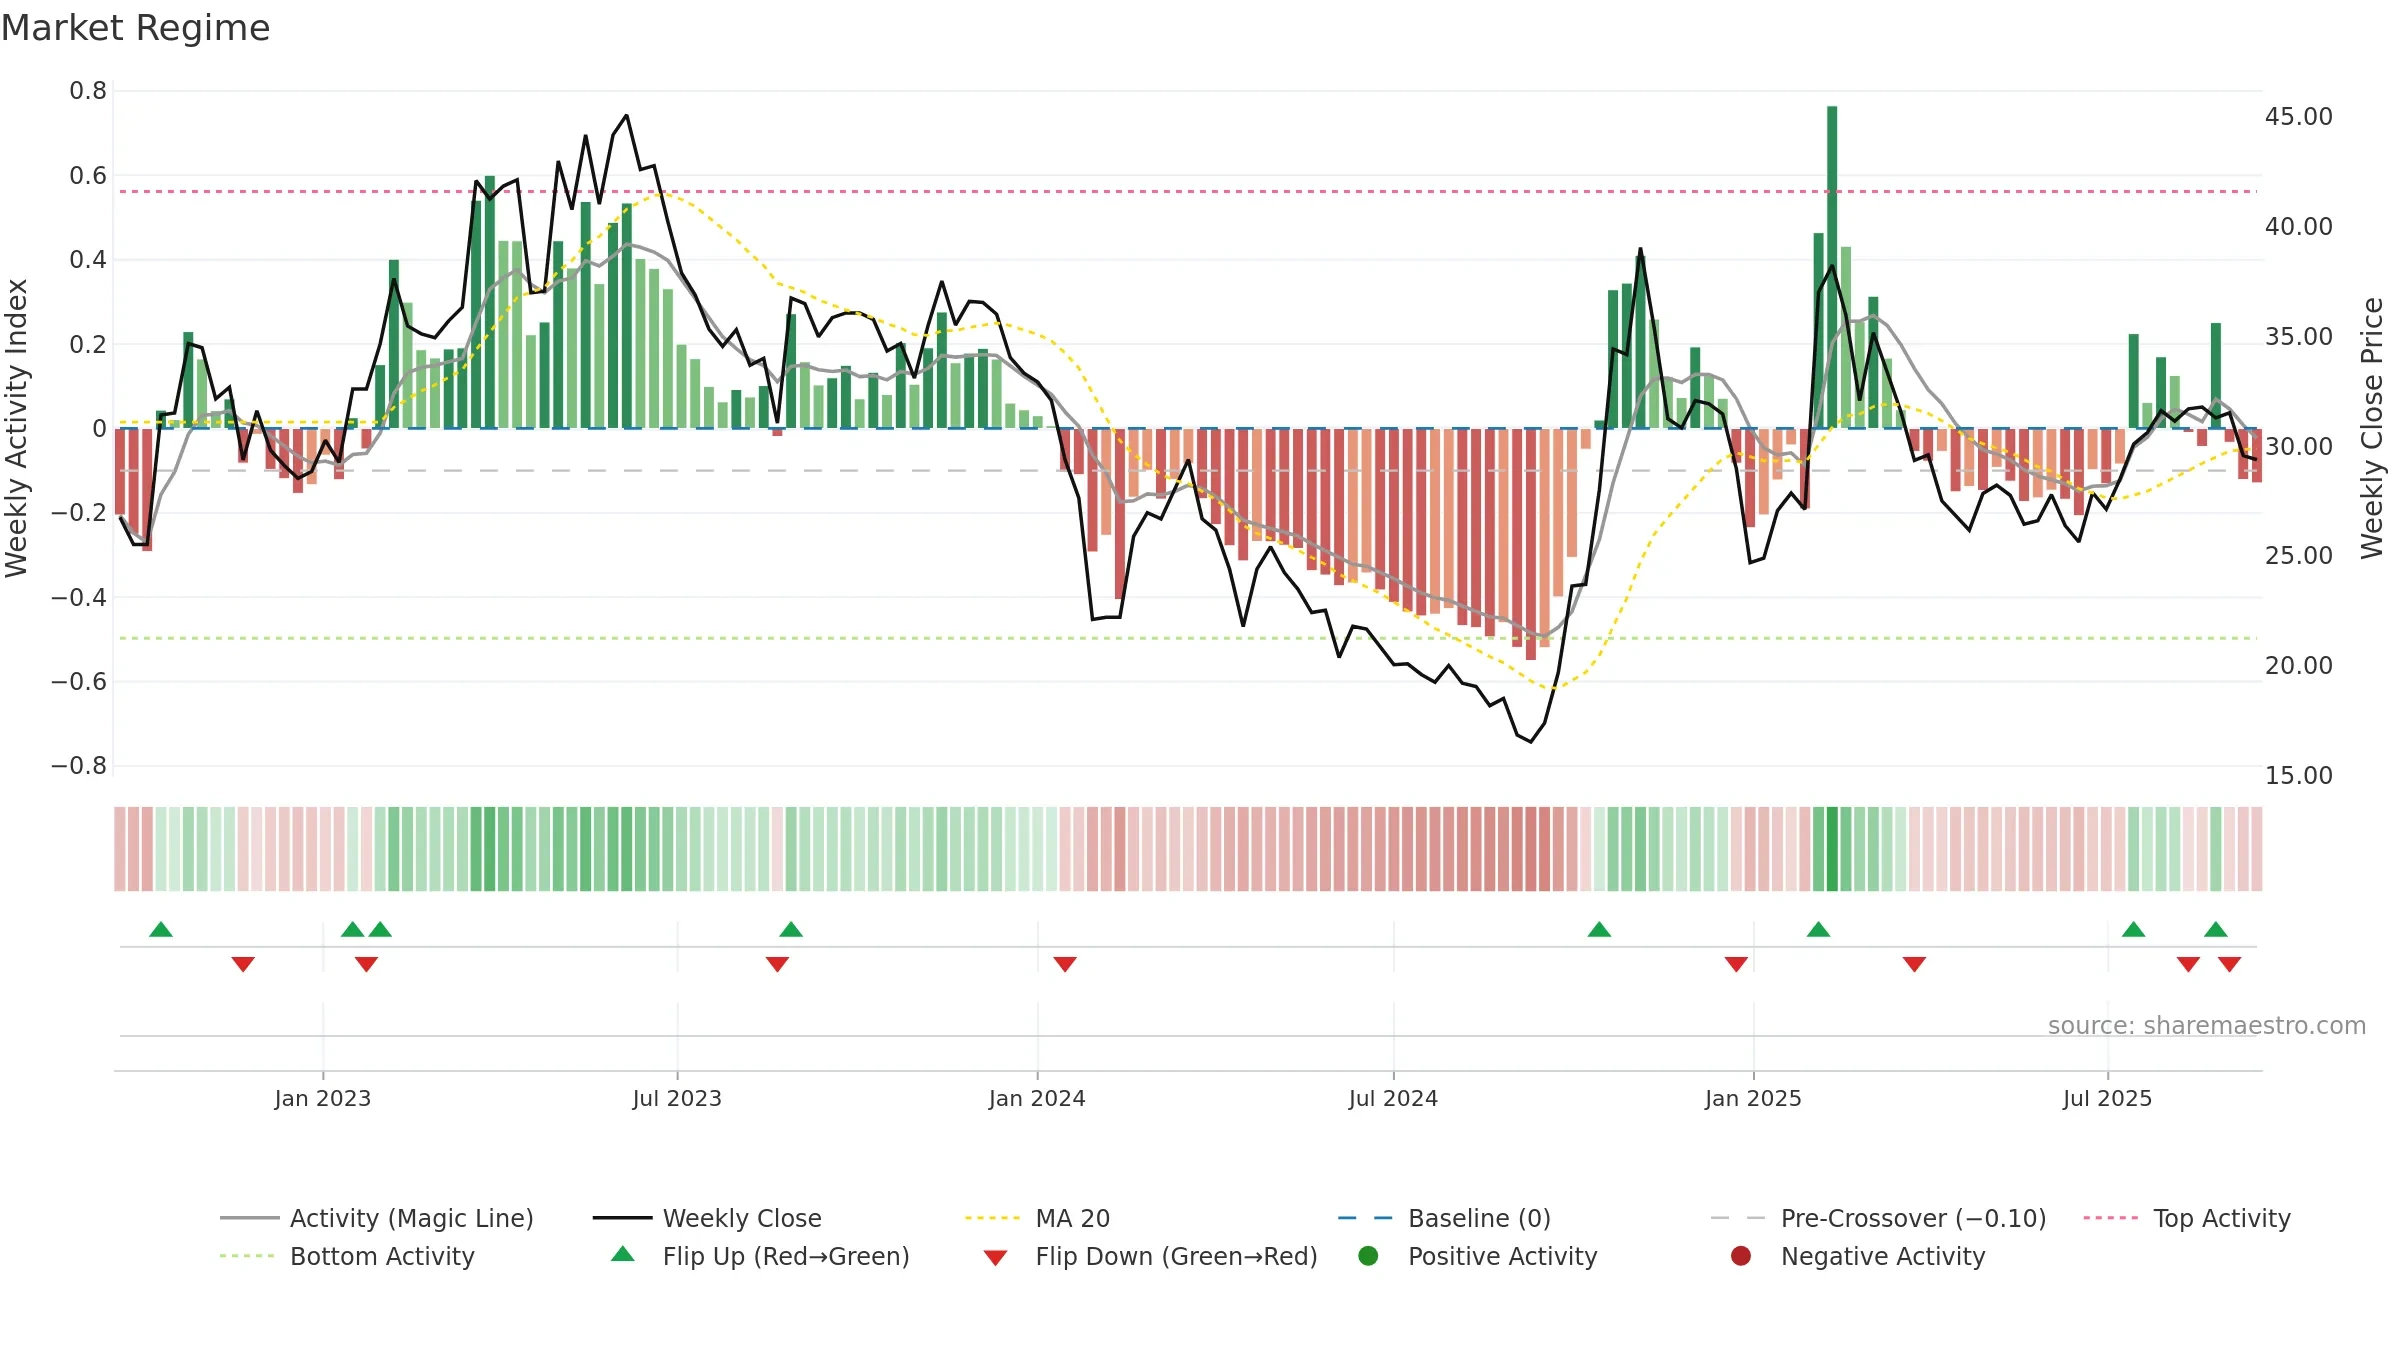
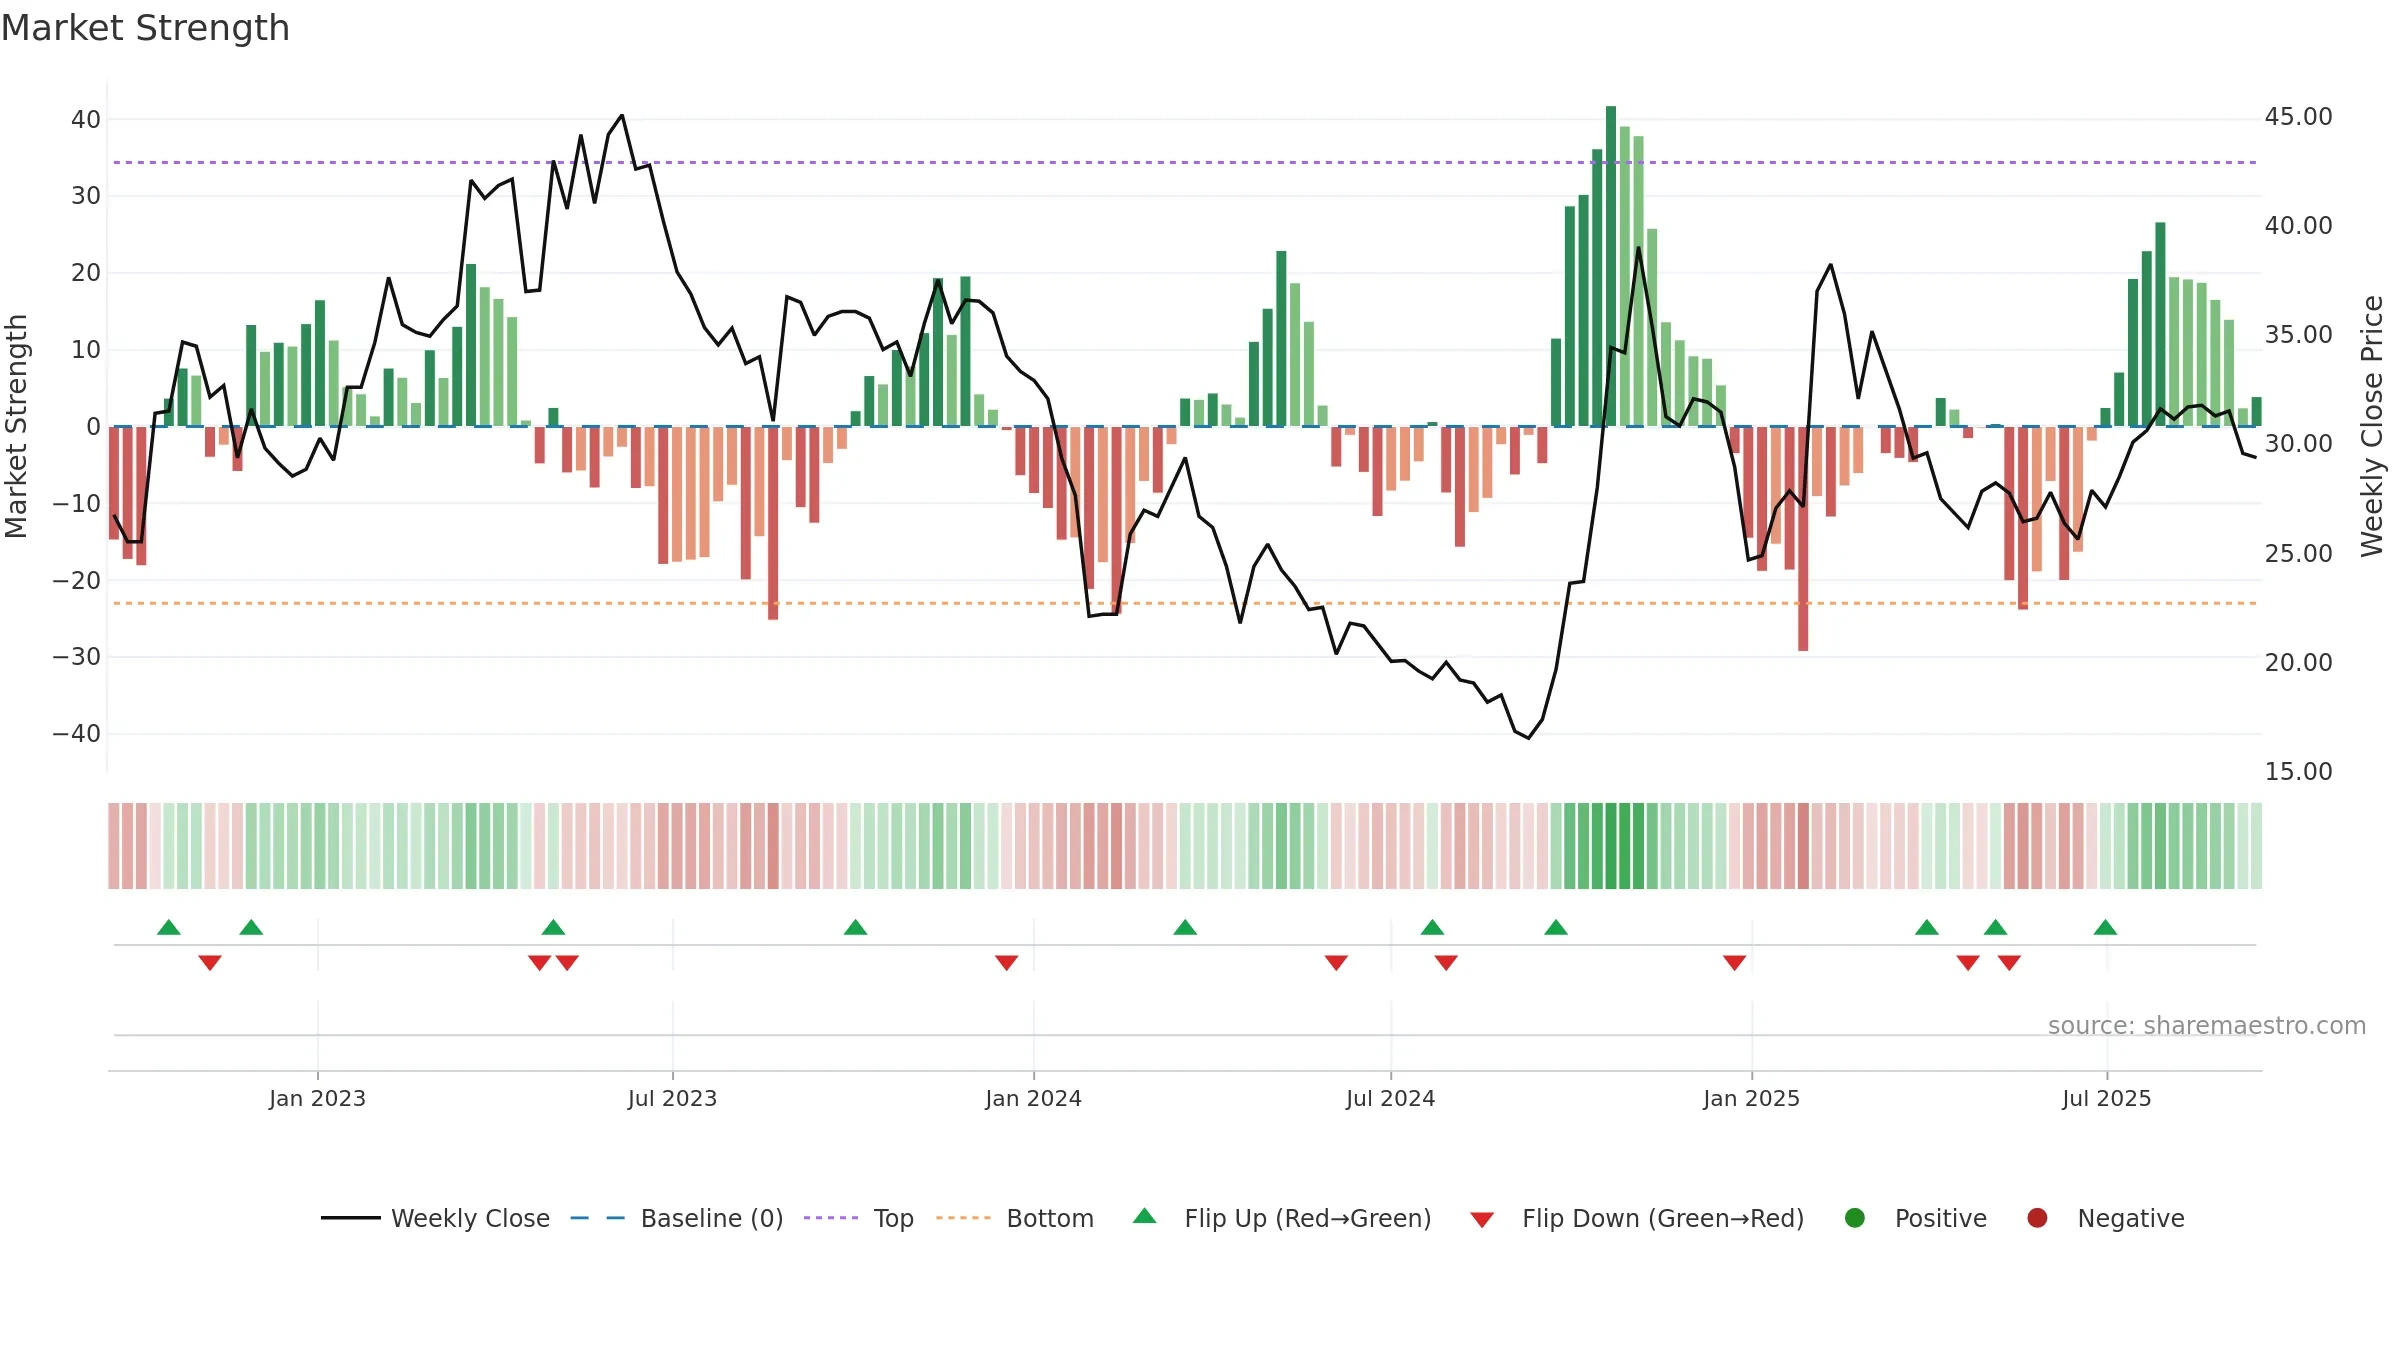
How to read this — Price slope is downward, indicating persistent supply pressure. Volume and price are moving in the same direction — a constructive confirmation. Returns are negatively correlated with volume — strength may come on lighter activity.
Down-slope argues for patience; rallies can fade sooner unless participation improves.
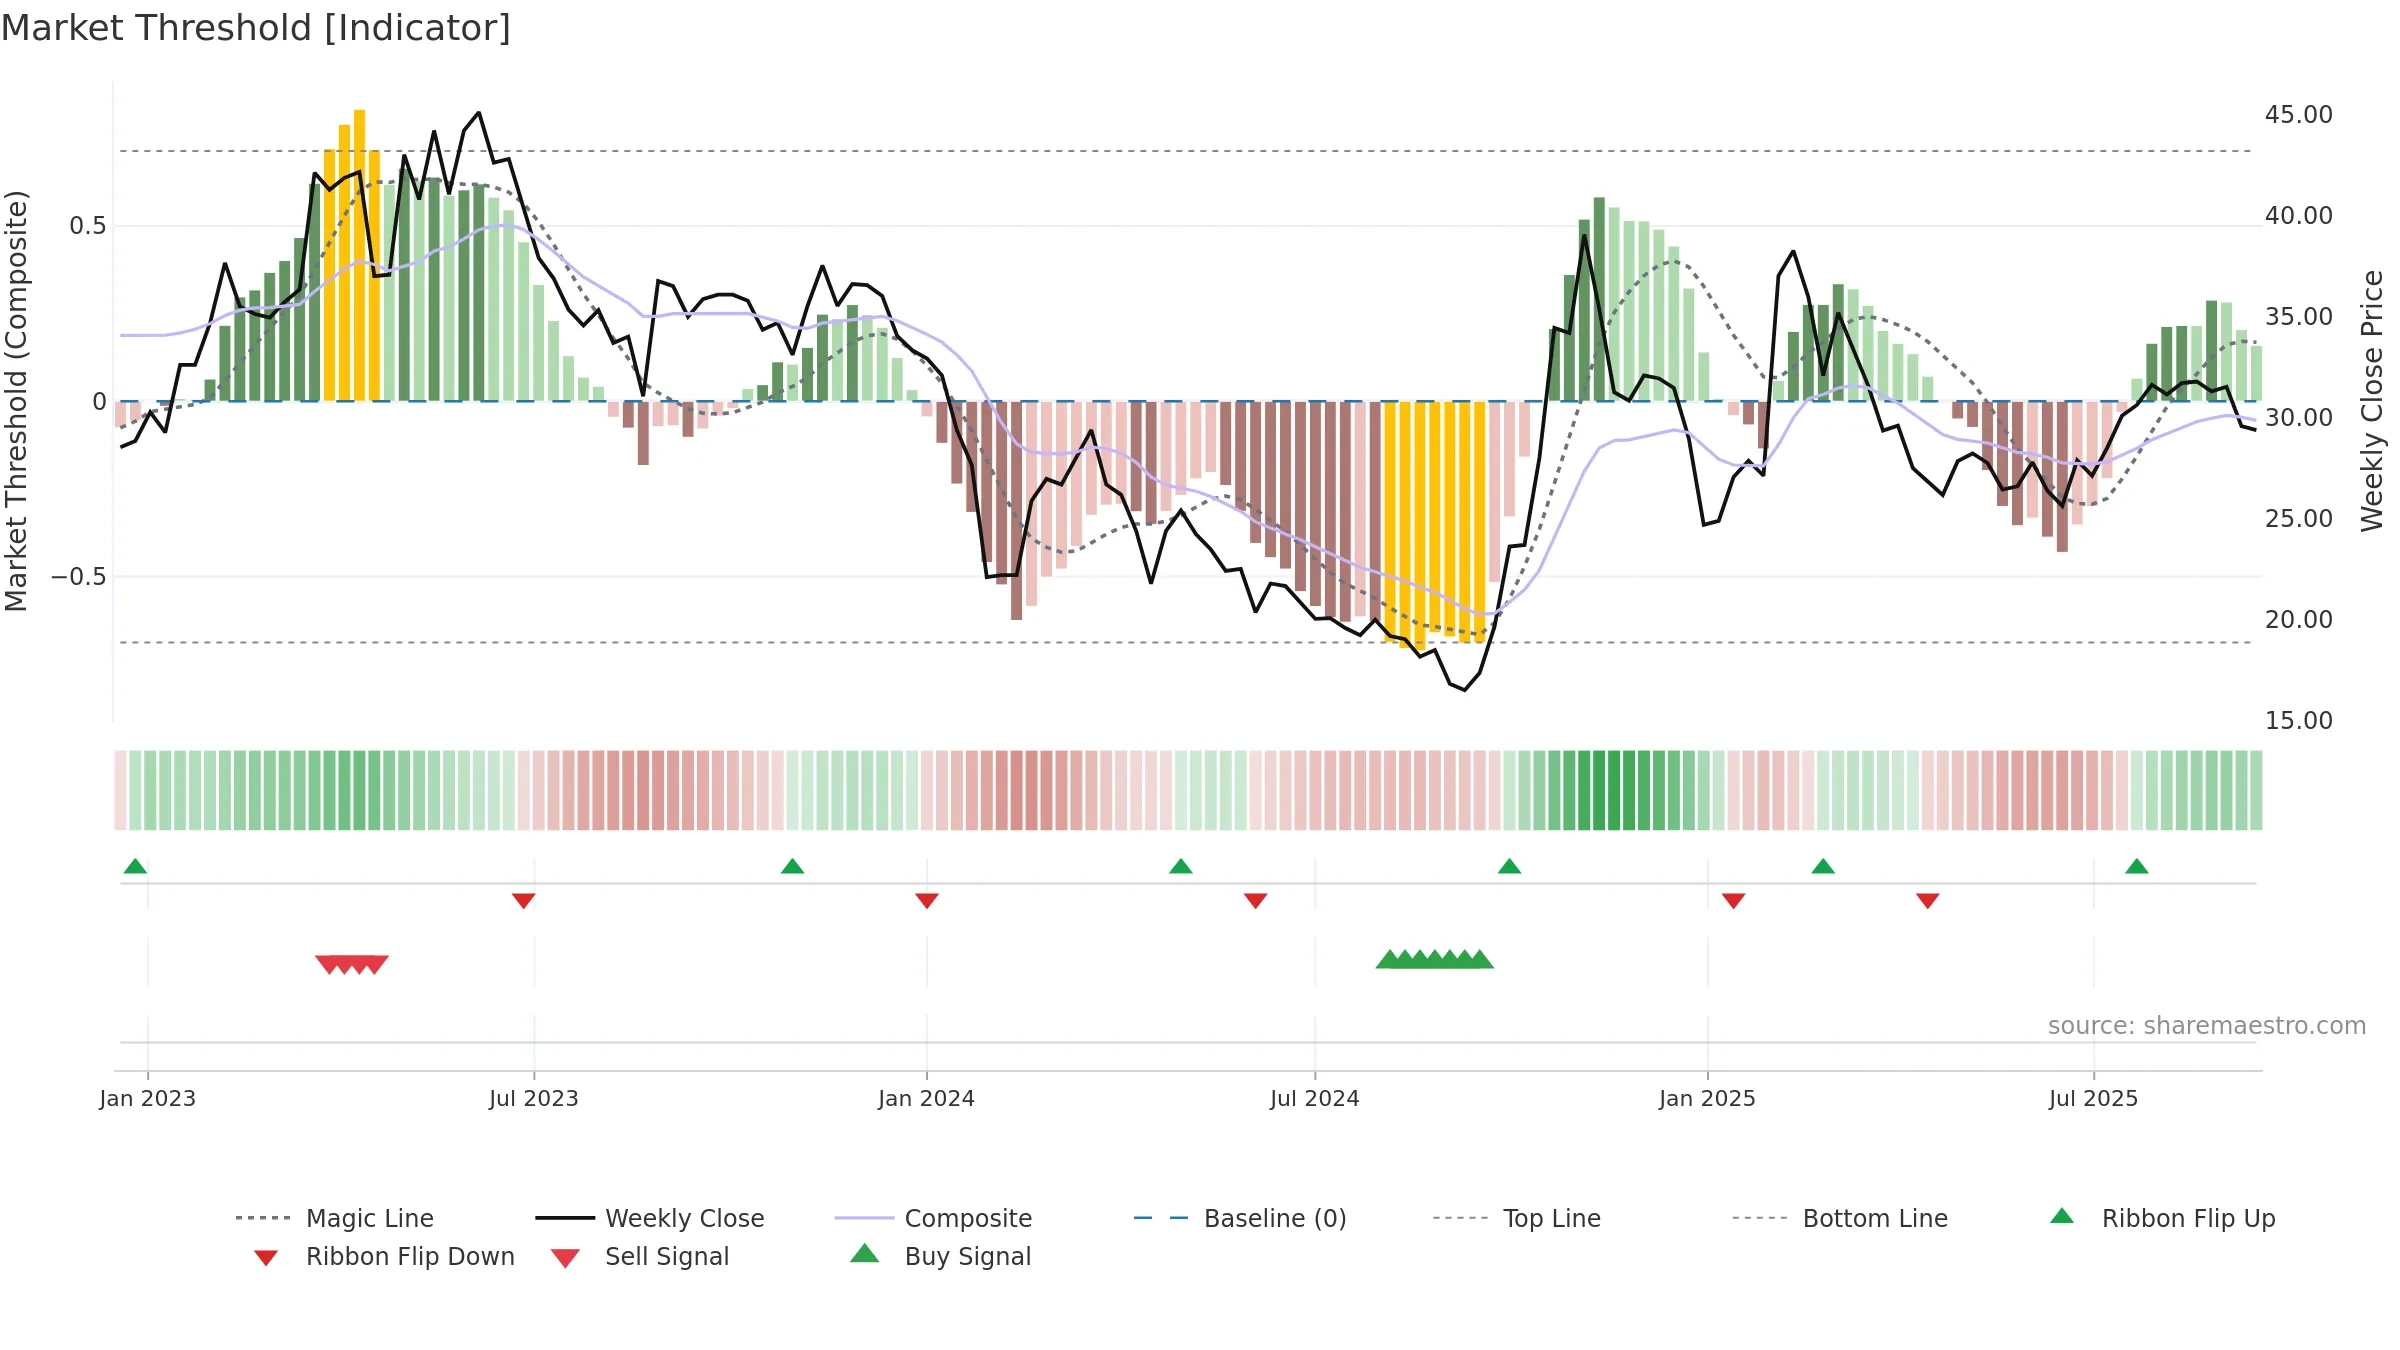
Gauge maps the trend signal to a 0–100 scale.
How to read this — High gauge and rising momentum — buyers in control.
Bias remains higher; pullbacks could be buyable if participation holds.
Conclusion
Positive setup. ★★★★☆ confidence. Price window: -7. Trend: Strong Uptrend; gauge 62. In combination, liquidity confirms the move.
- High gauge with rising momentum (strong uptrend)
- Momentum is bullish and rising
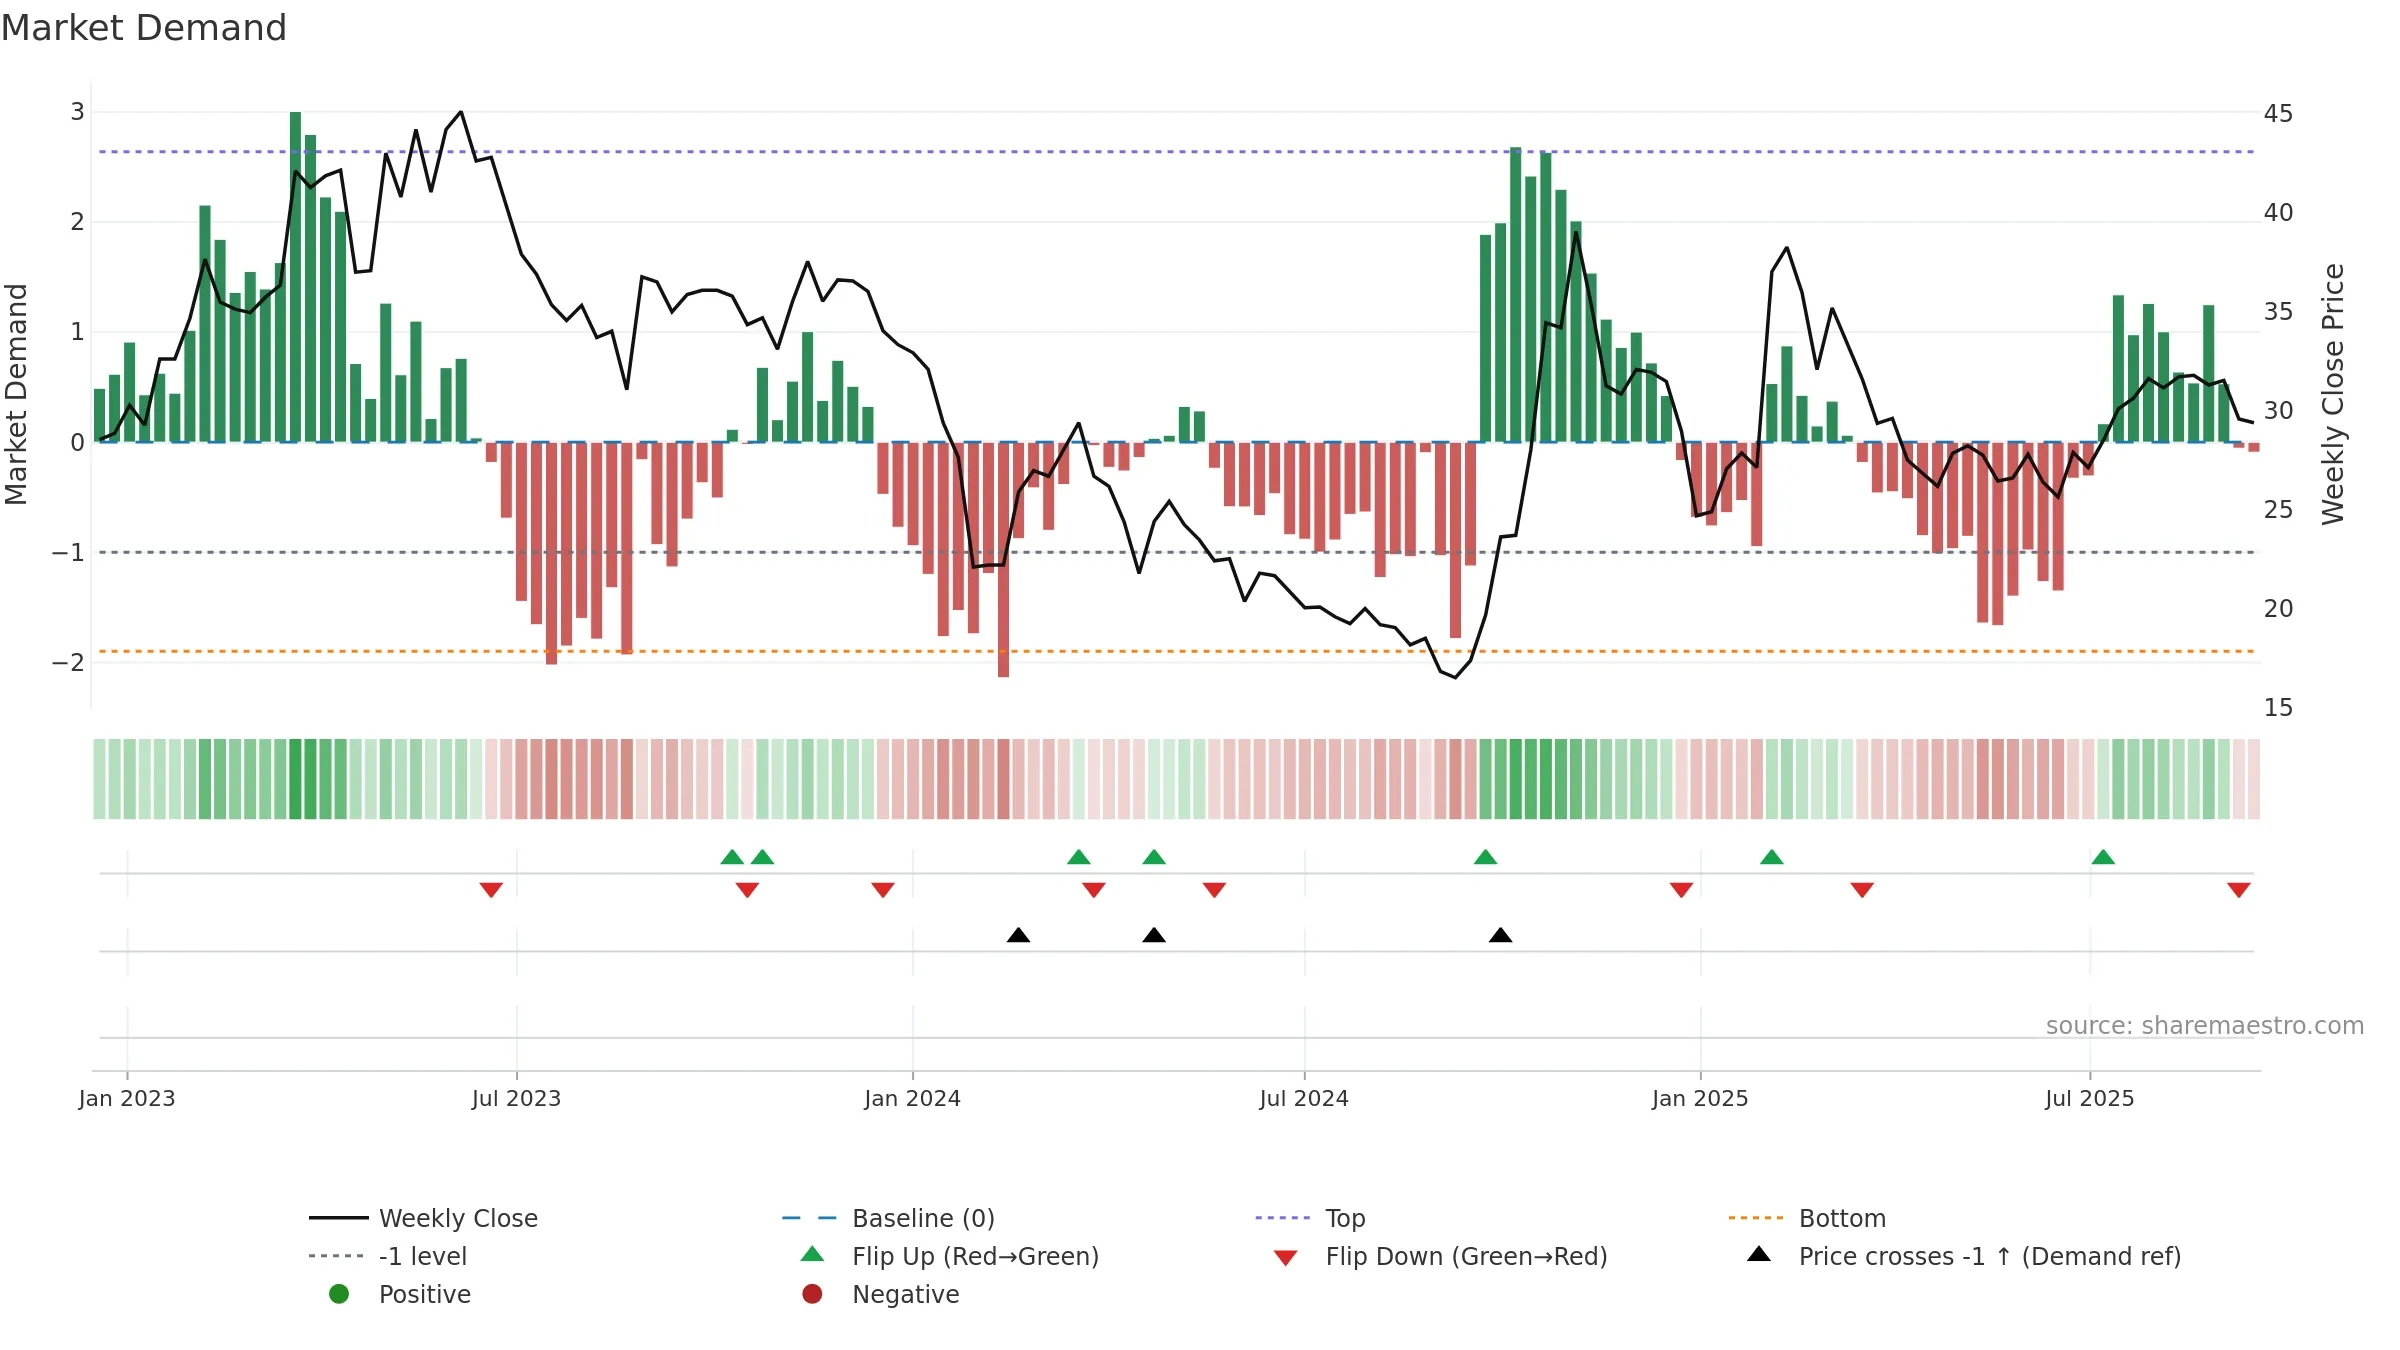
- Liquidity confirms the price trend
- Price is not above key averages
- Negative multi-week performance
Why: Price window -7.08% over 8w. Close is -7.55% below the prior-window high. Volume trend falling. Liquidity convergence with price. Trend state strong uptrend. Momentum bullish and rising.
Tip: Most metrics include a hover tooltip where they appear in the report.