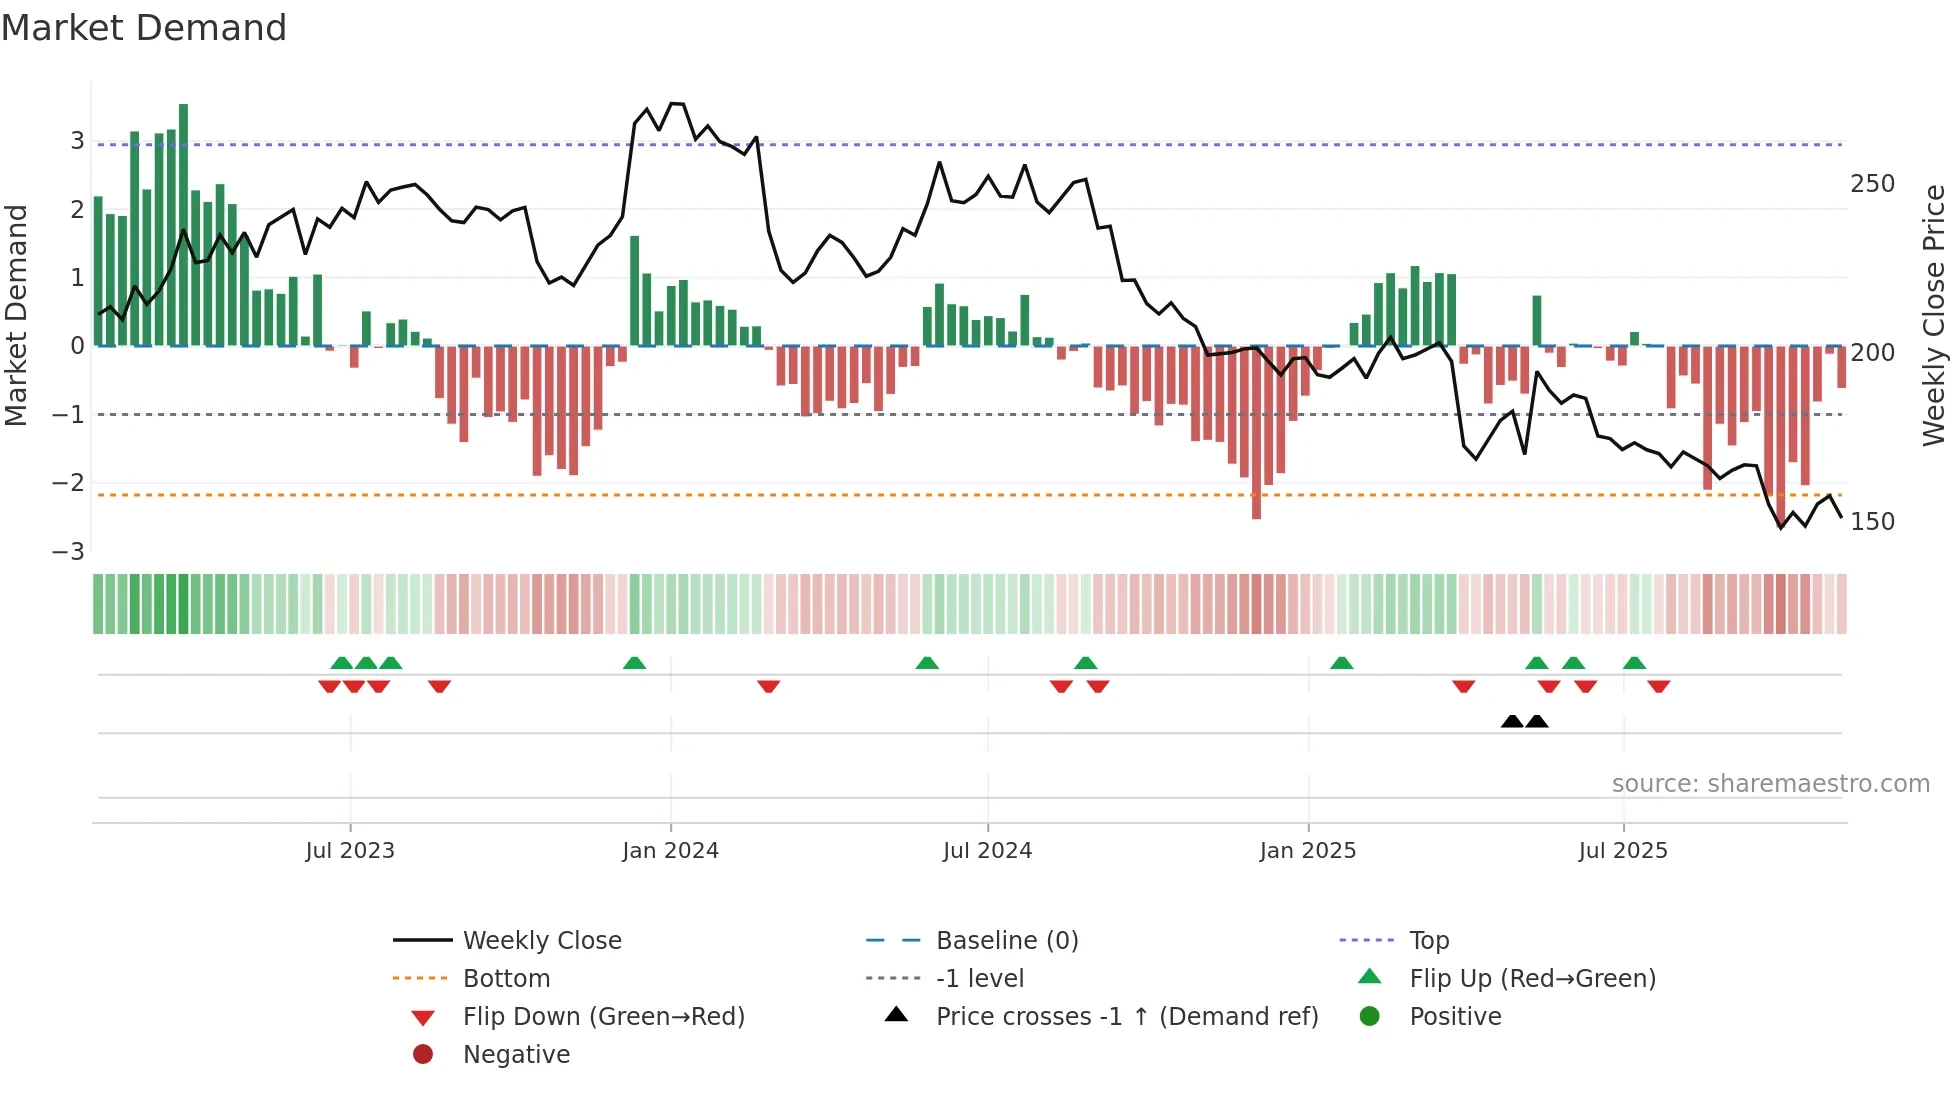
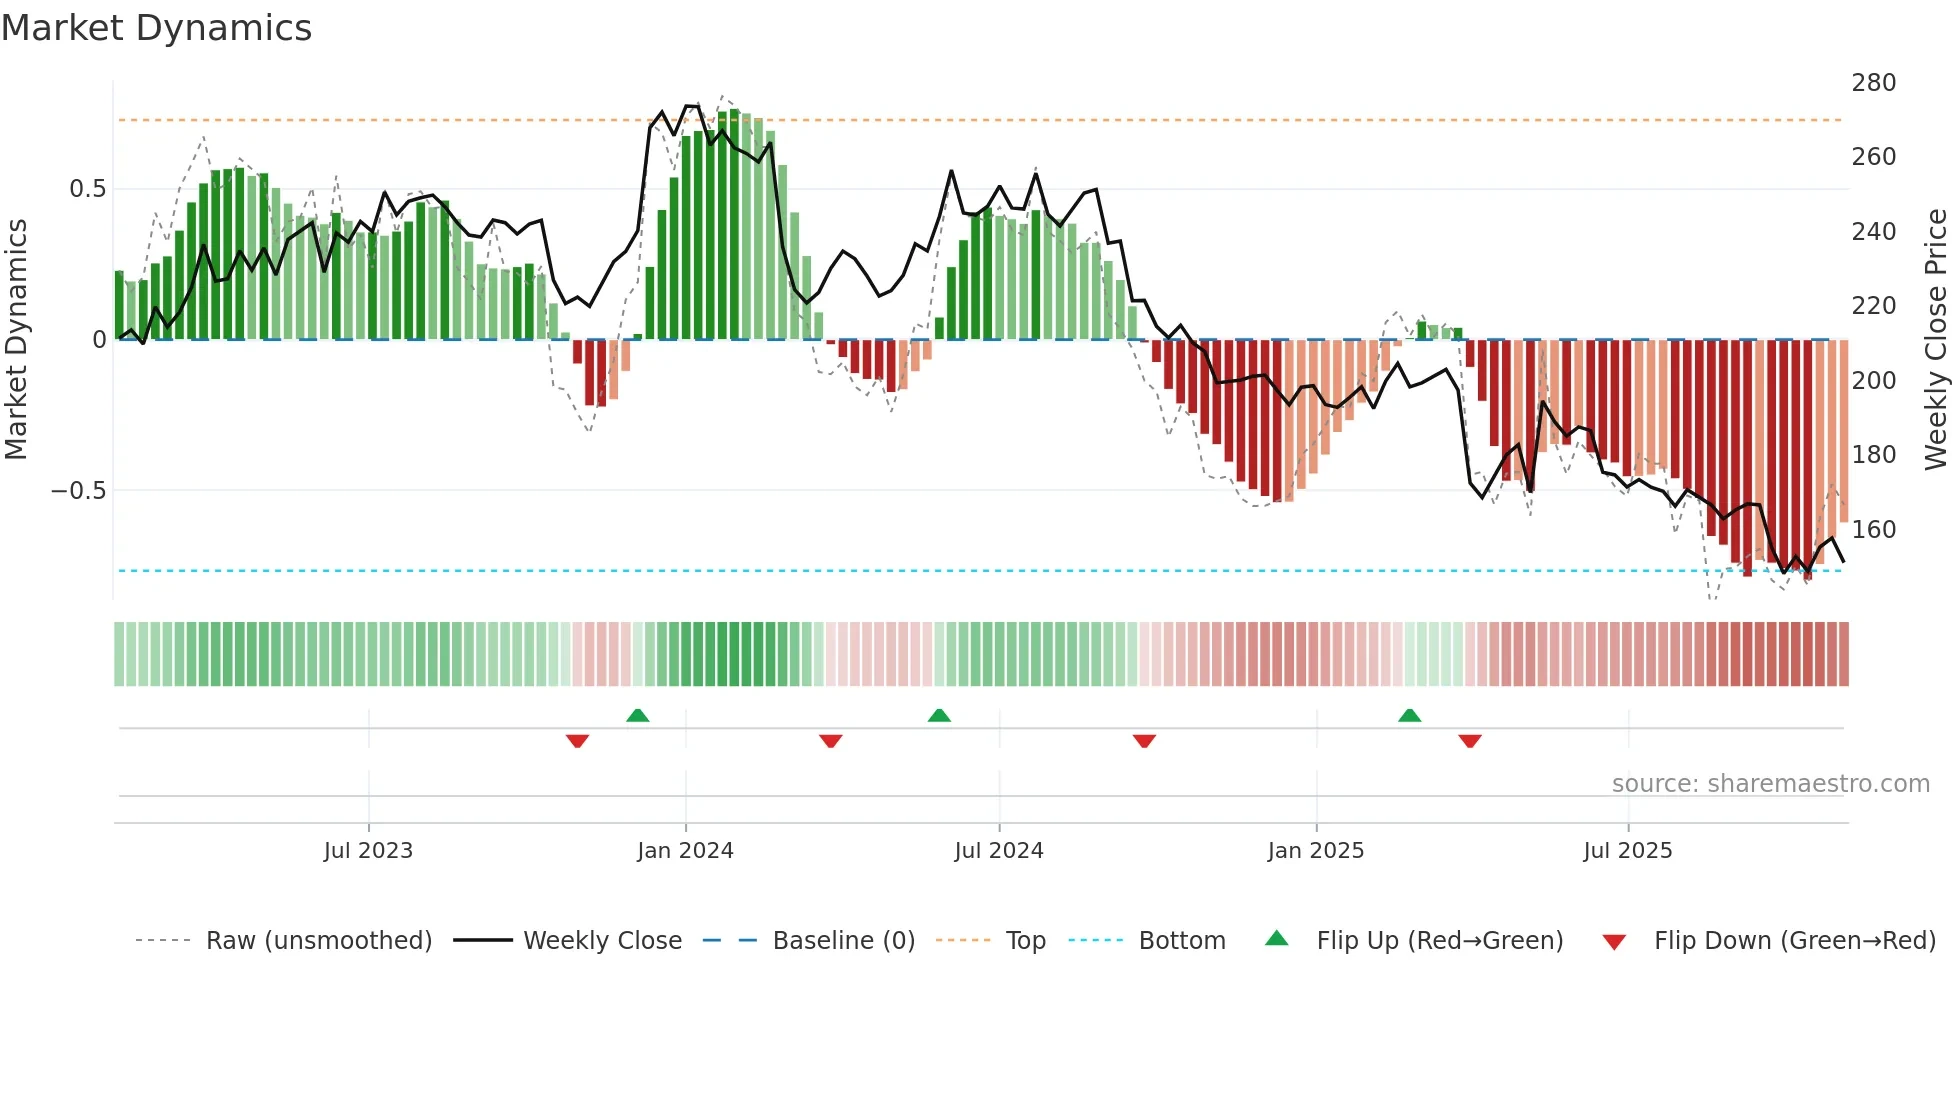
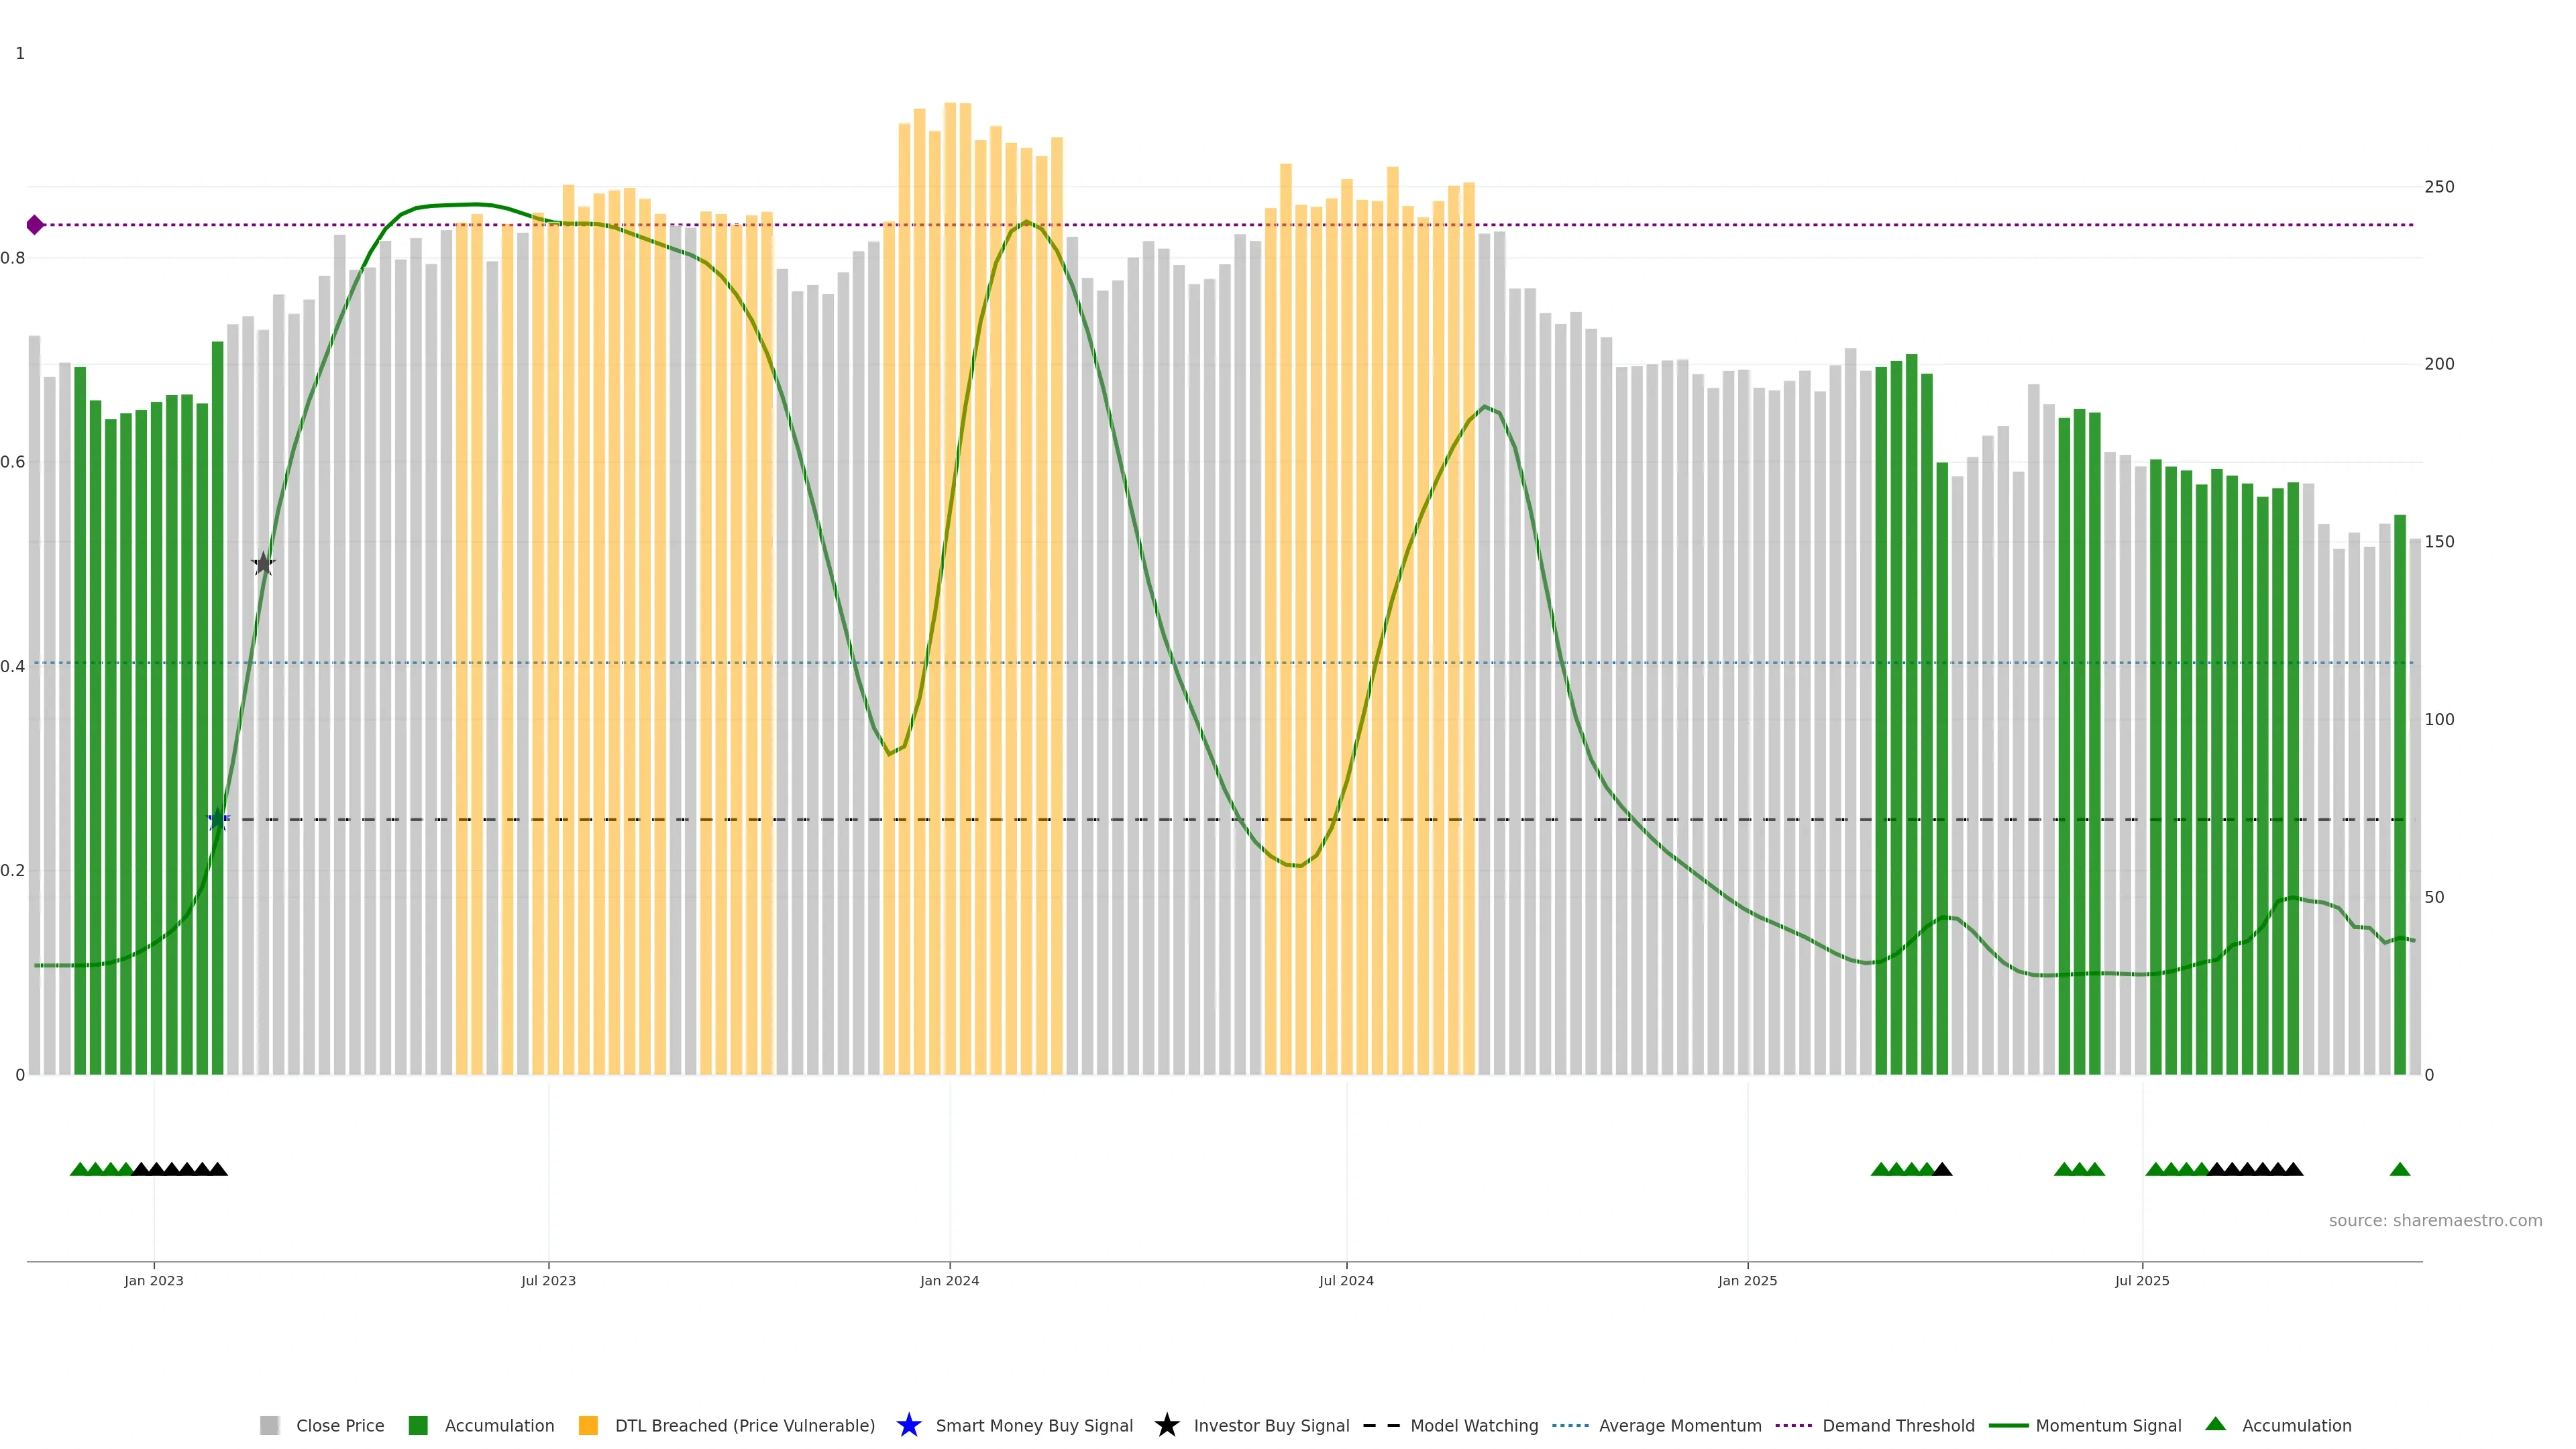
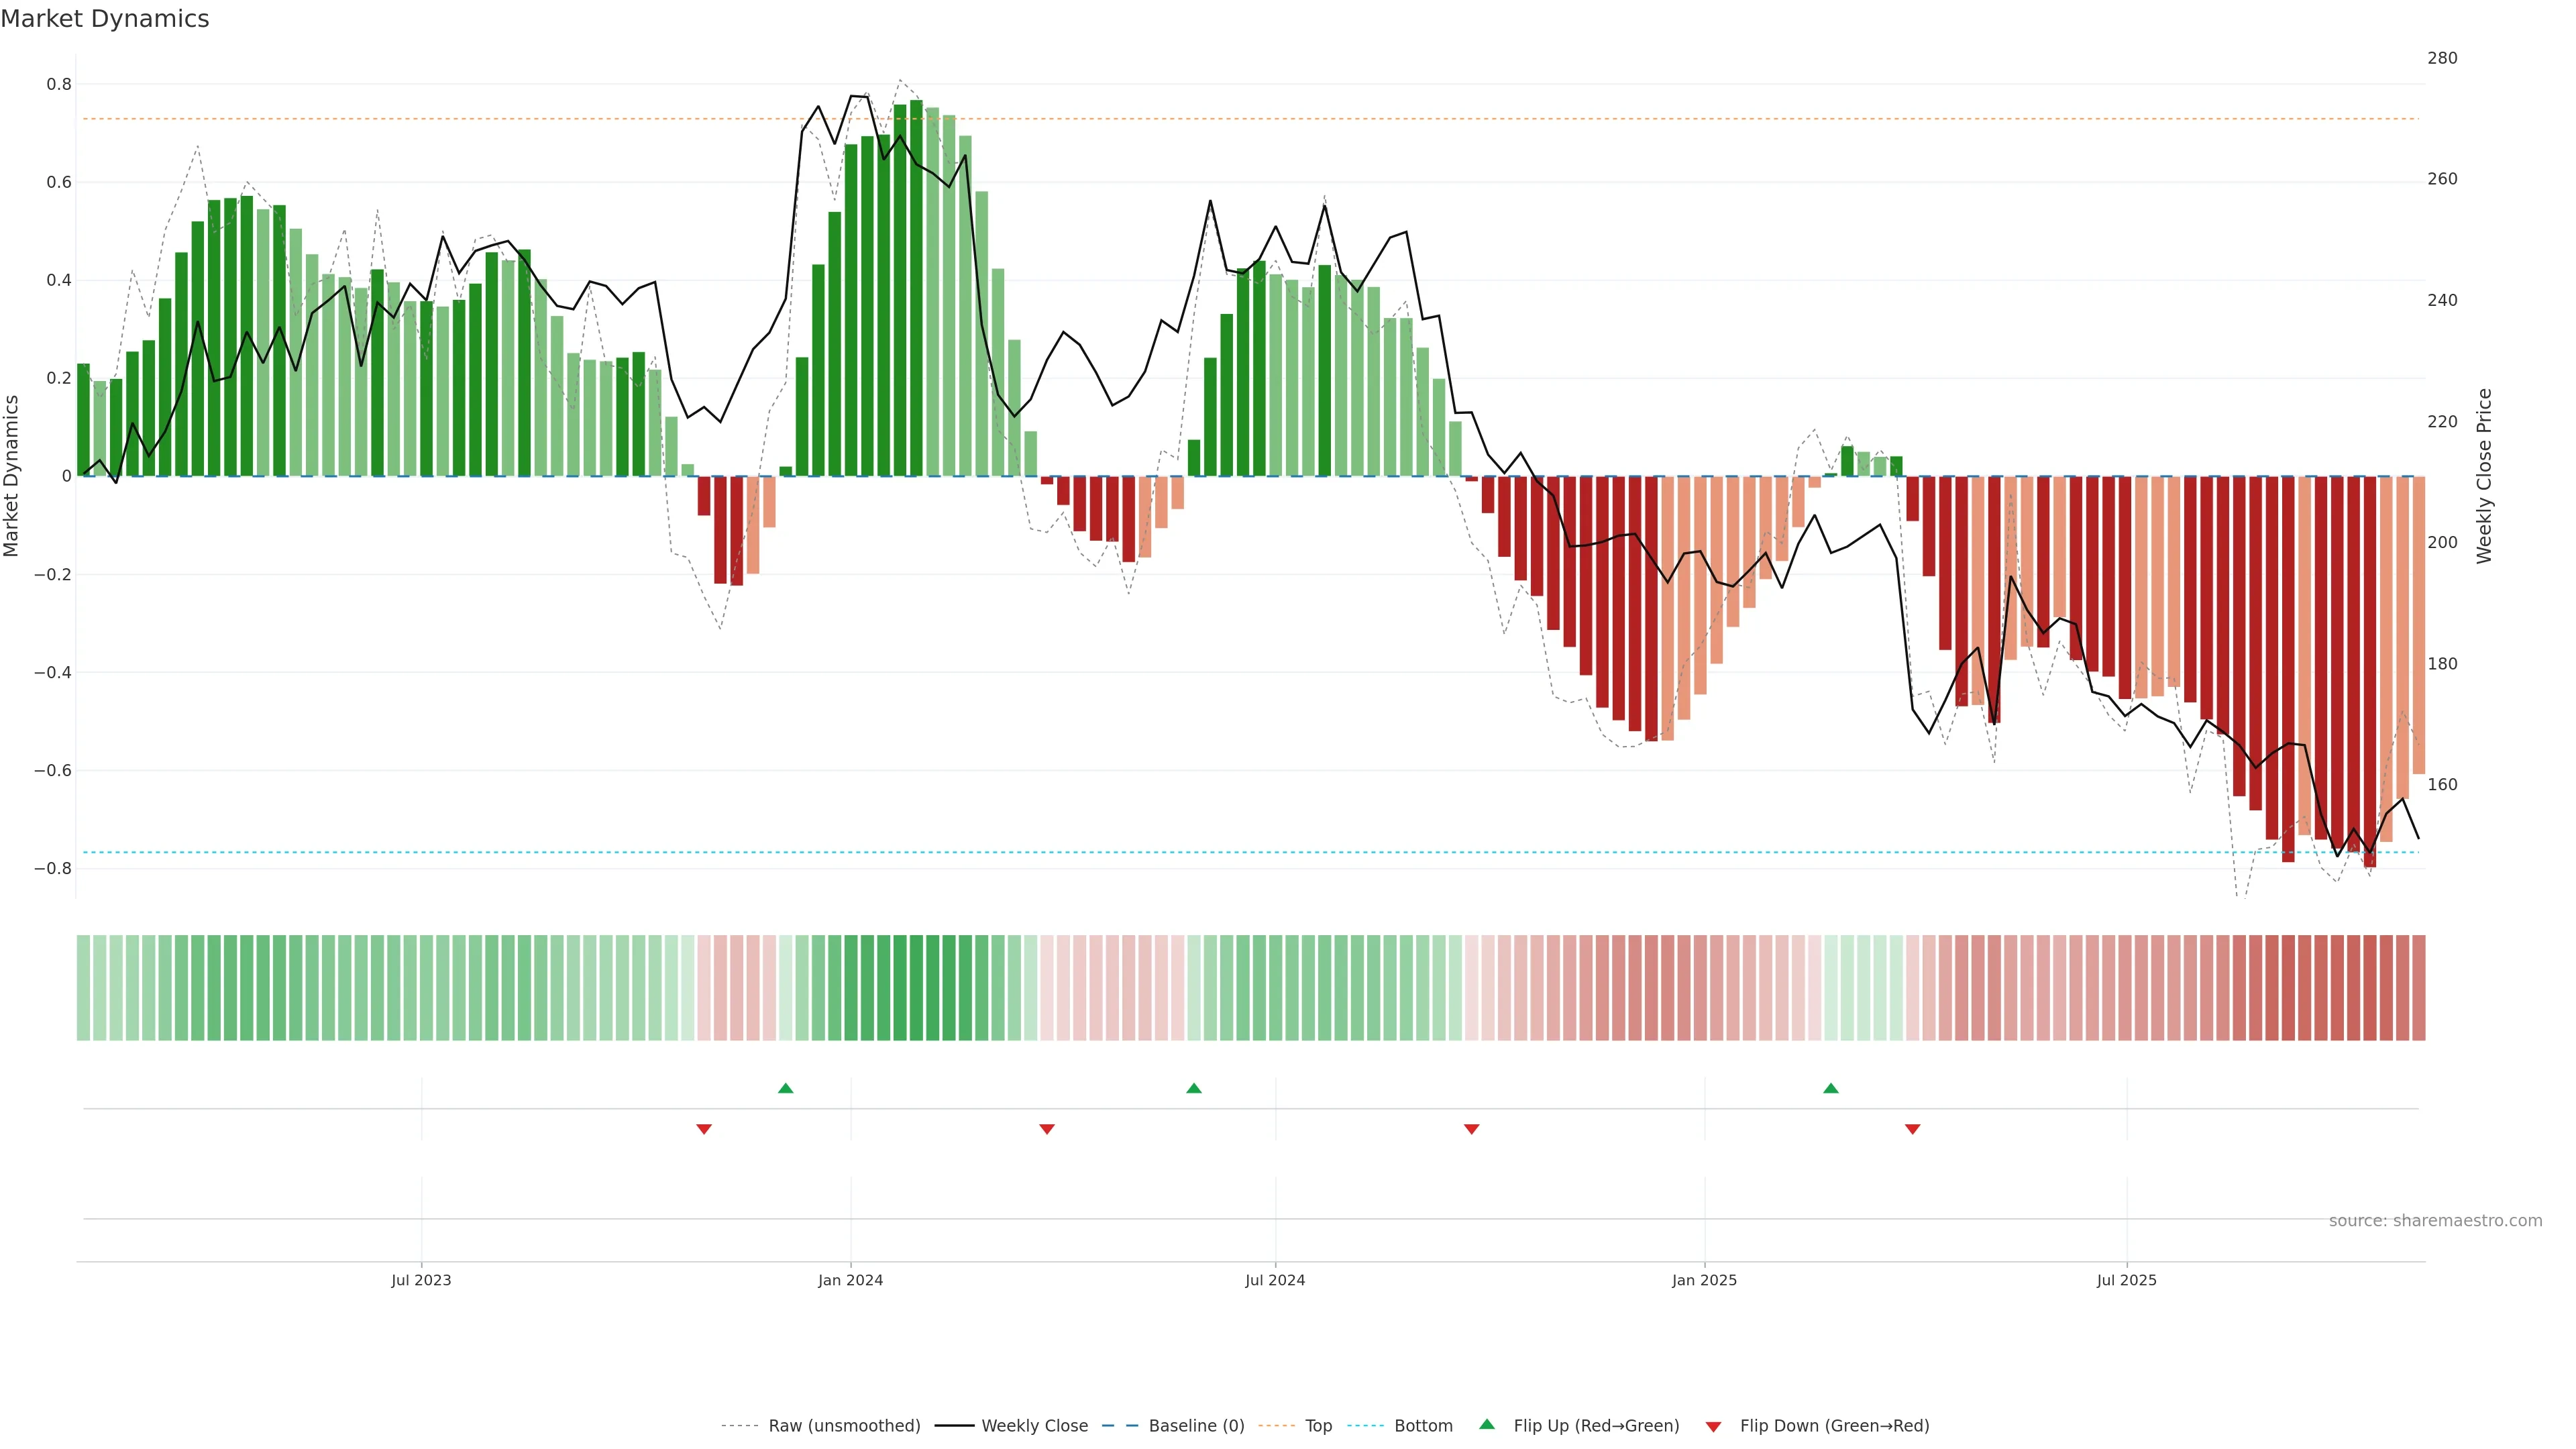
No results found.

Kuehne + Nagel International AG

KNIN SWX

Week Ending
Mon, 15 Sep 2025
Open
165.5500
Close
166.5500
High
167.2500
Low
164.9500
Trend
0.17035
Sharemaestro [Charts]
KNIN weekly Smart Money chart, closing 2025-09-15.
KNIN weekly Market Snapshot chart, closing 2025-09-15.
KNIN weekly Market Cycle chart, closing 2025-09-15.
KNIN weekly Market Demand chart, closing 2025-09-15.
KNIN weekly Market Strength chart, closing 2025-09-15.
KNIN weekly Activity chart, closing 2025-09-15.
KNIN weekly Market Dynamics chart, closing 2025-09-15.
KNIN weekly Market Threshold chart, closing 2025-09-15.

Weekly Report

Kuehne + Nagel International AG (KNIN) Week Ending: Mon, 15 Sep 2025 โ˜…โ˜…โ˜…โ˜…โ˜†
Weekly Report
Price
Weekly Close

Kuehne + Nagel International AG closed at 166.5500 (0.60% WoW) . Data window ends Mon, 15 Sep 2025.

Price Window0.18% over 8w
Volume TrendFalling
Vs 8w High-2.40%
MA StackWeak
Price vs MAsBelow
What stands out

How to read this โ€” Price slope is downward, indicating persistent supply pressure. Volume and price are moving in the same direction โ€” a constructive confirmation. Weak MA stack argues for caution; rallies can fail near the 8โ€“13 week region. Price sits below key averages, keeping pressure on the tape.

What to watch

Down-slope argues for patience; rallies can fade sooner unless participation improves.

Trend
Sharemaestro Trend Line

Gauge maps the trend signal to a 0โ€“100 scale.

Gauge Reading17.0/100
DirectionRising
Accelerationdecelerating
Gauge VolatilityLow
Trend StateRange / Neutral
Low-Regime Accumulation 6/7 (86.0%) โ€ข Accumulating
What stands out

How to read this โ€” Range-bound conditions; conviction is limited until a break or acceleration emerges.

What to watch

Wait for a directional break or improving acceleration.

Valuation Model Snapshot Sun, 07 Sep 2025
Target 233.99
Current163.80
RatingDeeply Undervalued
Interpretation

Price is below fair value; potential upside if momentum constructive.

Conclusion

Positive โ˜…โ˜…โ˜…โ˜…โ˜†

Positive setup. โ˜…โ˜…โ˜…โ˜…โ˜† confidence. Price window: 0. Trend: Range / Neutral; gauge 17. In combination, liquidity confirms the move.

Strengths
  • Liquidity confirms the price trend
  • Buyers step in at depressed levels (accumulation)
Watch-outs
  • Price is not above key averages
  • Weak moving-average stack

Why: Price window 0.18% over 8w. Close is -2.40% below the prior-window high. Volume trend falling. Liquidity convergence with price. Trend state range / neutral. Low-regime (โ‰ค0.25) upticks 6/7 (86.0%) โ€ข Accumulating. MA stack weak. Momentum neutral and rising. Valuation supportive skew.

Price Window Endpoint return over the last N weeks using weekly closes: (Closelast โˆ’ Closefirst)/Closefirst ร— 100.
Return Volatility Std-dev of weekly returns (%). Higher = choppier.
Volume Trend Slope of weekly volume across the window (rising / falling / flat).
Vs N-week High % distance of latest close from the highest close in the window.
Accumulation Weeks Weeks price rose on higher volume than the prior week.
Distribution Weeks Weeks price fell on higher volume than the prior week.
MA Stack Relative order of short/intermediate/long MAs. Short > long is constructive.
4โ€“8 Crossover Latest cross of 4-week vs 8-week MA (bullish / bearish / none).
Price vs MAs Whether the close is above/below key averages (8w & 26w).
Baseline Deviation % distance from the market-cycle baseline (fair-value track).
Gauge Reading Smoothed trend signal mapped to 0โ€“100.
Direction Slope sign of the gauge across the window (rising / falling).
Acceleration Change in the slope of the gauge (accelerating / decelerating).
Gauge Volatility Variability of the gauge (low / normal / high).
Zone Label Classification by level (Bullish / Neutral / Bearish).
Target Price (Flag) If flagged: Positive/Negative stance. Otherwise: numeric fair value.
Composite Score Overall model score (0โ€“10).
Hybrid Efficiency Efficiency of growth ร— quality (0โ€“10).
Rating Modelโ€™s verdict for the snapshot.
Weekly Close Sparkline of the last 52 weekly closing prices.
Trend Line Sparkline of the smoothed trend signal over the last 52 weeks.

Tip: Most metrics include a hover tooltip where they appear in the report.

Week Ending: September 15, 2025