Shengjing Bank Co., Ltd.
2066 HKG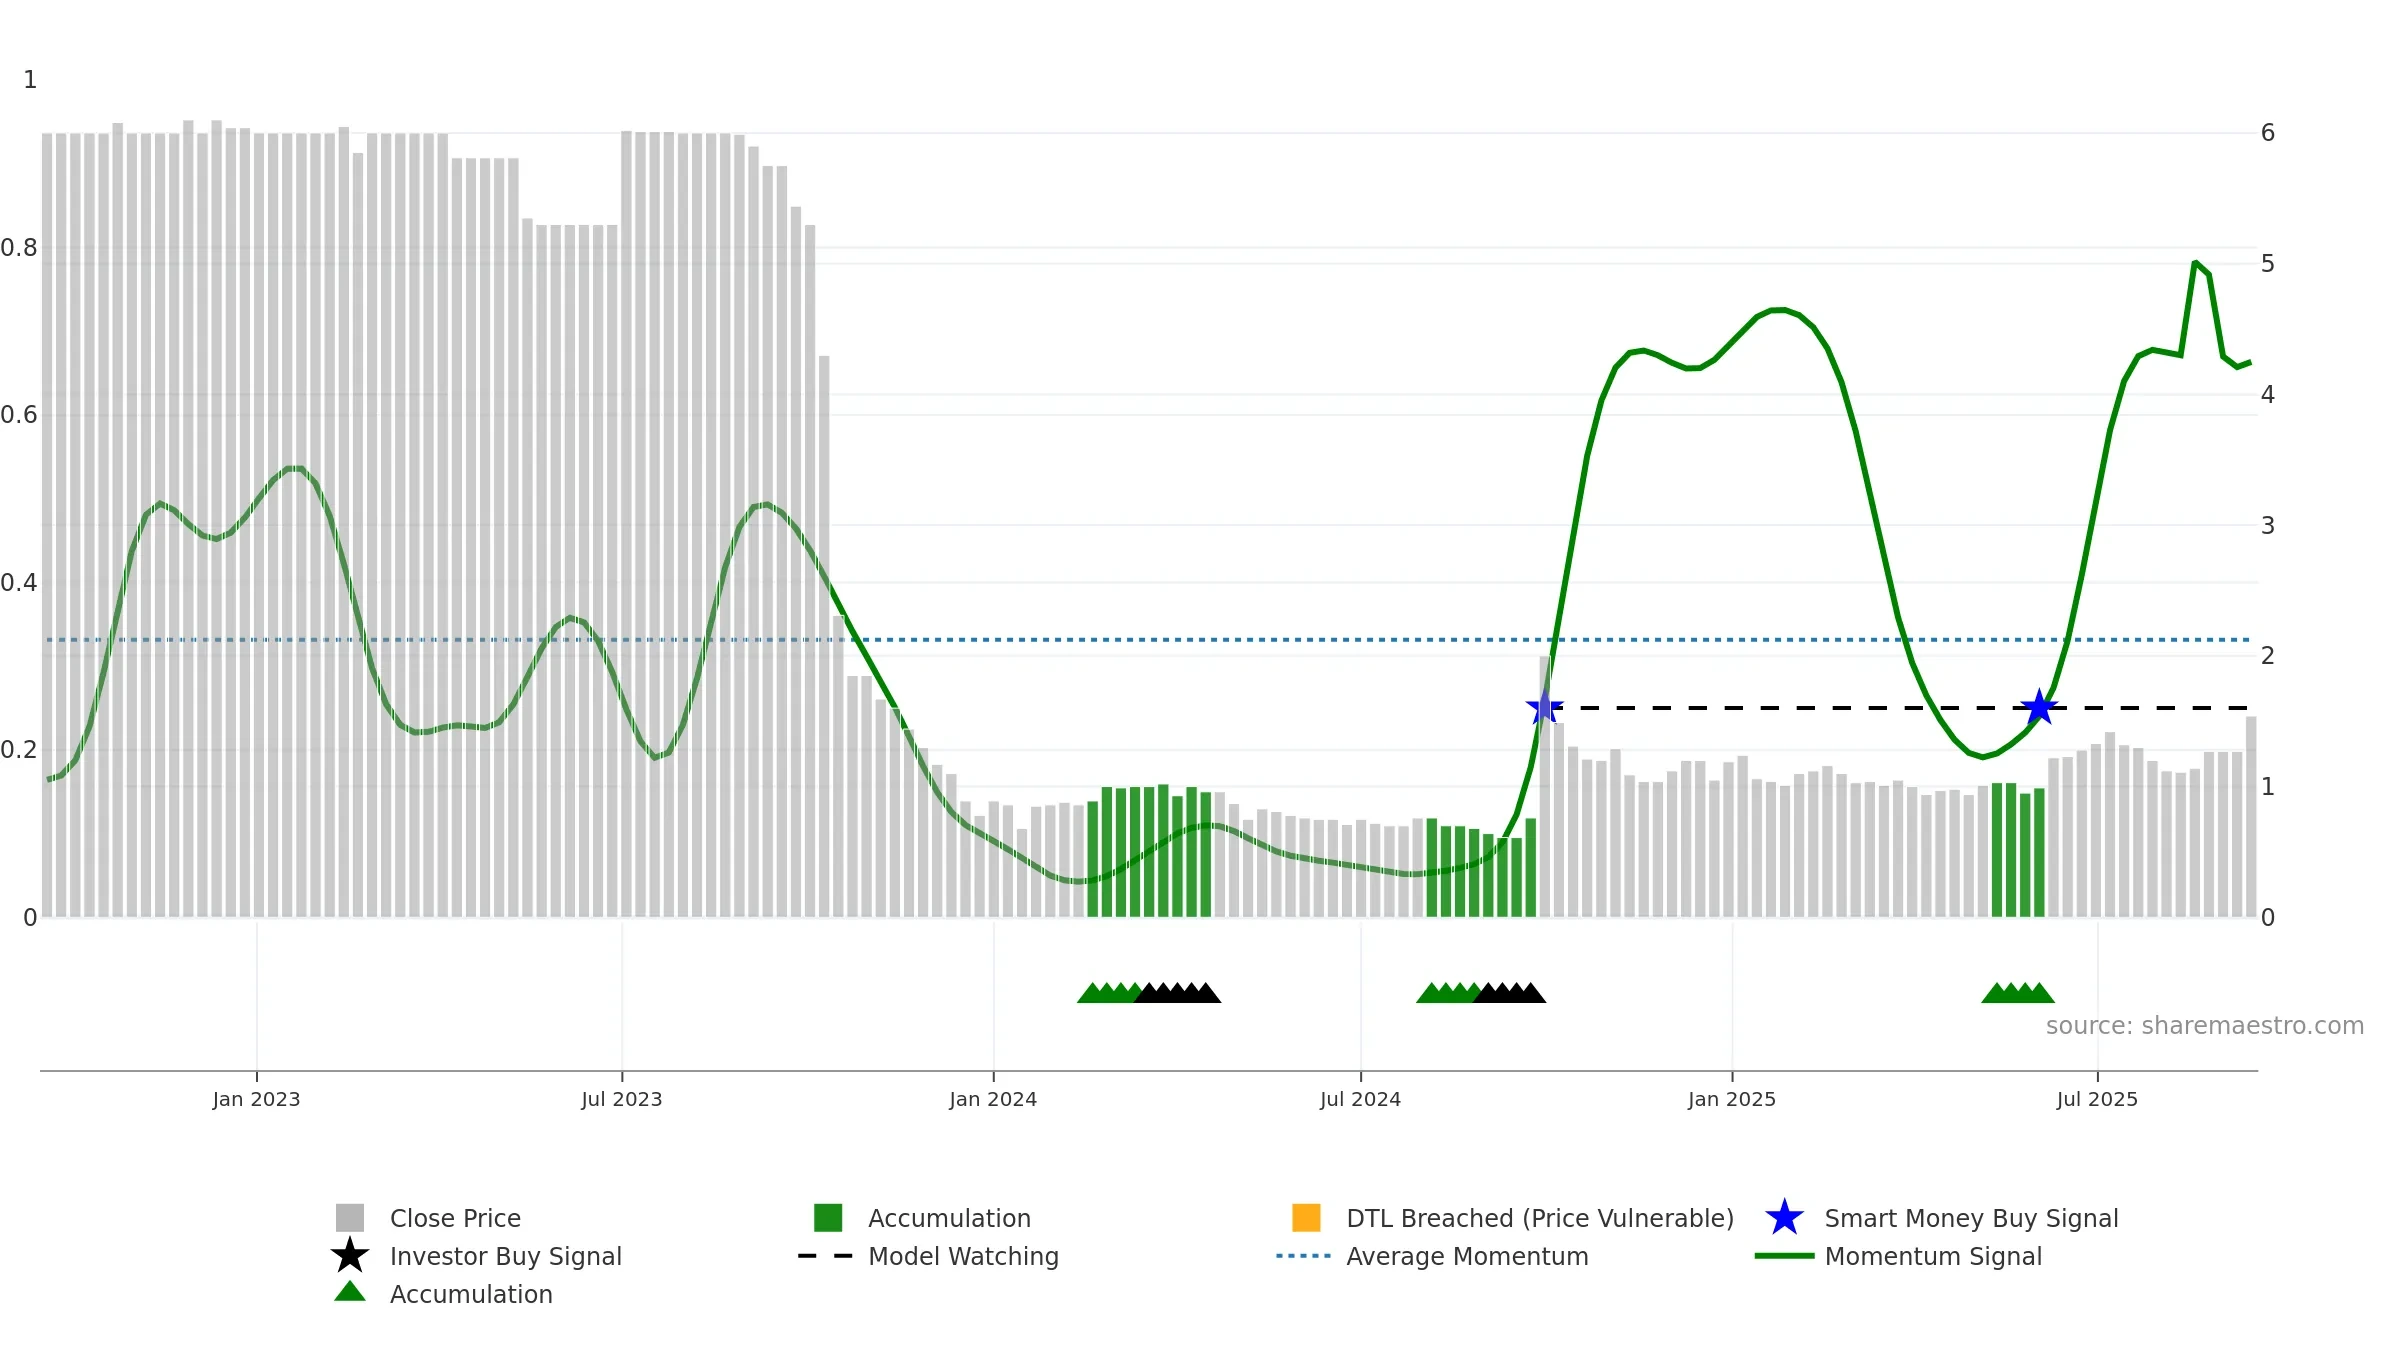
Weekly Report
Shengjing Bank Co., Ltd. closed at 1.5400 (1.99% WoW) . Data window ends Mon, 15 Sep 2025.
How to read this — Price slope is upward, indicating persistent buying over the window. Elevated weekly volatility increases whipsaw risk. Volume and price are moving in the same direction — a constructive confirmation. Returns are positively correlated with volume — strength tends to arrive on higher activity. Price holds above key averages, indicating constructive participation.
Up-slope supports buying interest; pullbacks may be contained if activity stays firm.
Gauge maps the trend signal to a 0–100 scale.
How to read this — Gauge is elevated but momentum is rolling over; topping risk is rising.
Stay alert: protect gains or seek confirmation before adding risk.
Conclusion
Negative setup. ★★☆☆☆ confidence. Price window: 28. Trend: Uptrend at Risk; gauge 66. In combination, liquidity confirms the move.
- Price holds above 8w & 26w averages
- Liquidity confirms the price trend
- Solid multi-week performance
- High-level but rolling over (topping risk)
- Momentum is weak/falling
- High return volatility raises whipsaw risk
Why: Price window 28.33% over 8w. Close is 21.26% above the prior-window high. Return volatility 6.33%. Volume trend rising. Liquidity convergence with price. Trend state uptrend at risk. Momentum neutral and falling.
Tip: Most metrics include a hover tooltip where they appear in the report.