Canadian Solar Inc.
CSIQ NASDAQ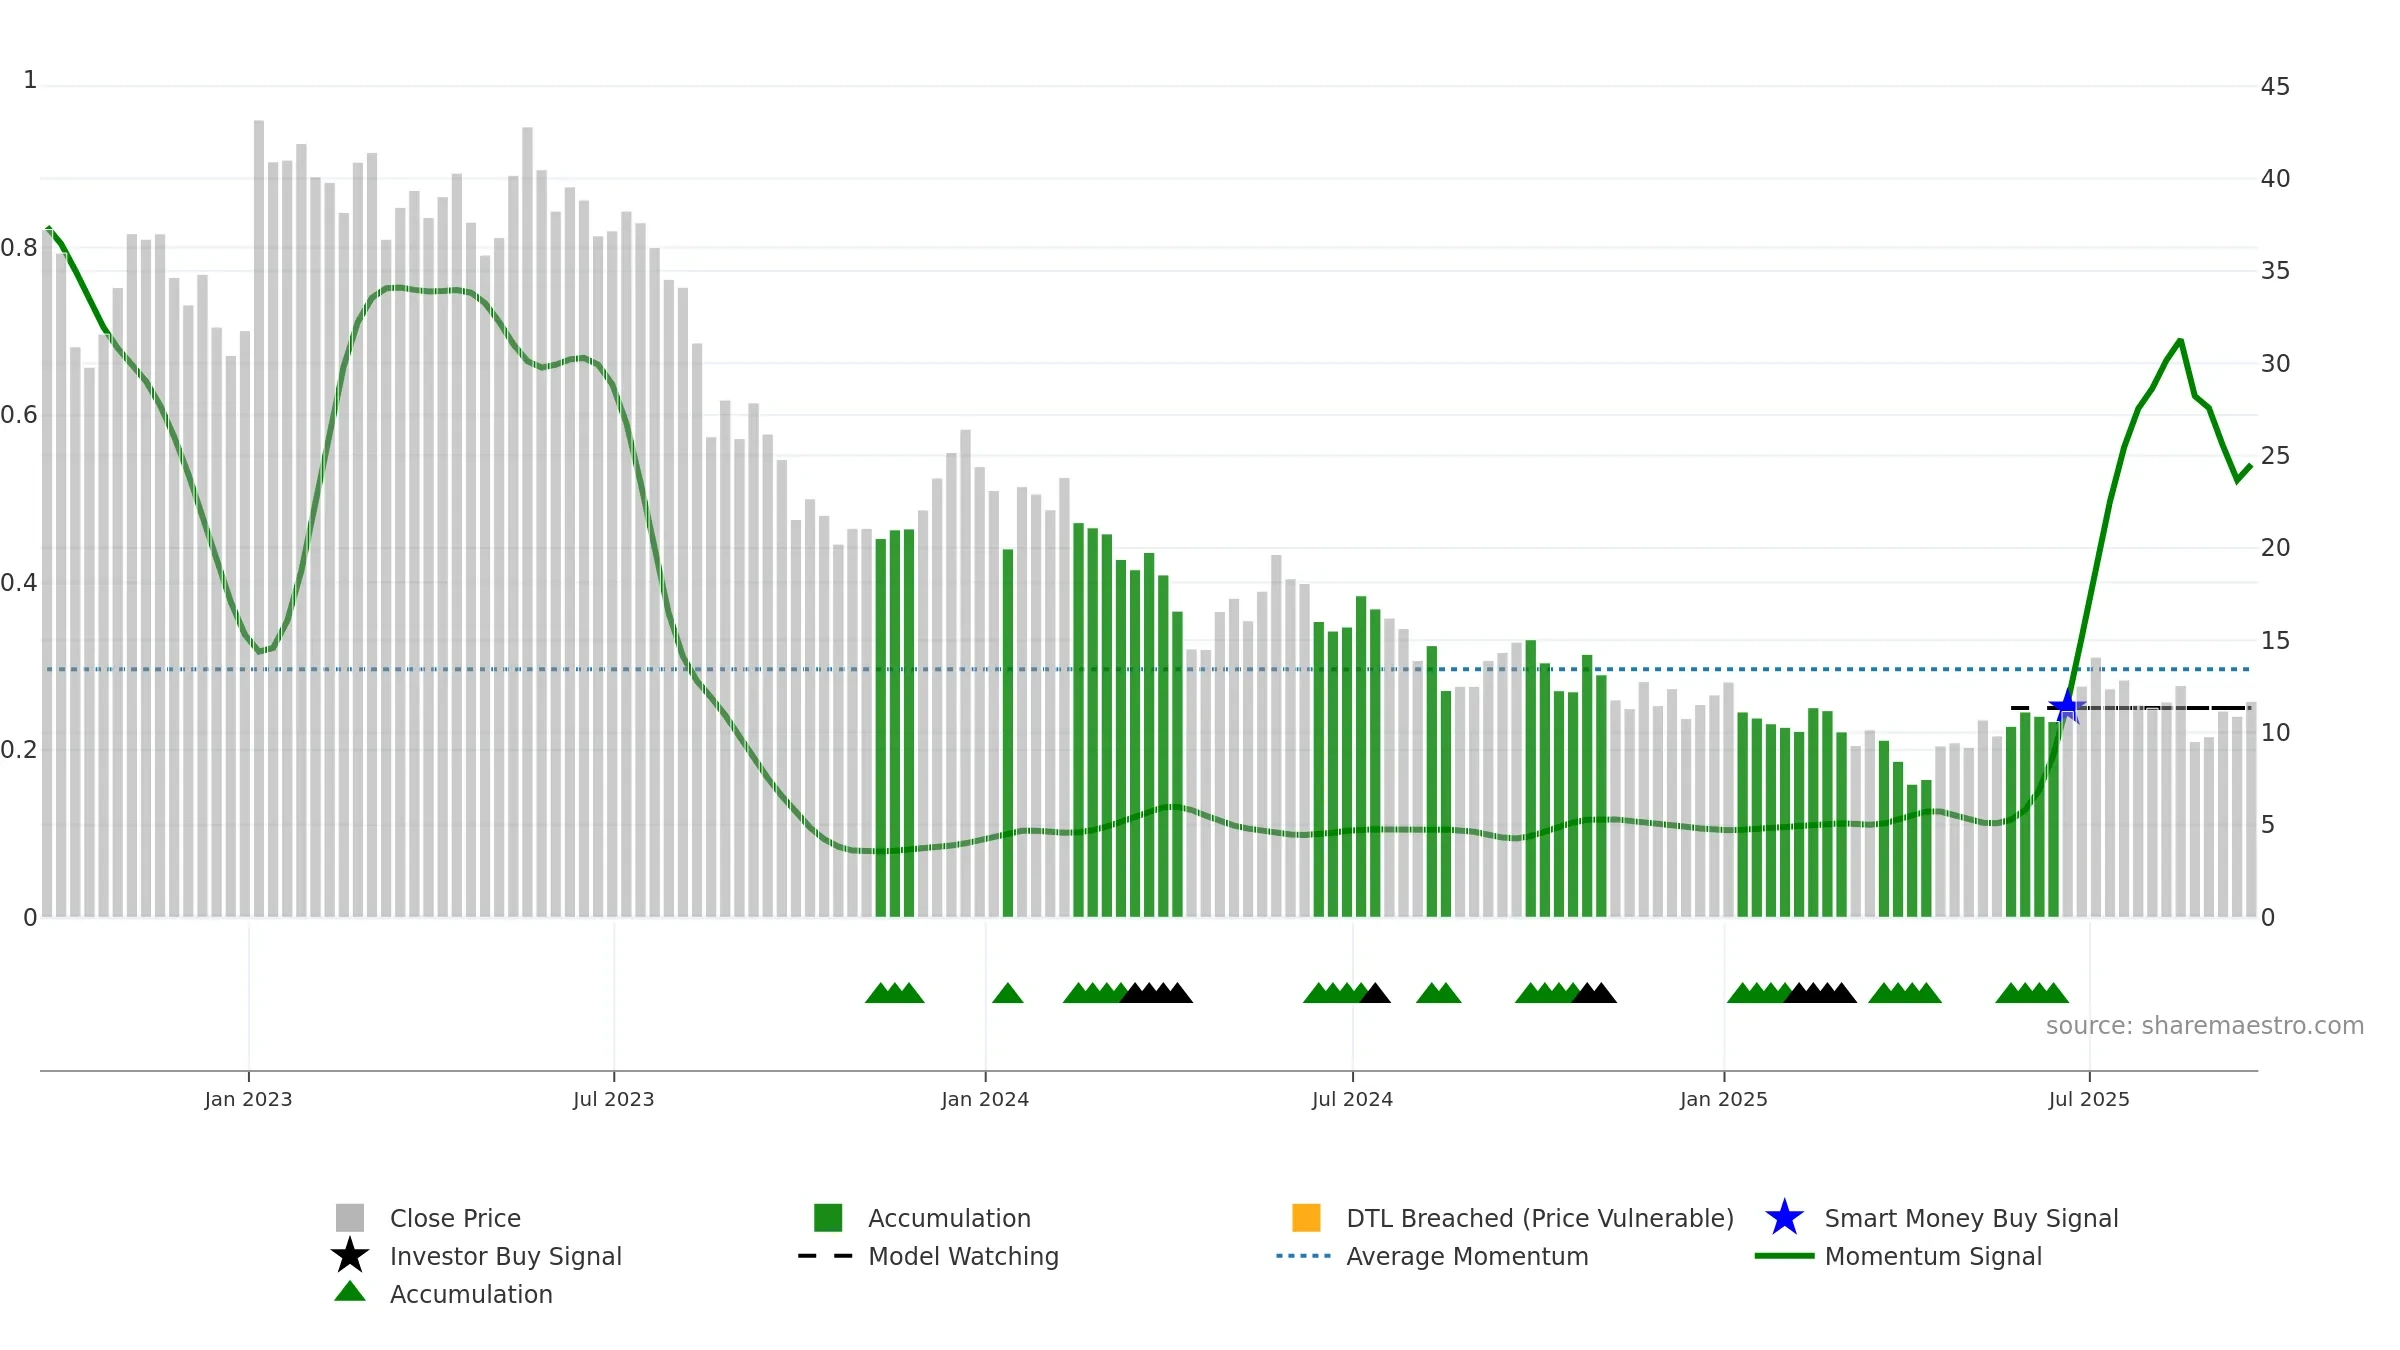
Weekly Summary
Canadian Solar Inc. closed at 11.7000 (-1.68% WoW) . Data window ends Fri, 19 Sep 2025.
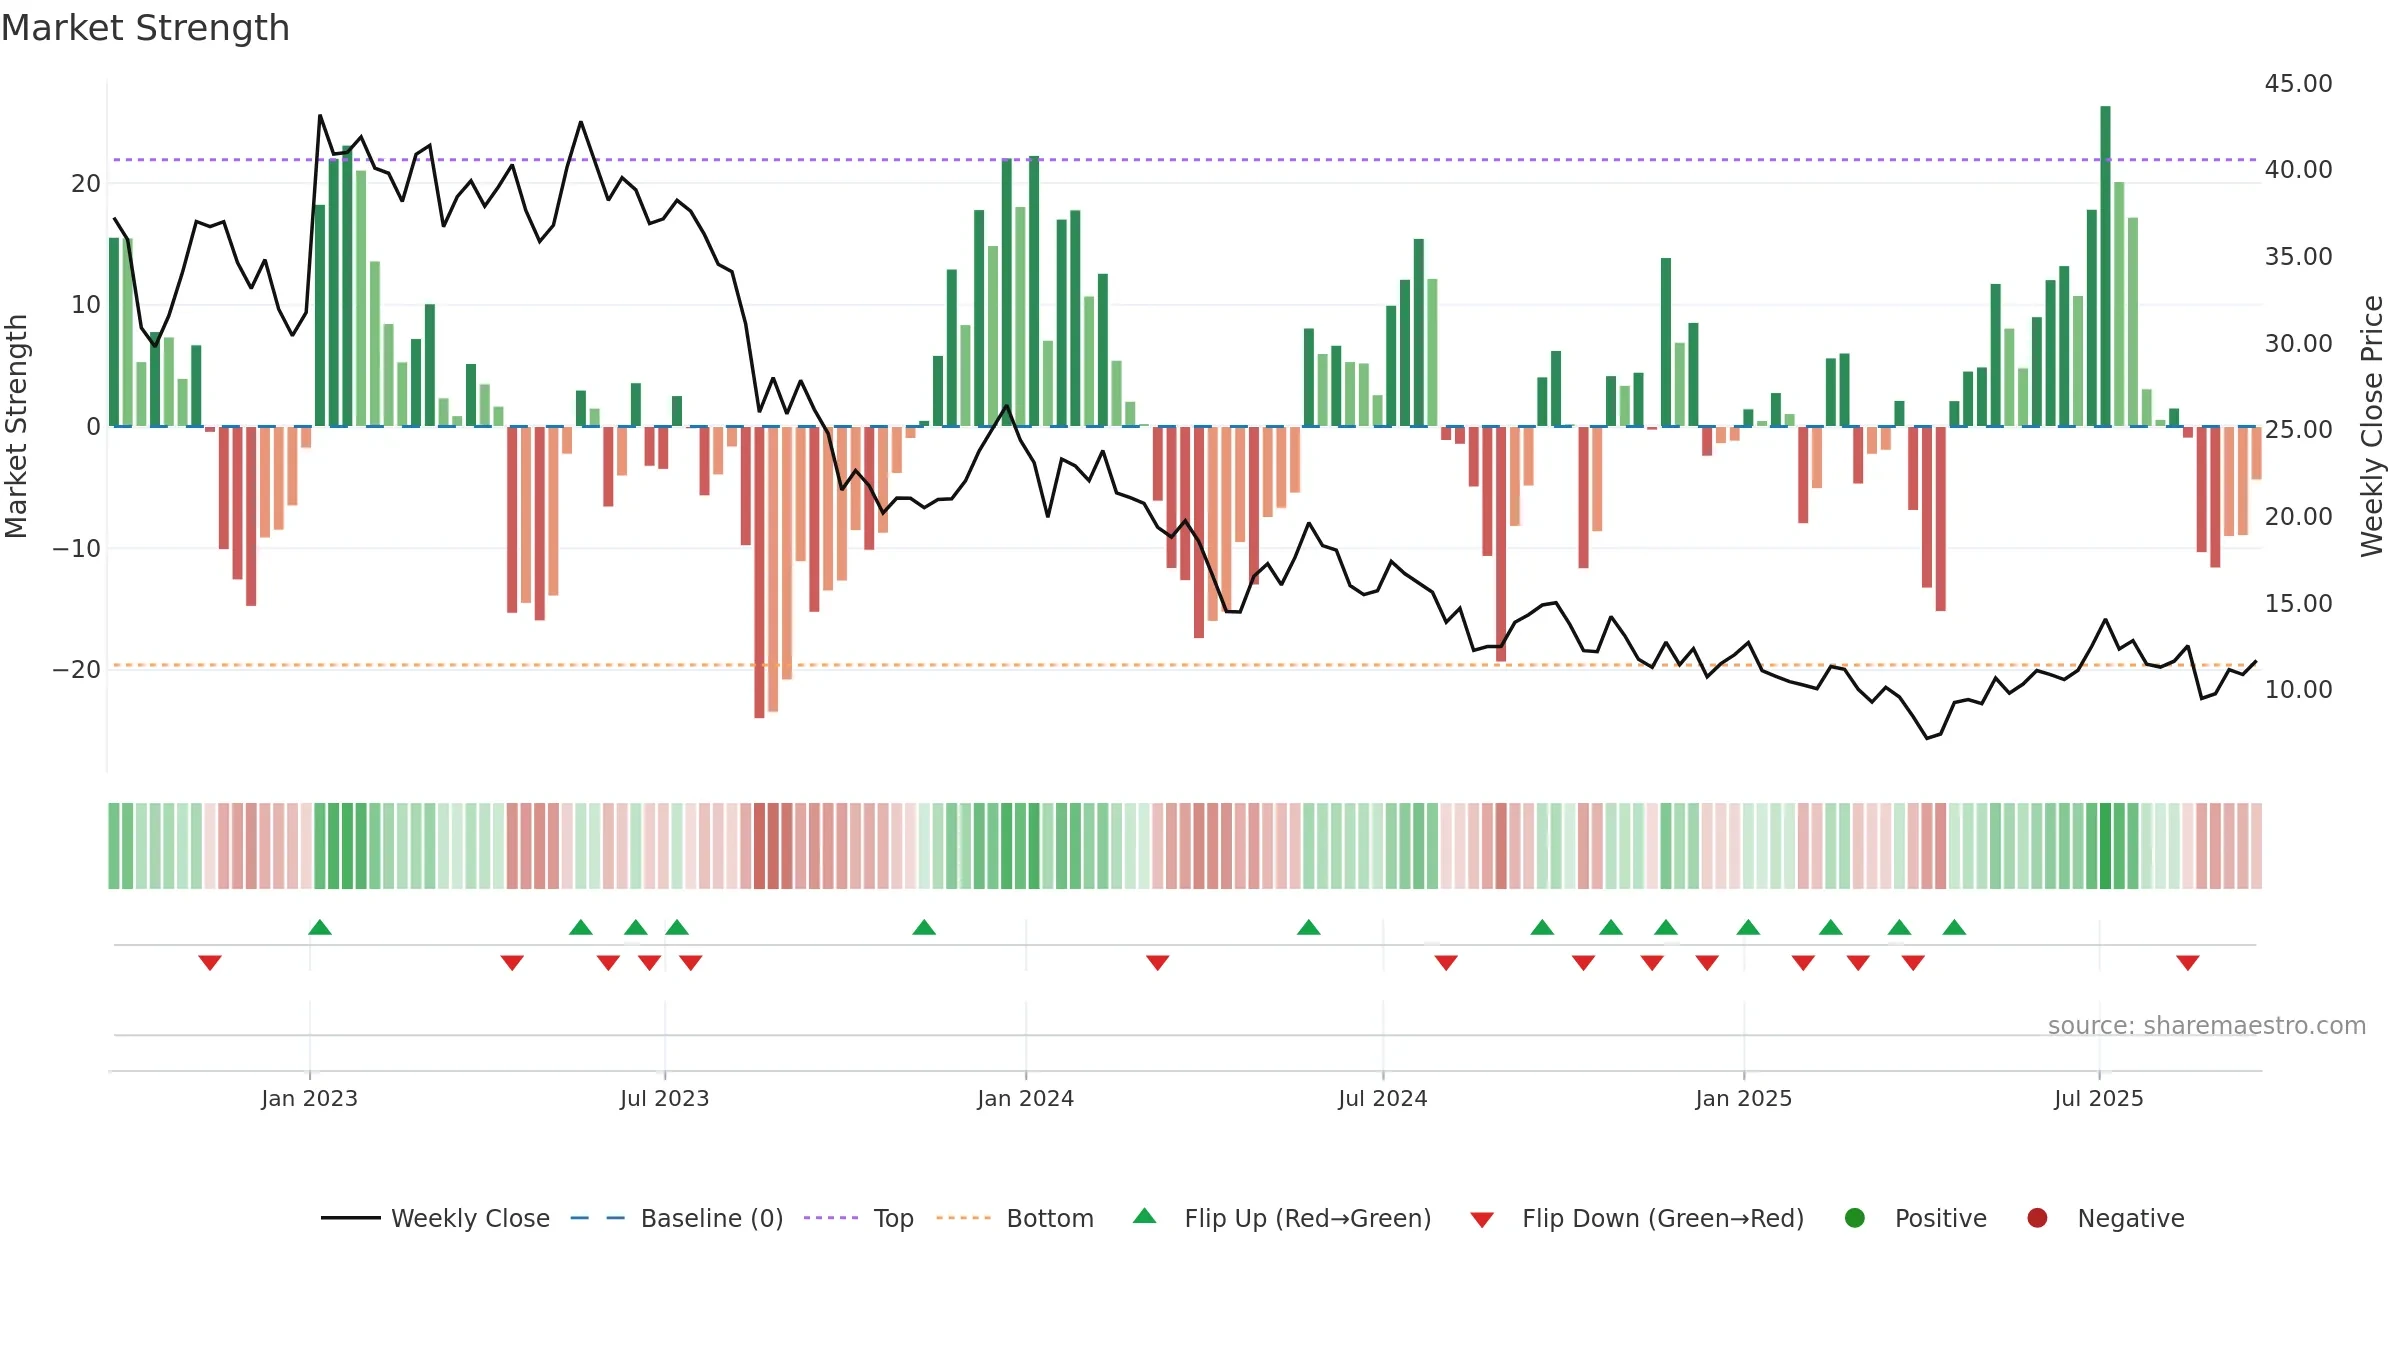
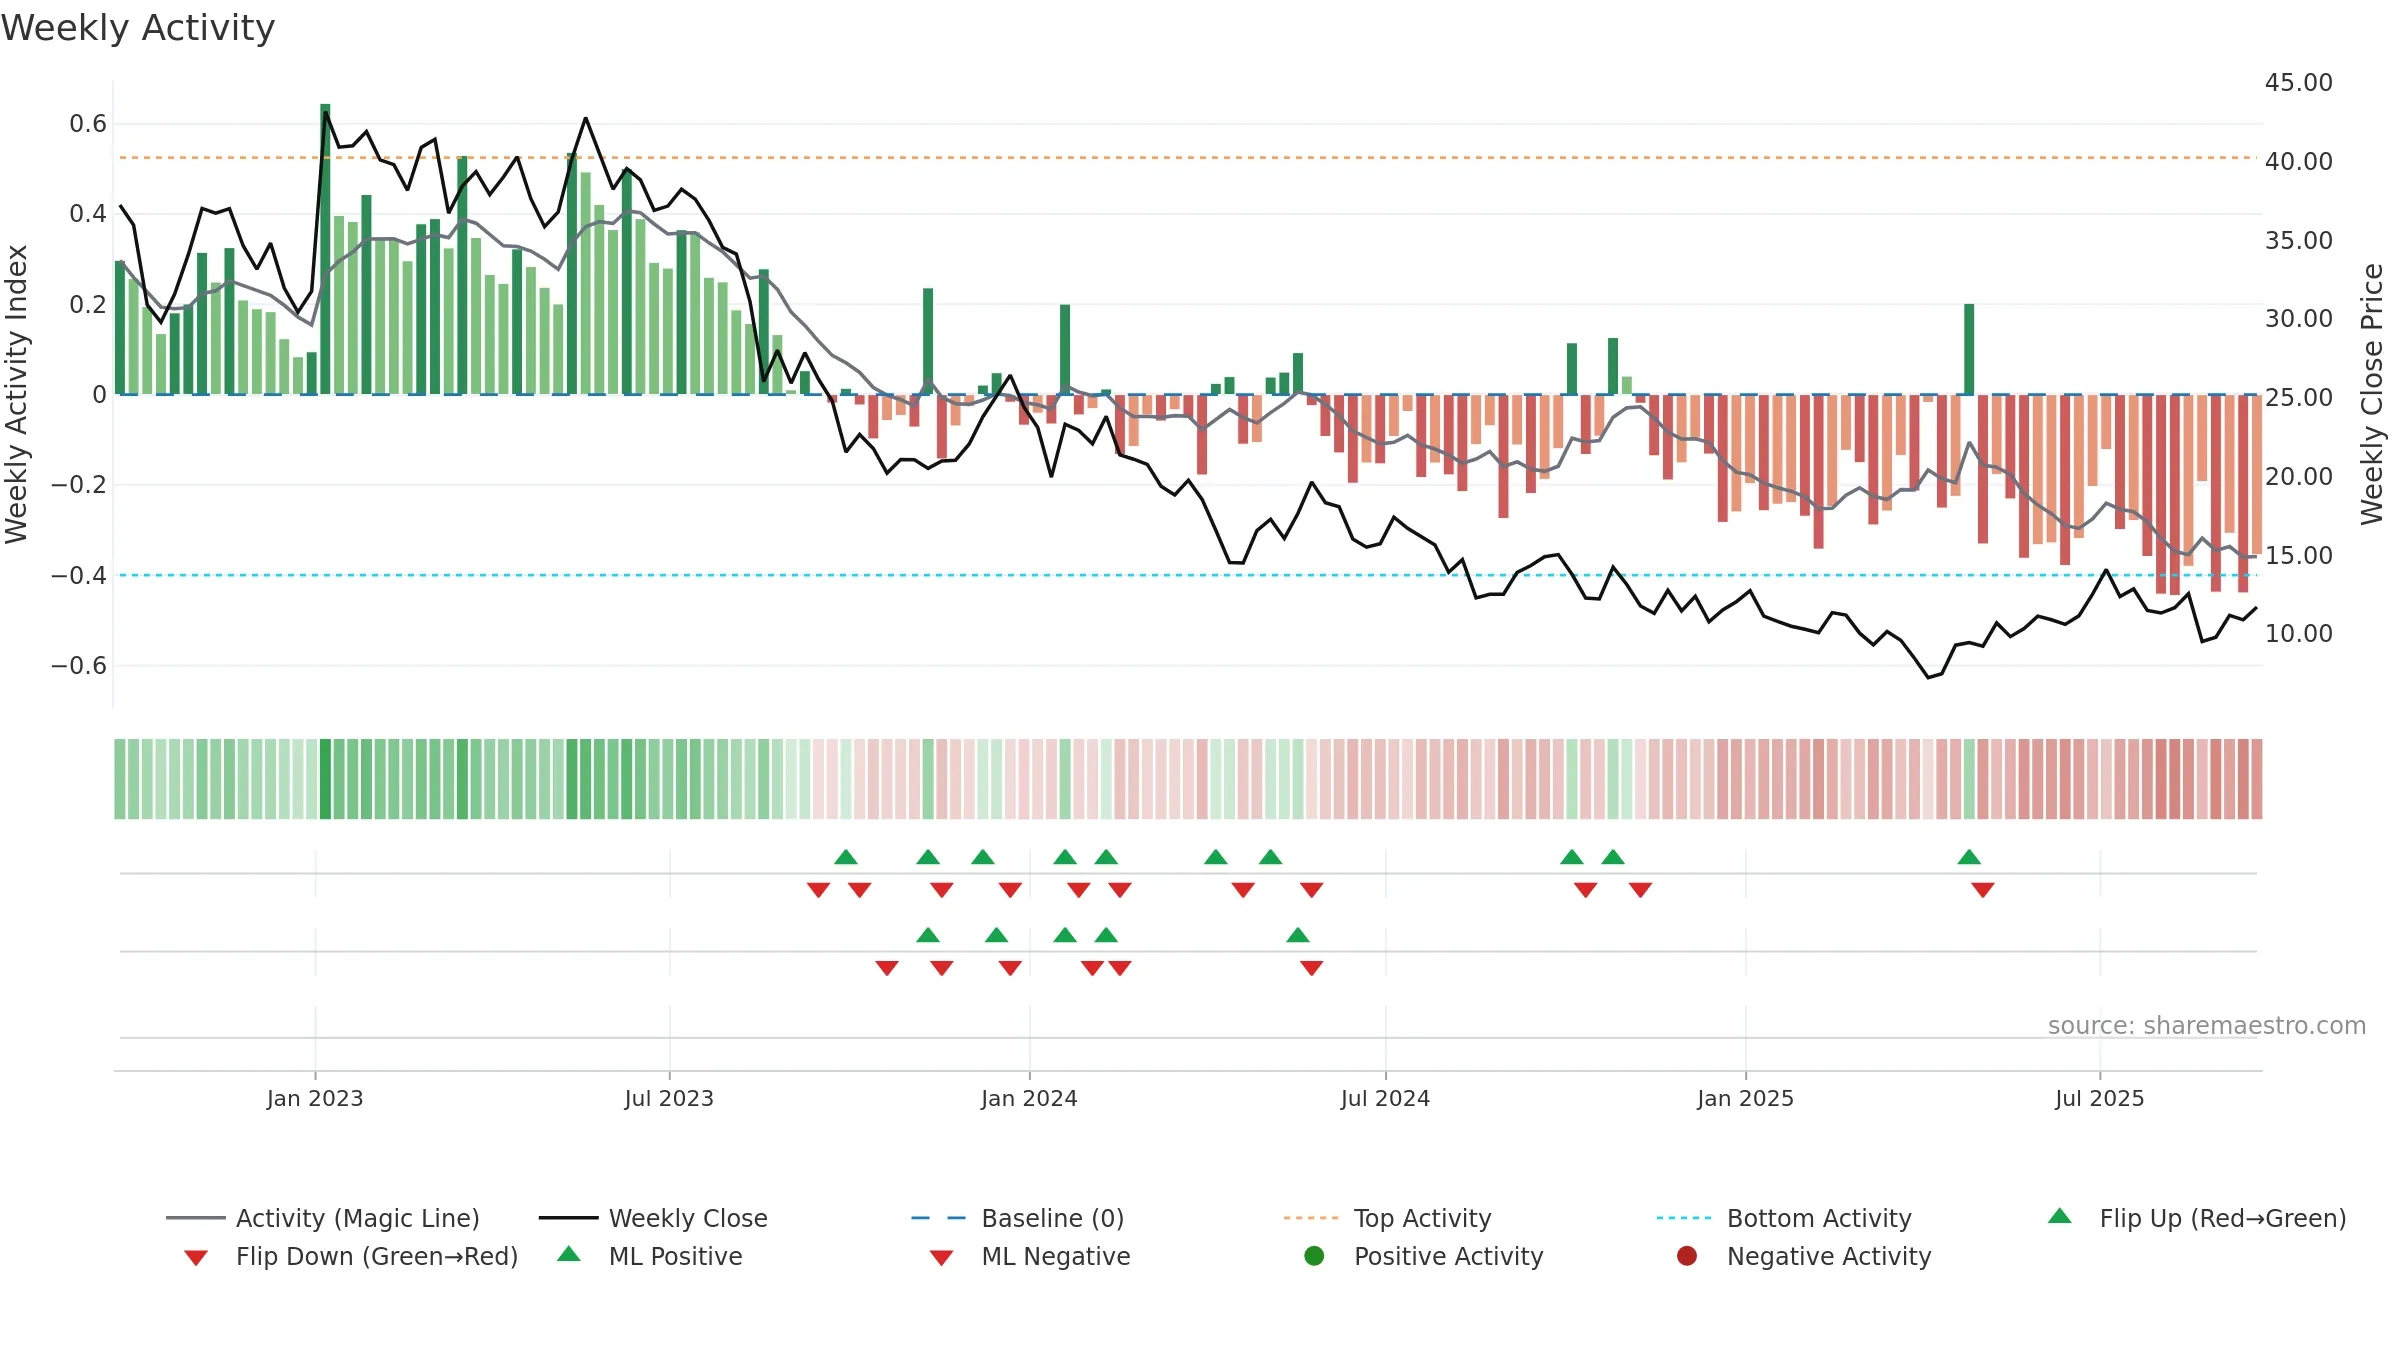
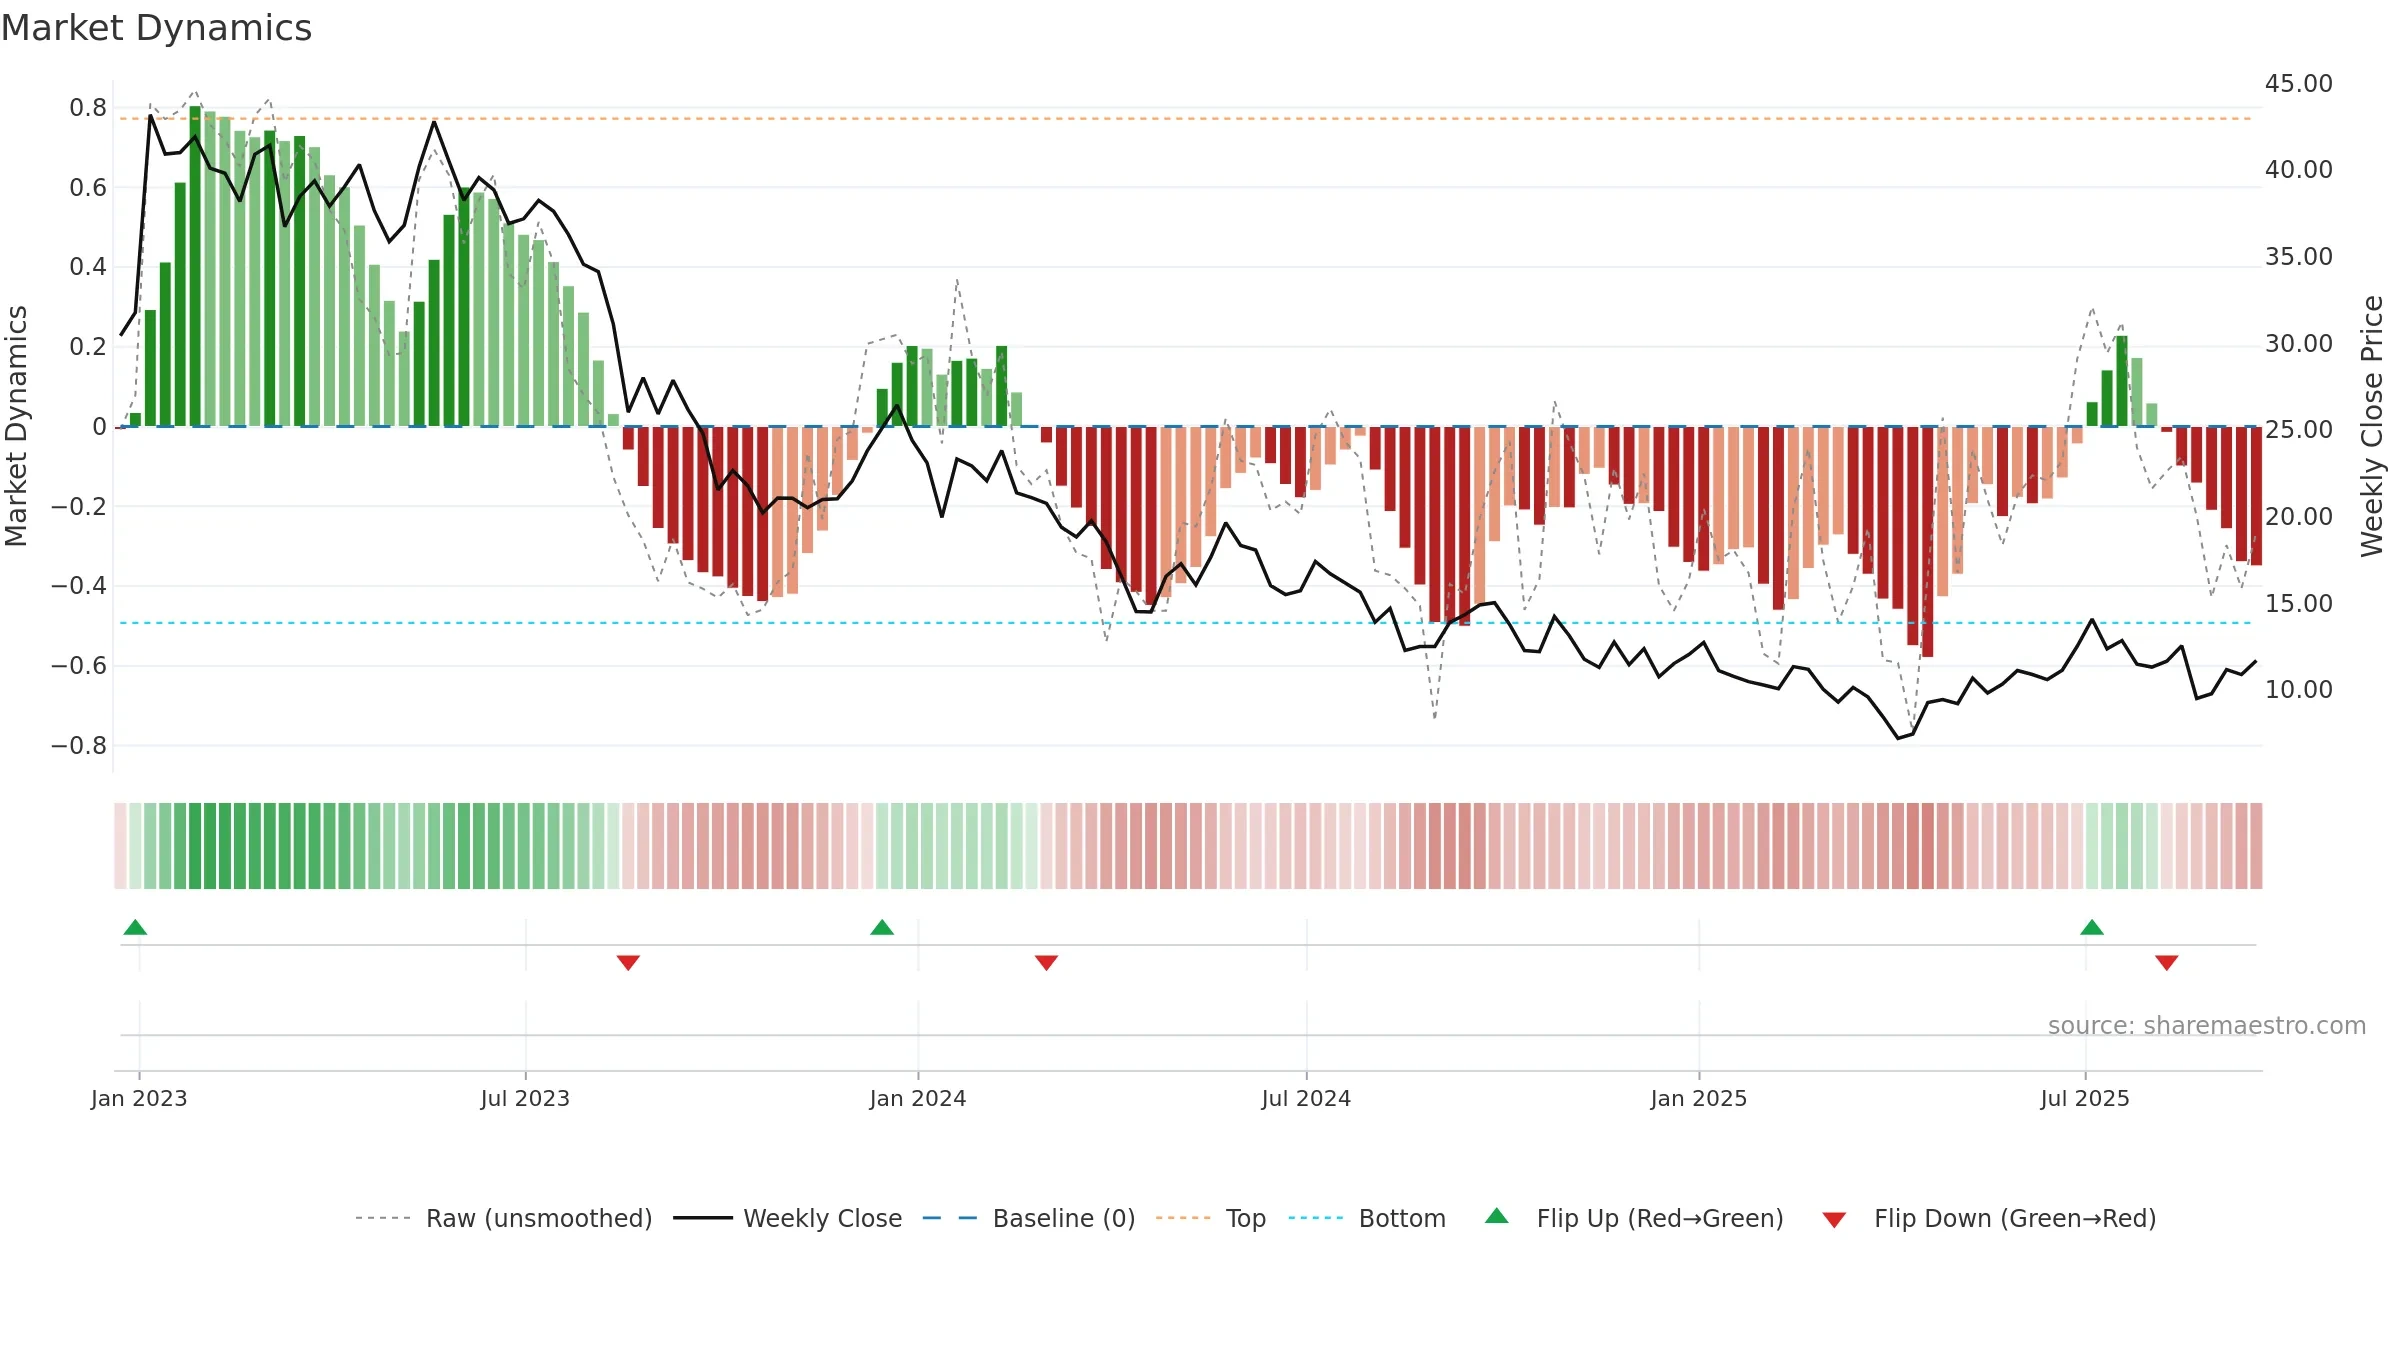
How to read this — Price slope is downward, indicating persistent supply pressure. Elevated weekly volatility increases whipsaw risk. Volume trend diverges from price — watch for fatigue or rotation. Returns are negatively correlated with volume — strength may come on lighter activity. Price holds above key averages, indicating constructive participation.
Down-slope argues for patience; rallies can fade sooner unless participation improves. Because liquidity isn’t confirming, prefer evidence of fresh demand before chasing moves.
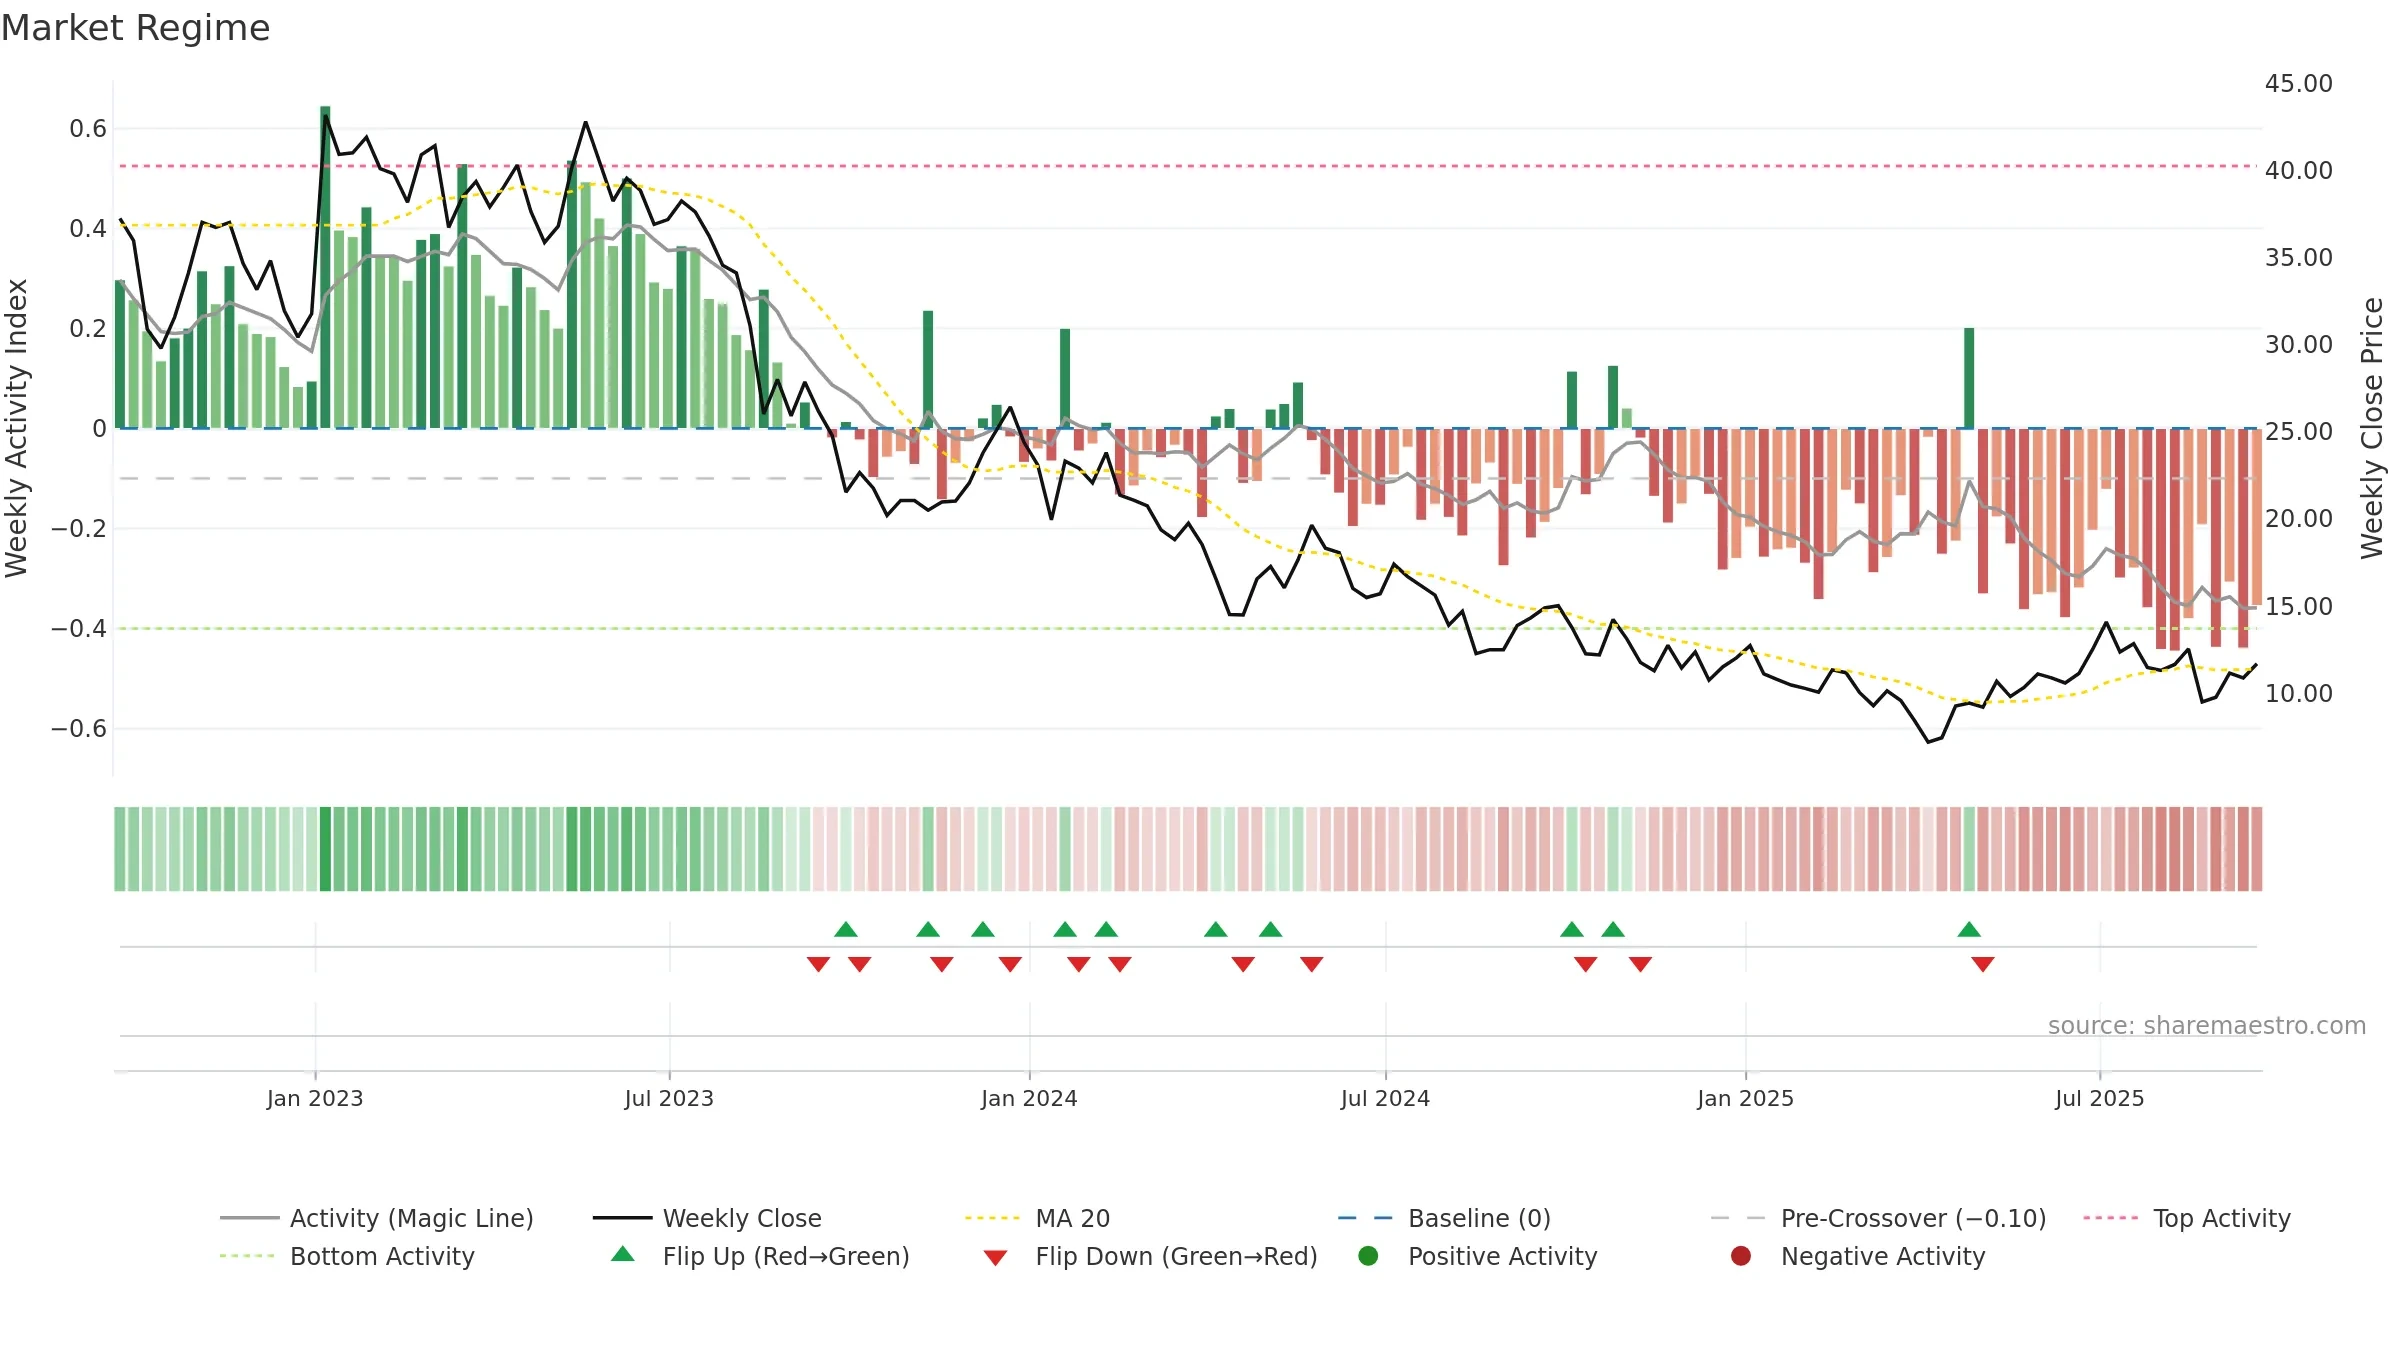
Gauge maps the trend signal to a 0–100 scale.
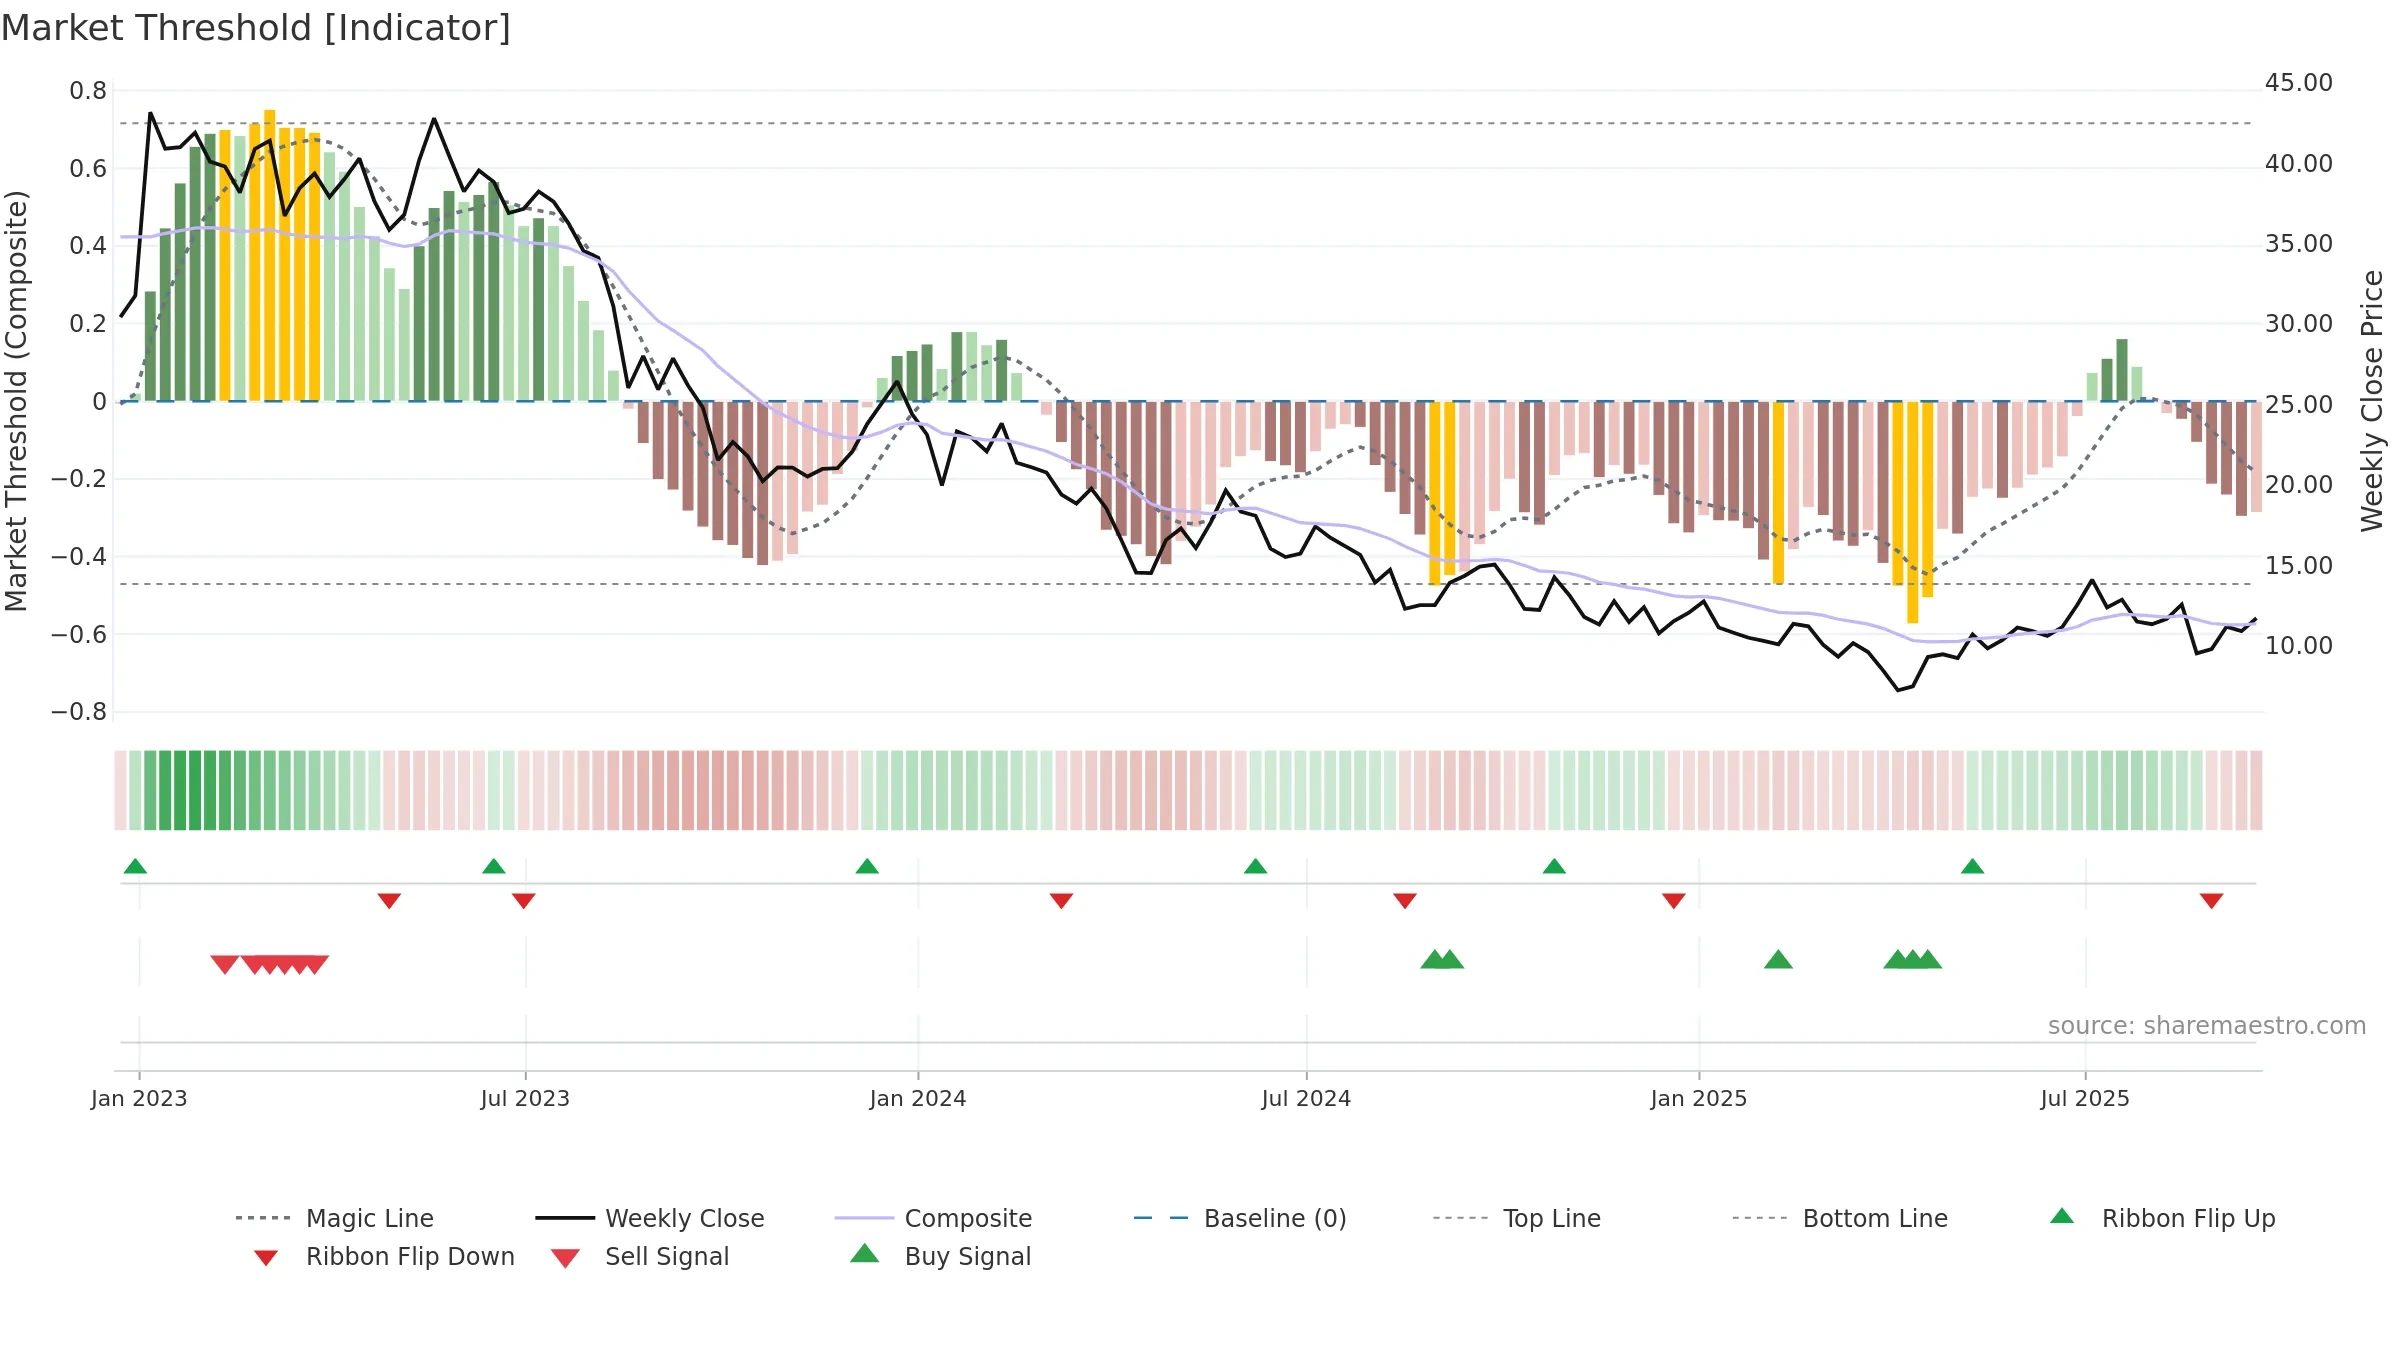
How to read this — Range-bound conditions; conviction is limited until a break or acceleration emerges.
Wait for a directional break or improving acceleration.

Relative strength is Negative
(< 0%, underperforming).
Latest MRS: -5.64% (week ending Fri, 19 Sep 2025).
Slope: Falling over 8w.
Notes:
- Below zero line indicates relative weakness vs benchmark.
- MRS slope falling over ~8 weeks.
The flag is positive: favourable upside skew with supportive conditions.
Conclusion
Negative setup. ★★☆☆☆ confidence. Trend: Range / Neutral · 3.36% over window · vol 5.05% · liquidity divergence · posture above · RS weak
- Price holds above 8–26 week averages
- Momentum is weak/falling
- Liquidity diverges from price
- High return volatility raises whipsaw risk
- Mansfield RS: weak & falling
Why: Price window 3.36% over w. Close is -6.77% below the prior-window high. Return volatility 5.05%. Volume trend rising. Liquidity divergence with price. Trend state range / neutral. Momentum neutral and falling. Valuation stance positive.
Tip: Most metrics include a hover tooltip where they appear in the report.