Diamond Hill Investment Group, Inc.
DHIL NASDAQ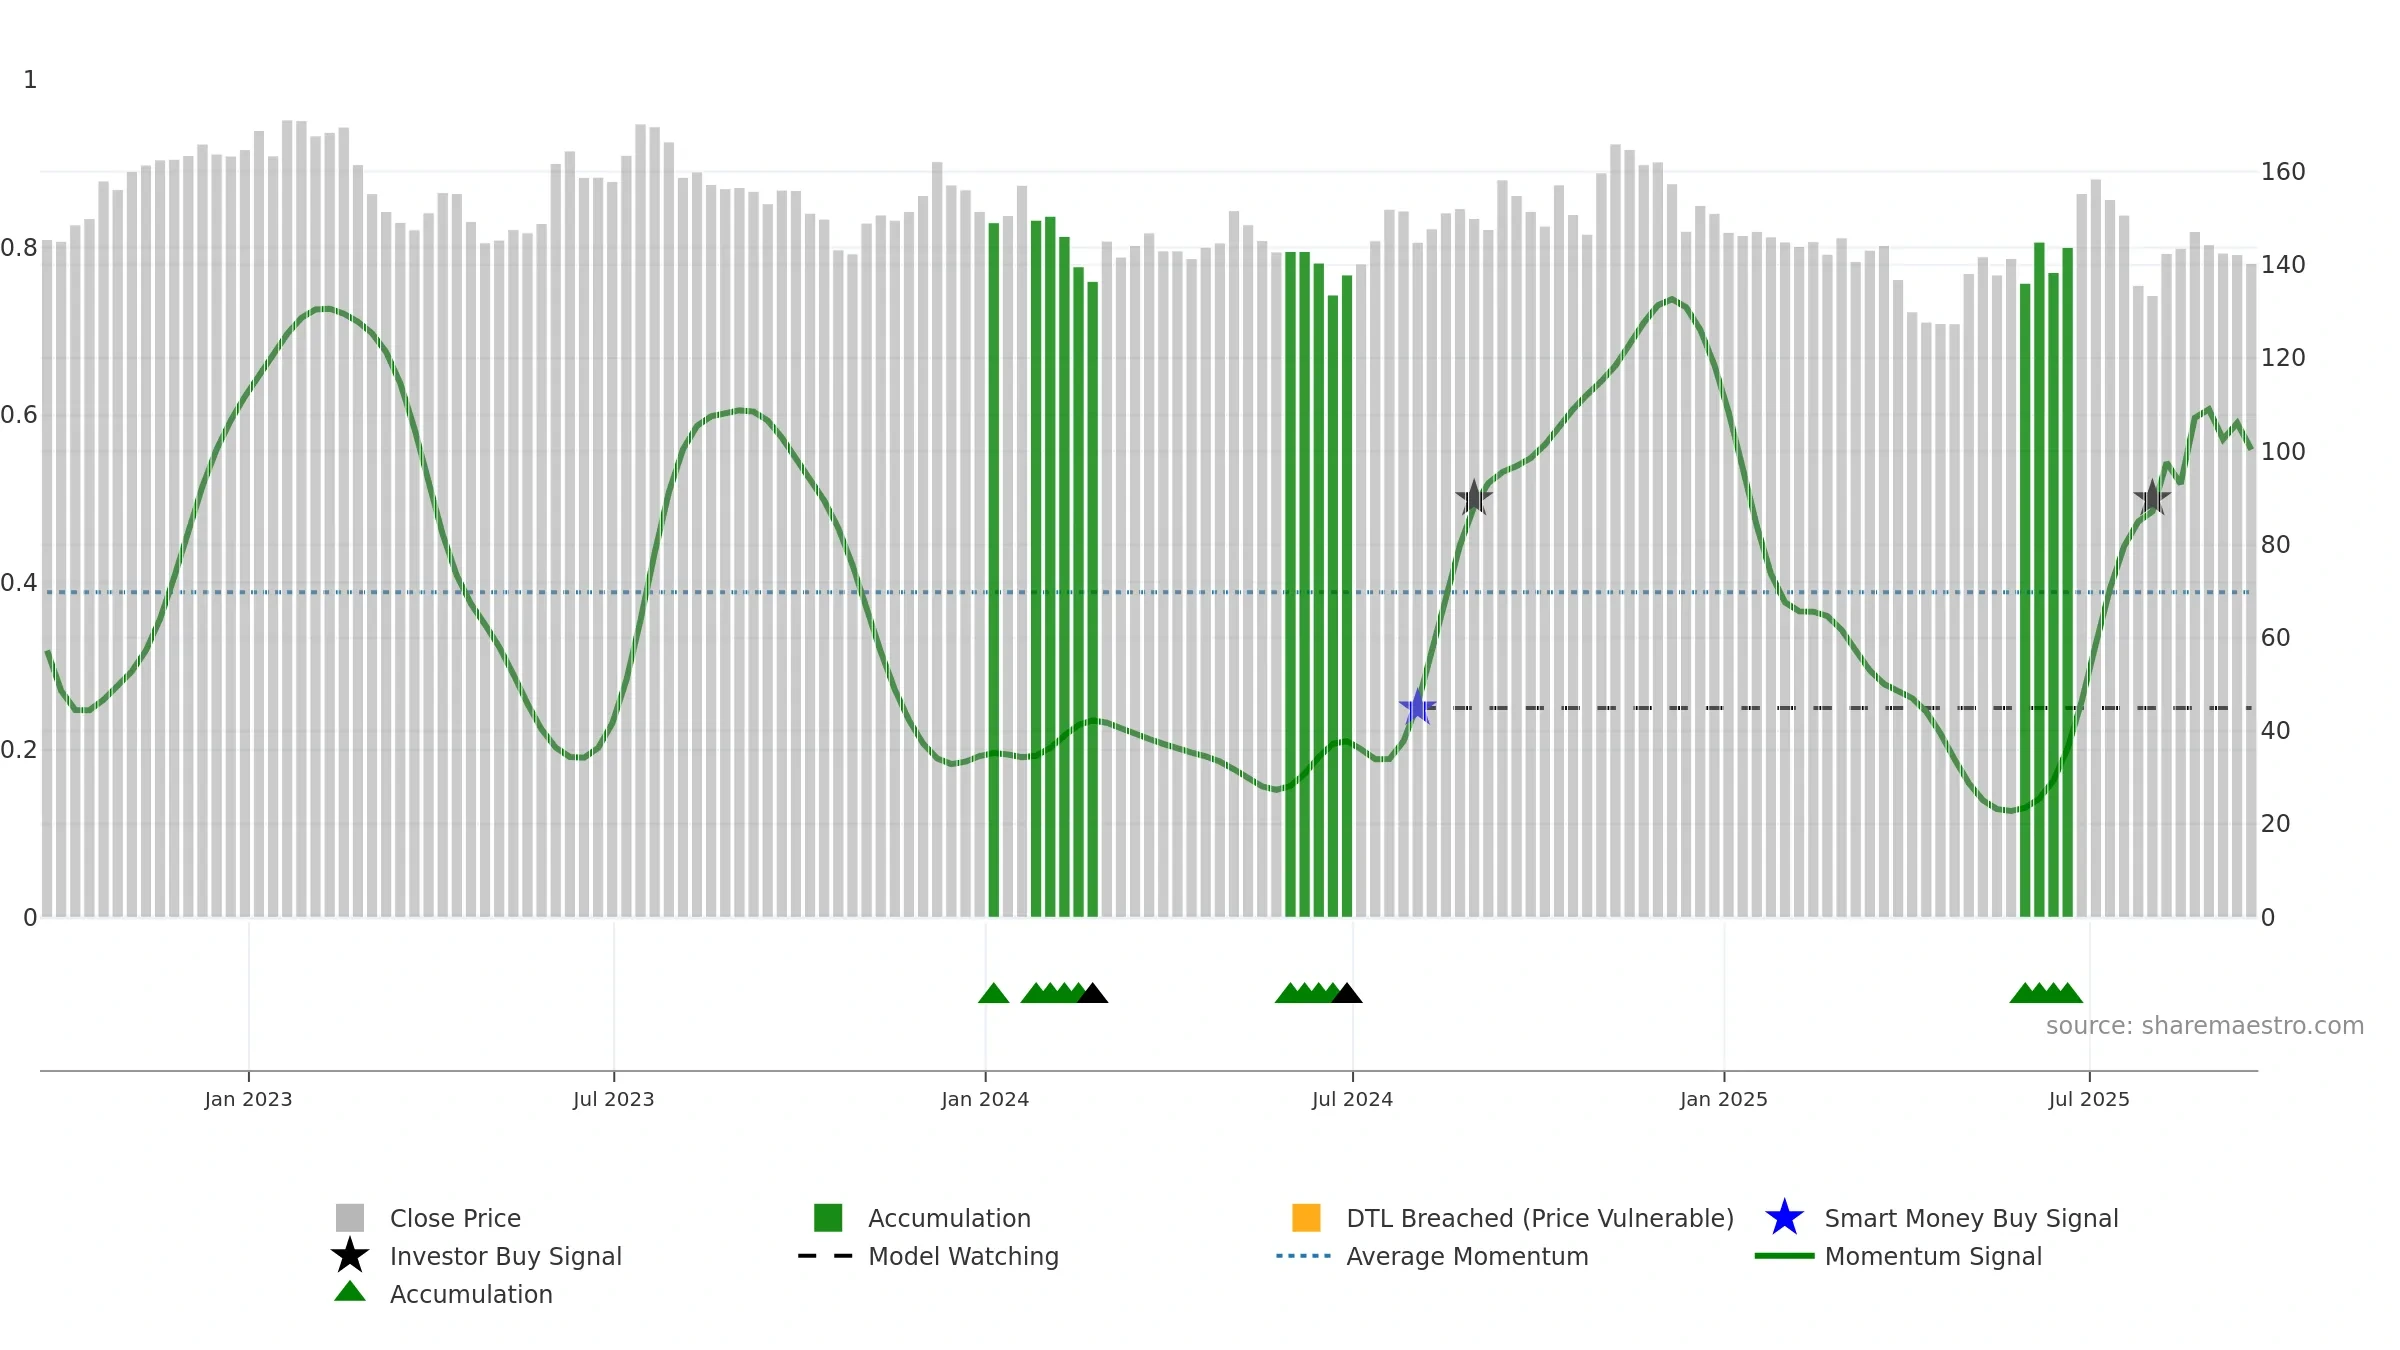
Weekly Summary
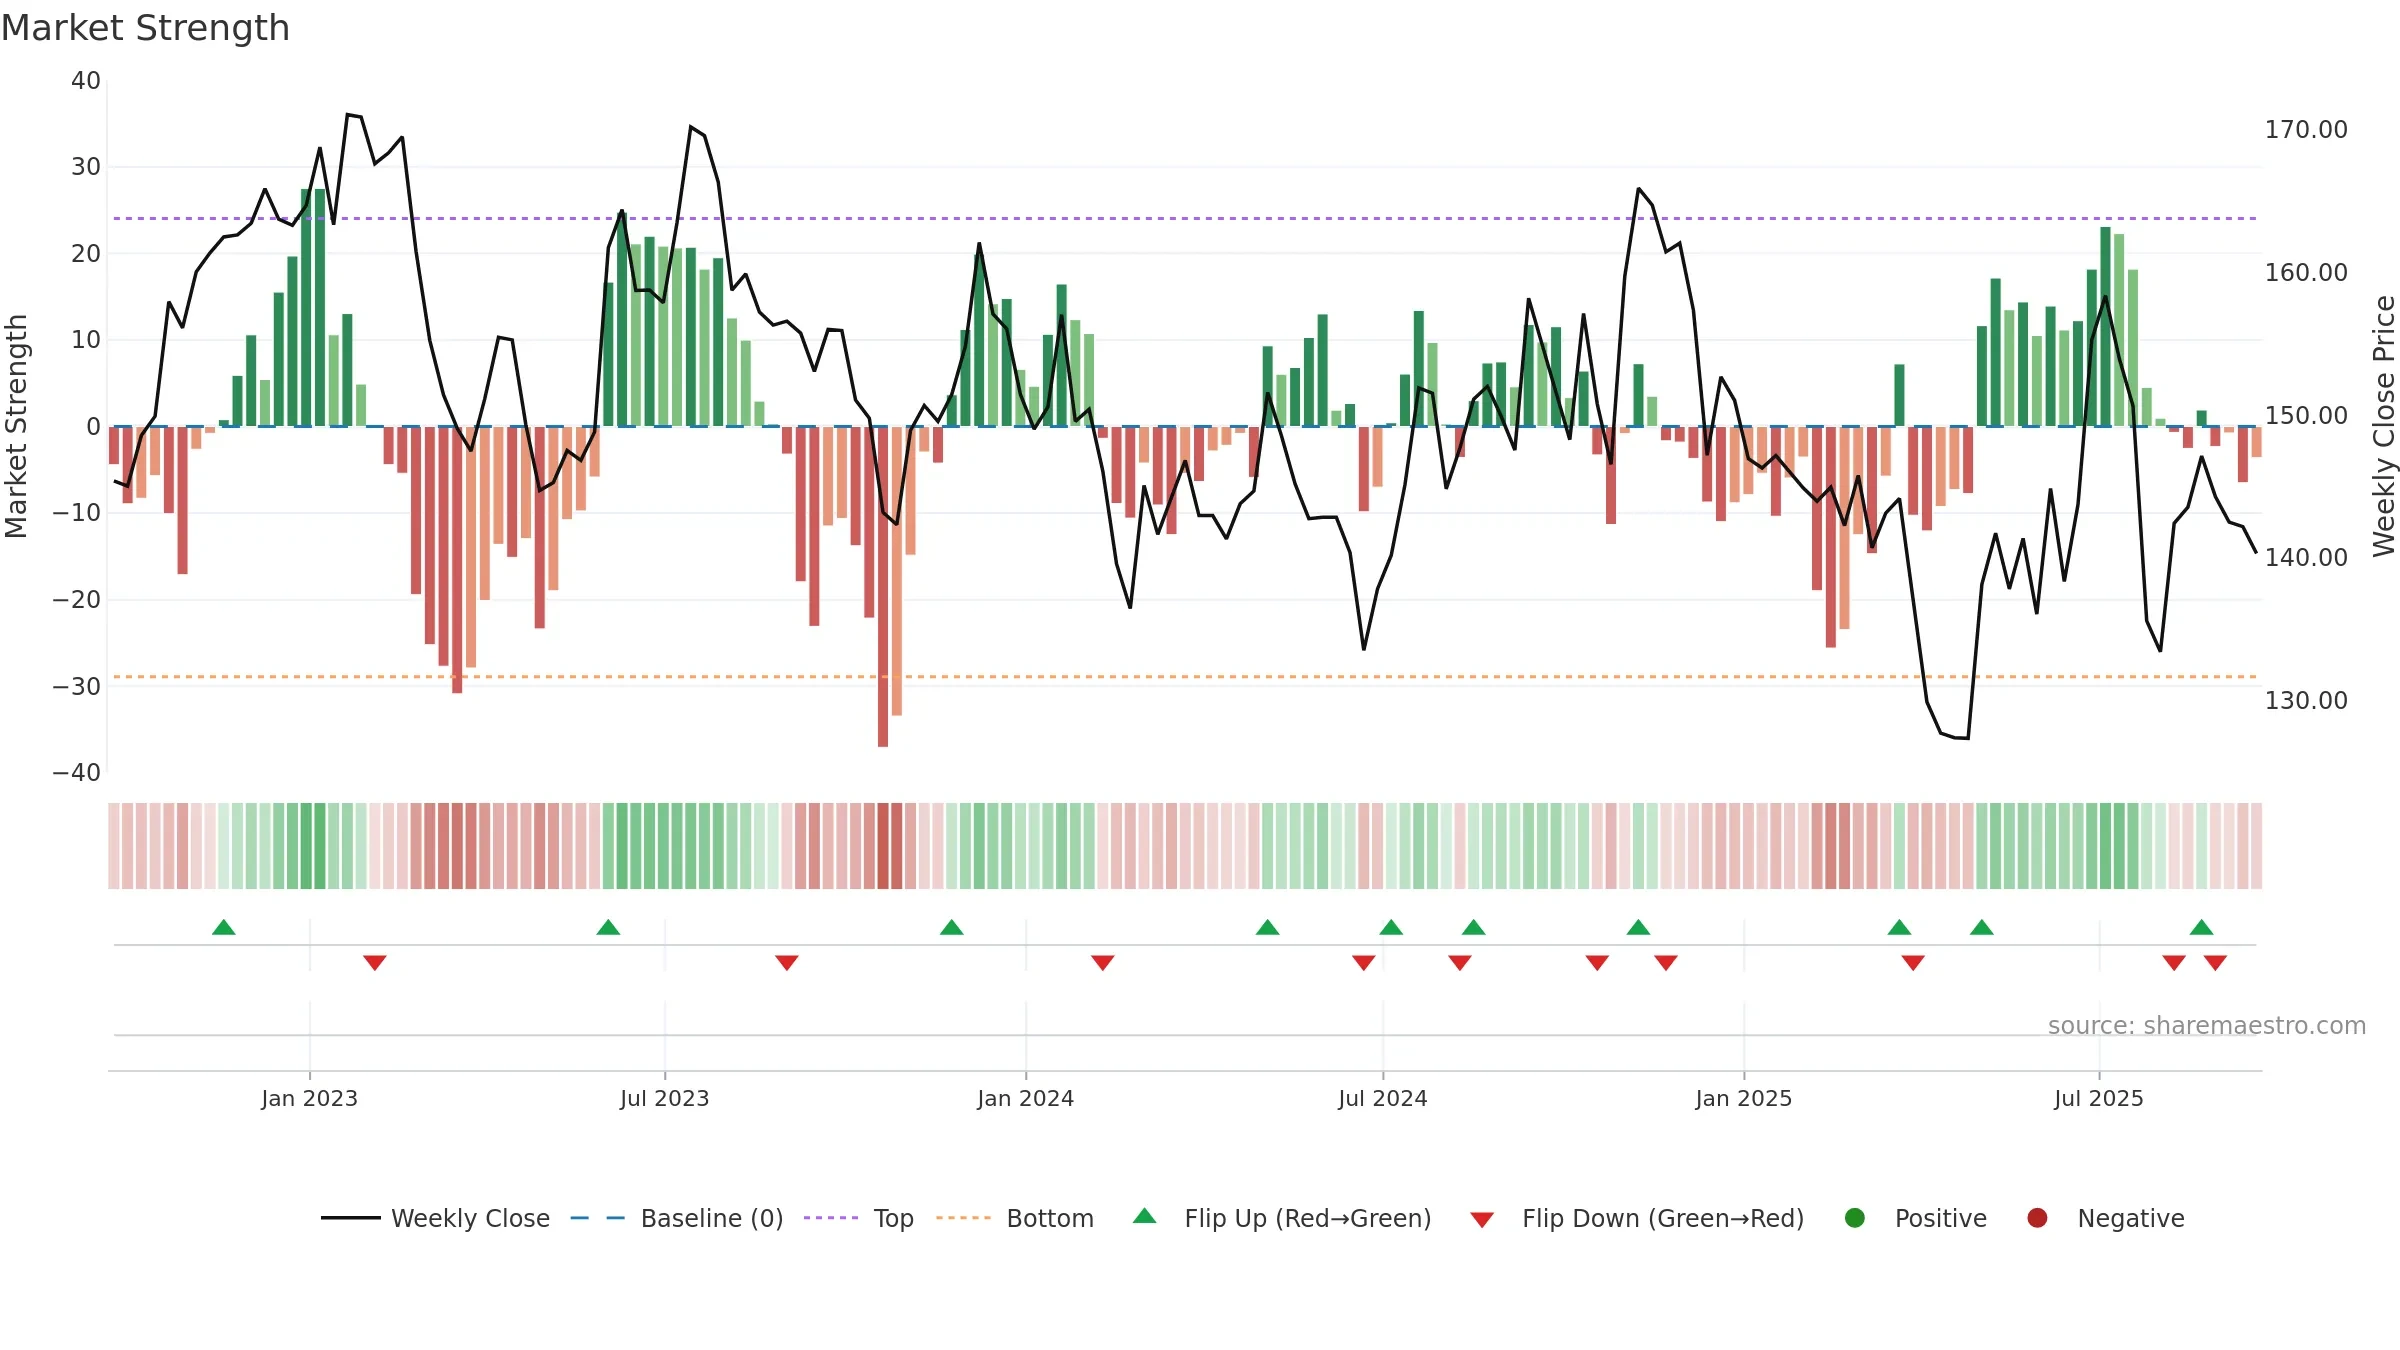
Diamond Hill Investment Group, Inc. closed at 140.3000 (-1.68% WoW) . Data window ends Fri, 19 Sep 2025.
How to read this — Price slope is upward, indicating persistent buying over the window. Low weekly volatility favours steadier follow-through. Volume and price are moving in the same direction — a constructive confirmation. Returns are positively correlated with volume — strength tends to arrive on higher activity. Price sits below key averages, keeping pressure on the tape.
Up-slope supports buying interest; pullbacks may be contained if activity stays firm.
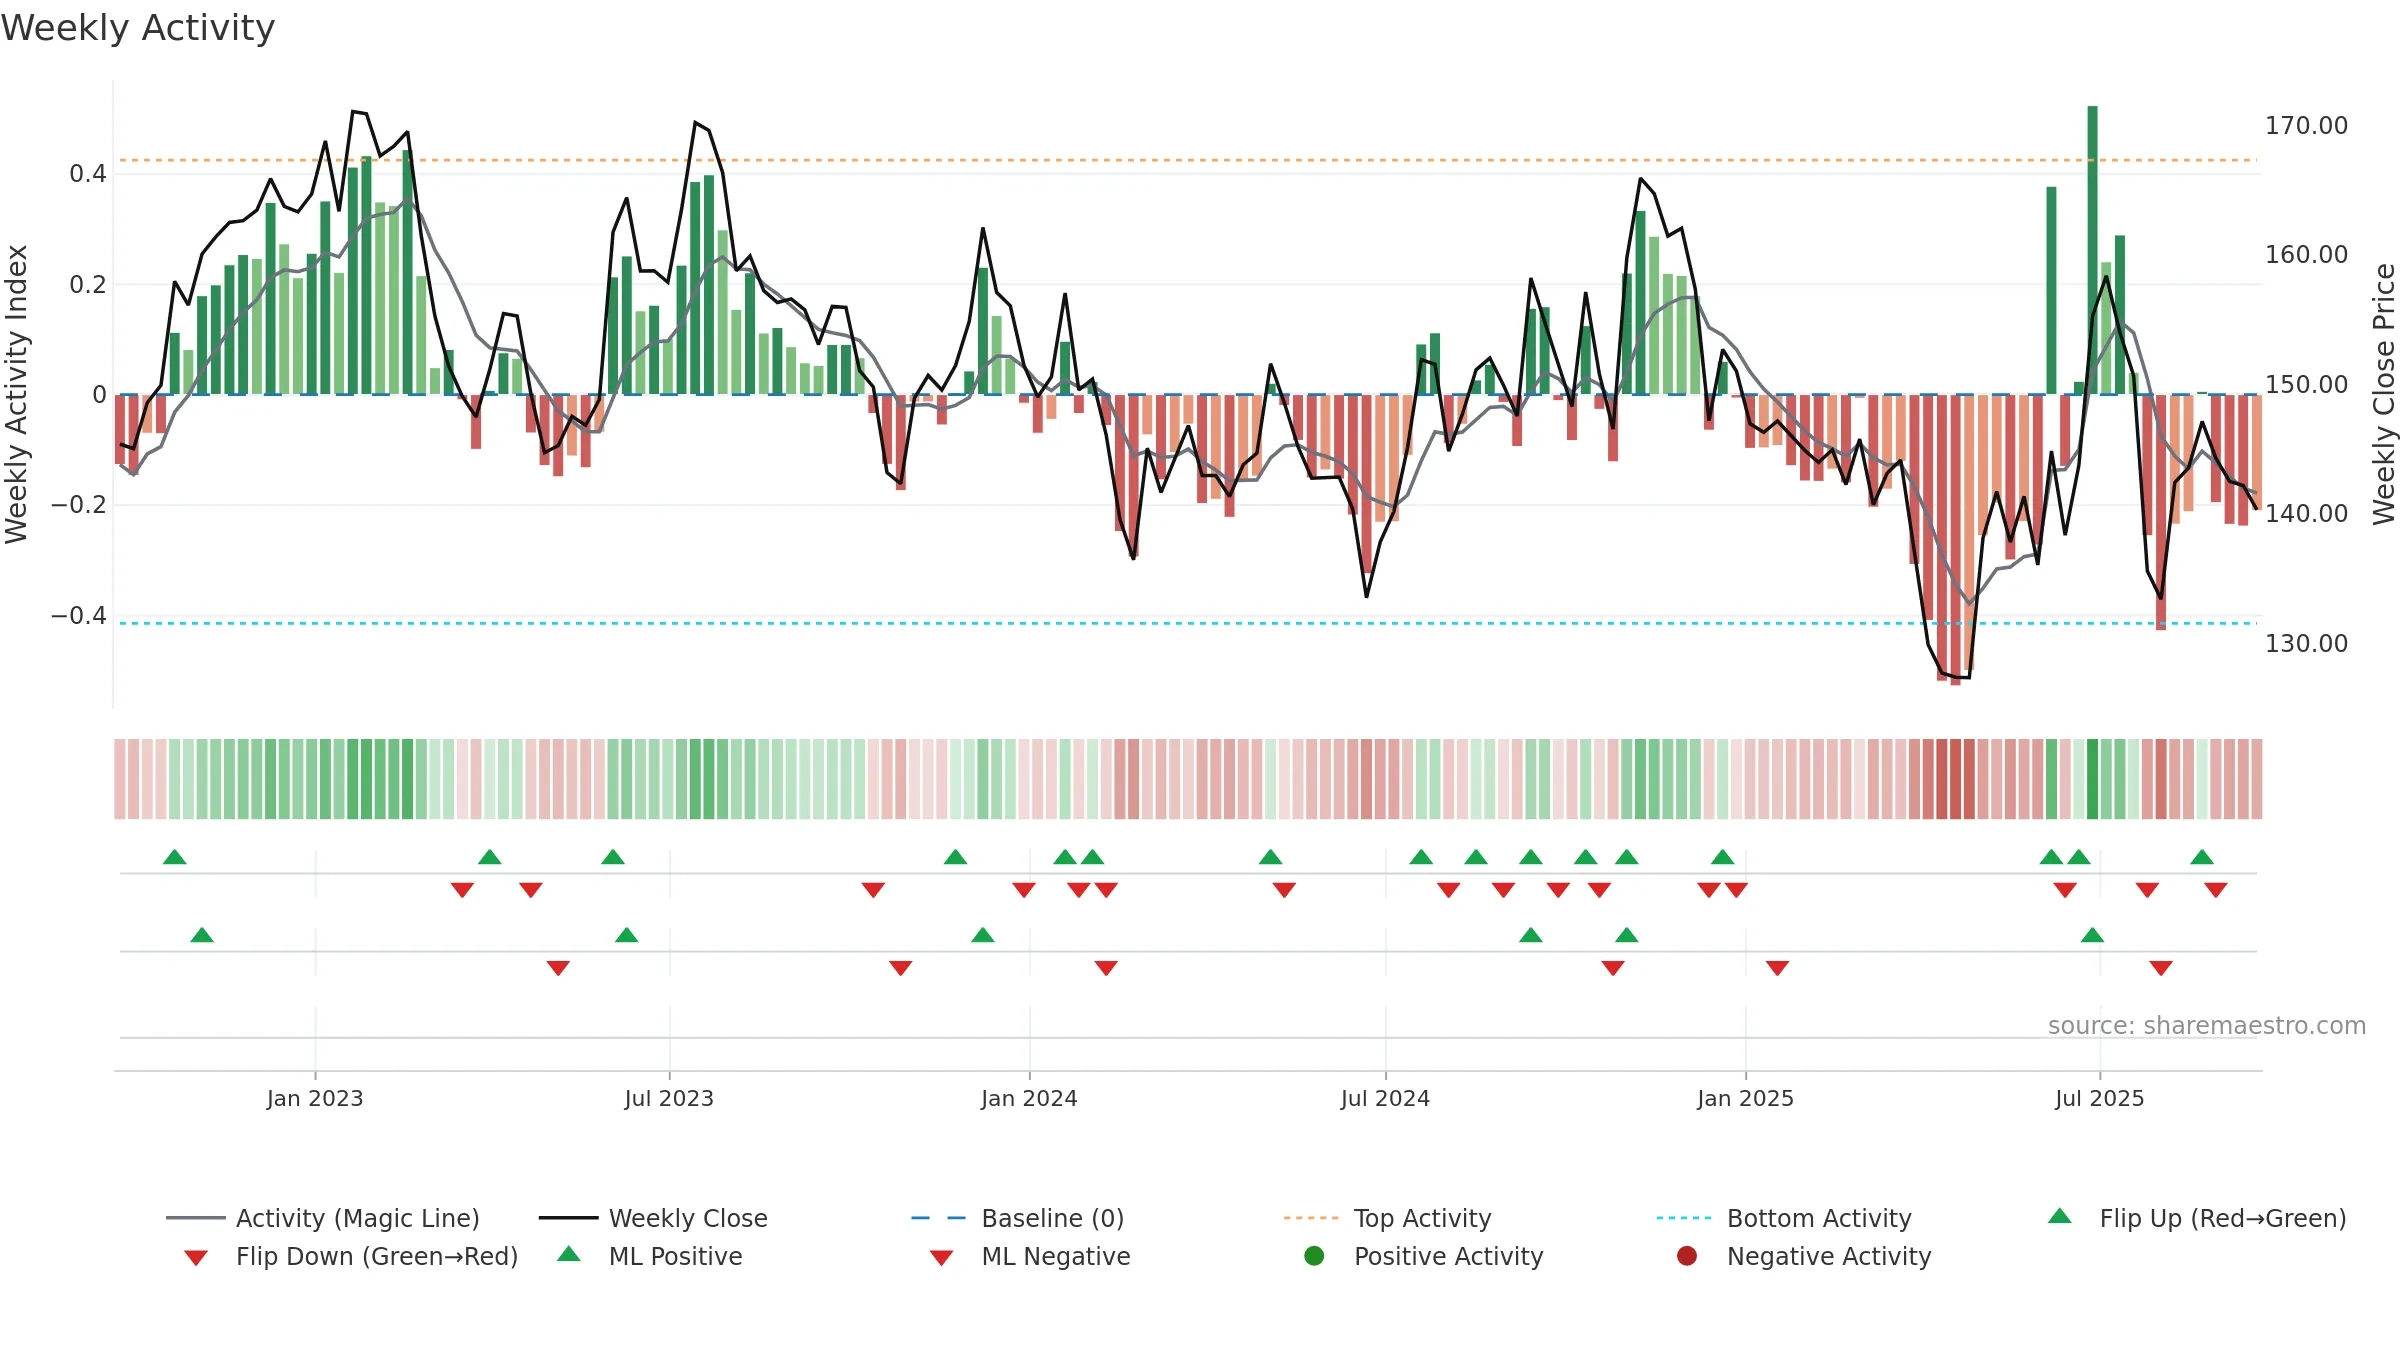
Gauge maps the trend signal to a 0–100 scale.
How to read this — Range-bound conditions; conviction is limited until a break or acceleration emerges.
Wait for a directional break or improving acceleration.

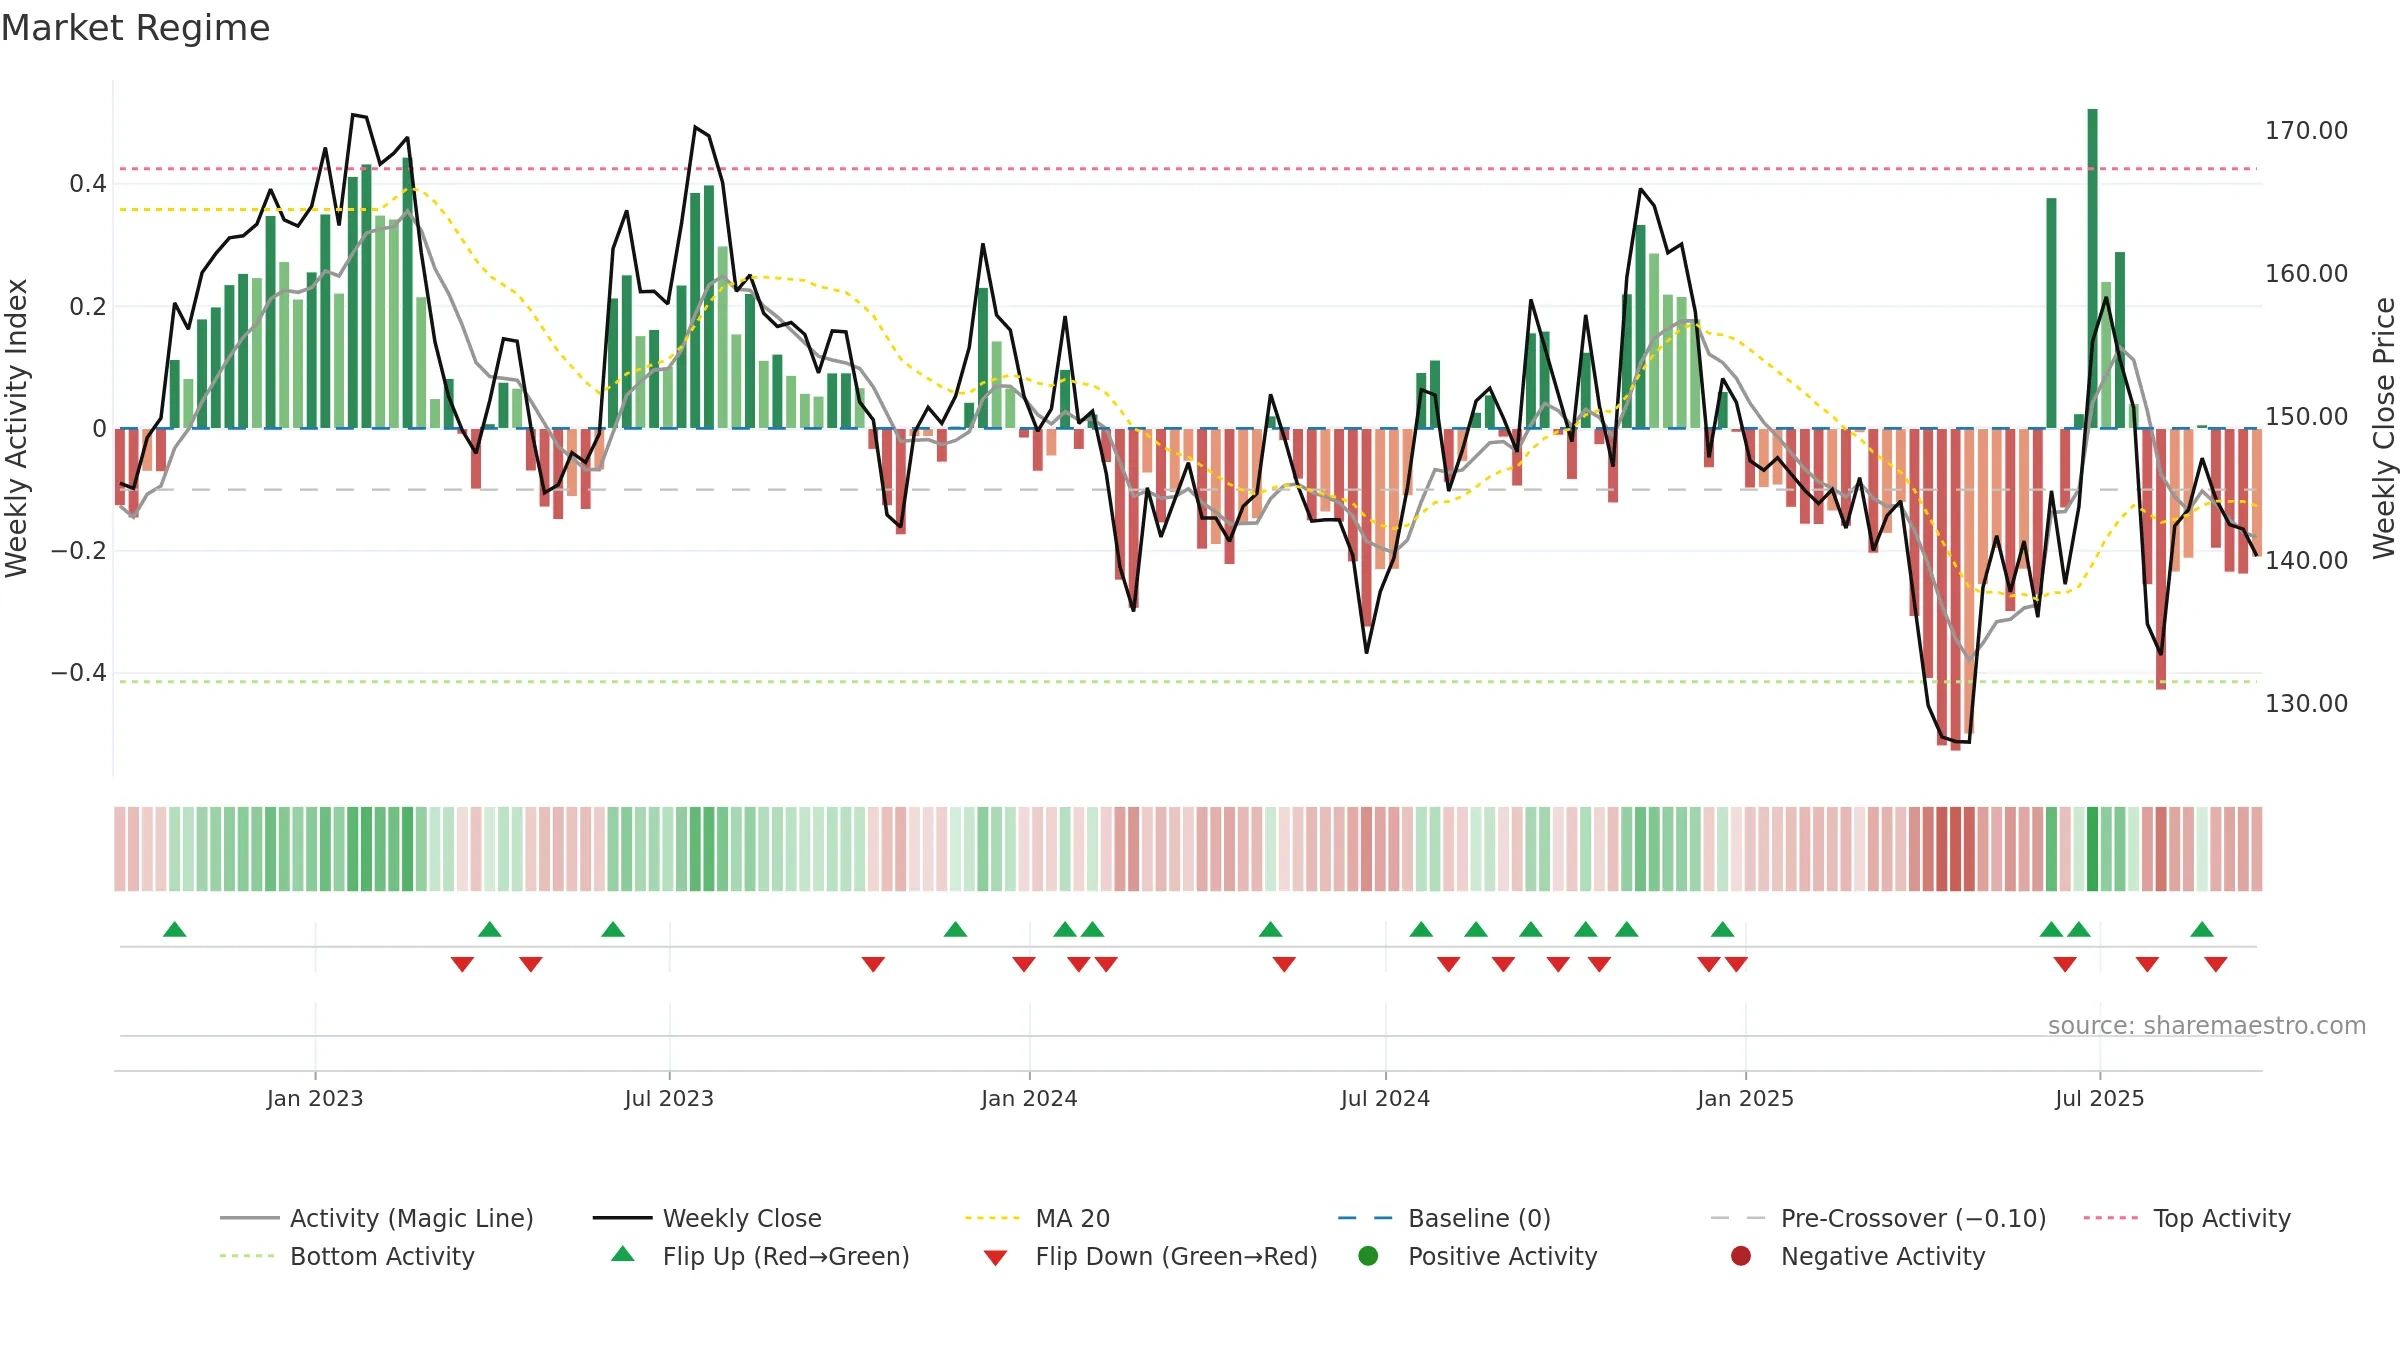
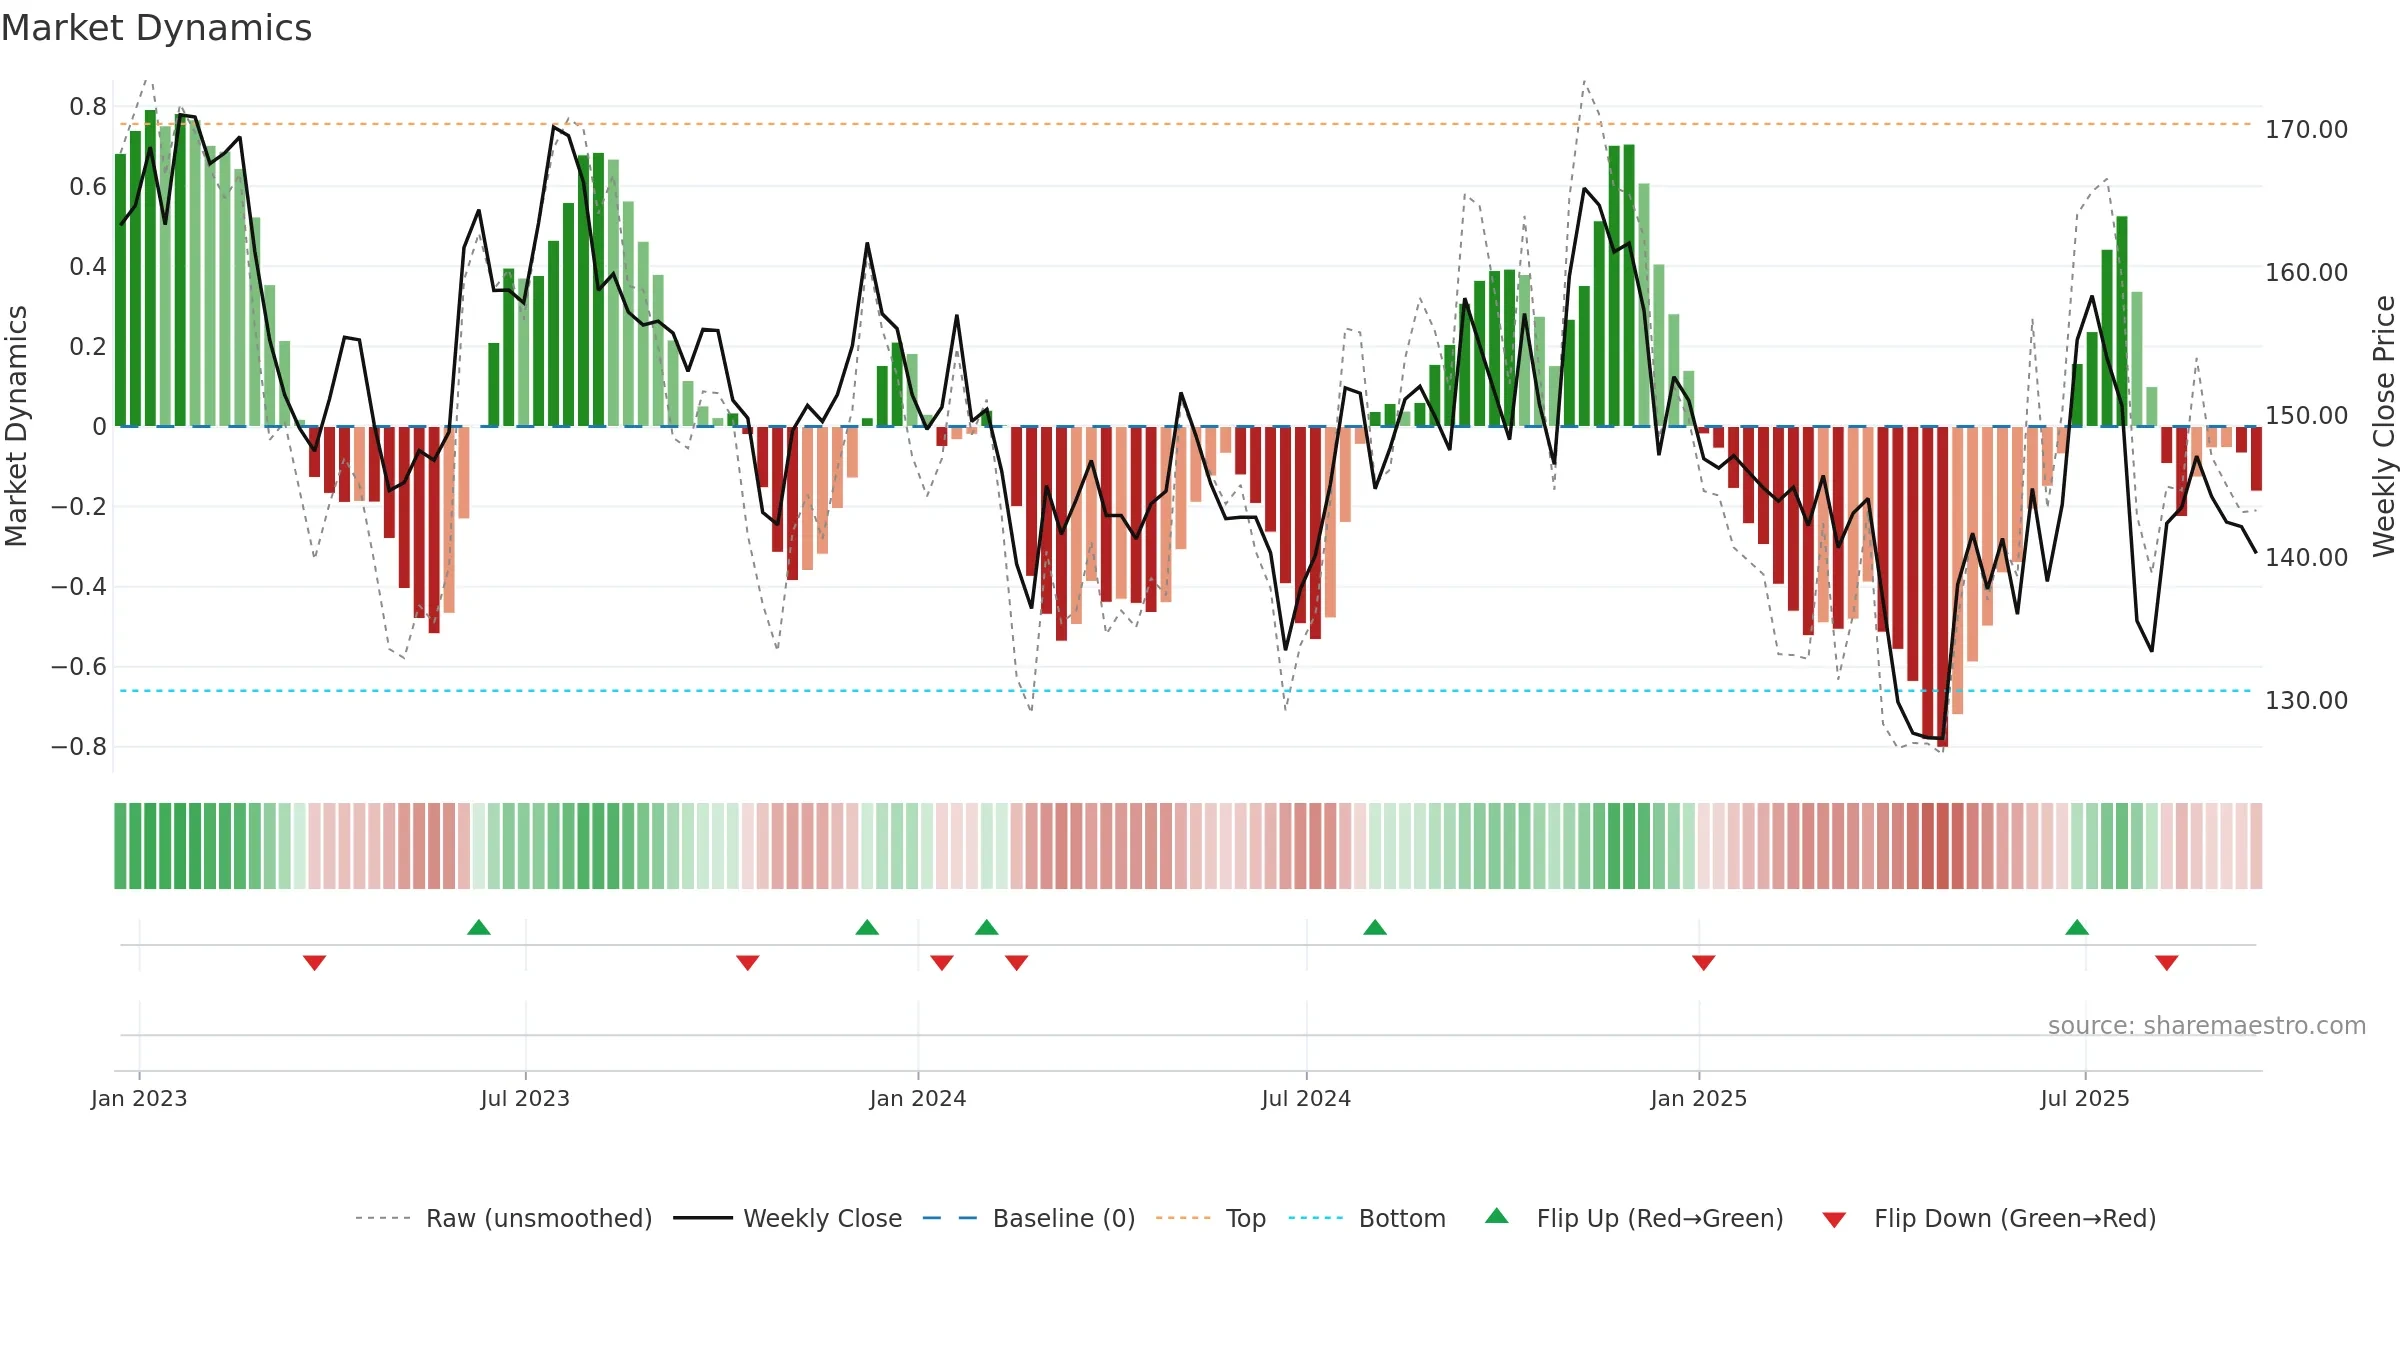
Relative strength is Negative
(< 0%, underperforming).
Latest MRS: -14.44% (week ending Fri, 19 Sep 2025).
Slope: Falling over 8w.
Notes:
- Below zero line indicates relative weakness vs benchmark.
- MRS slope falling over ~8 weeks.
Valuation neutral pending further data.
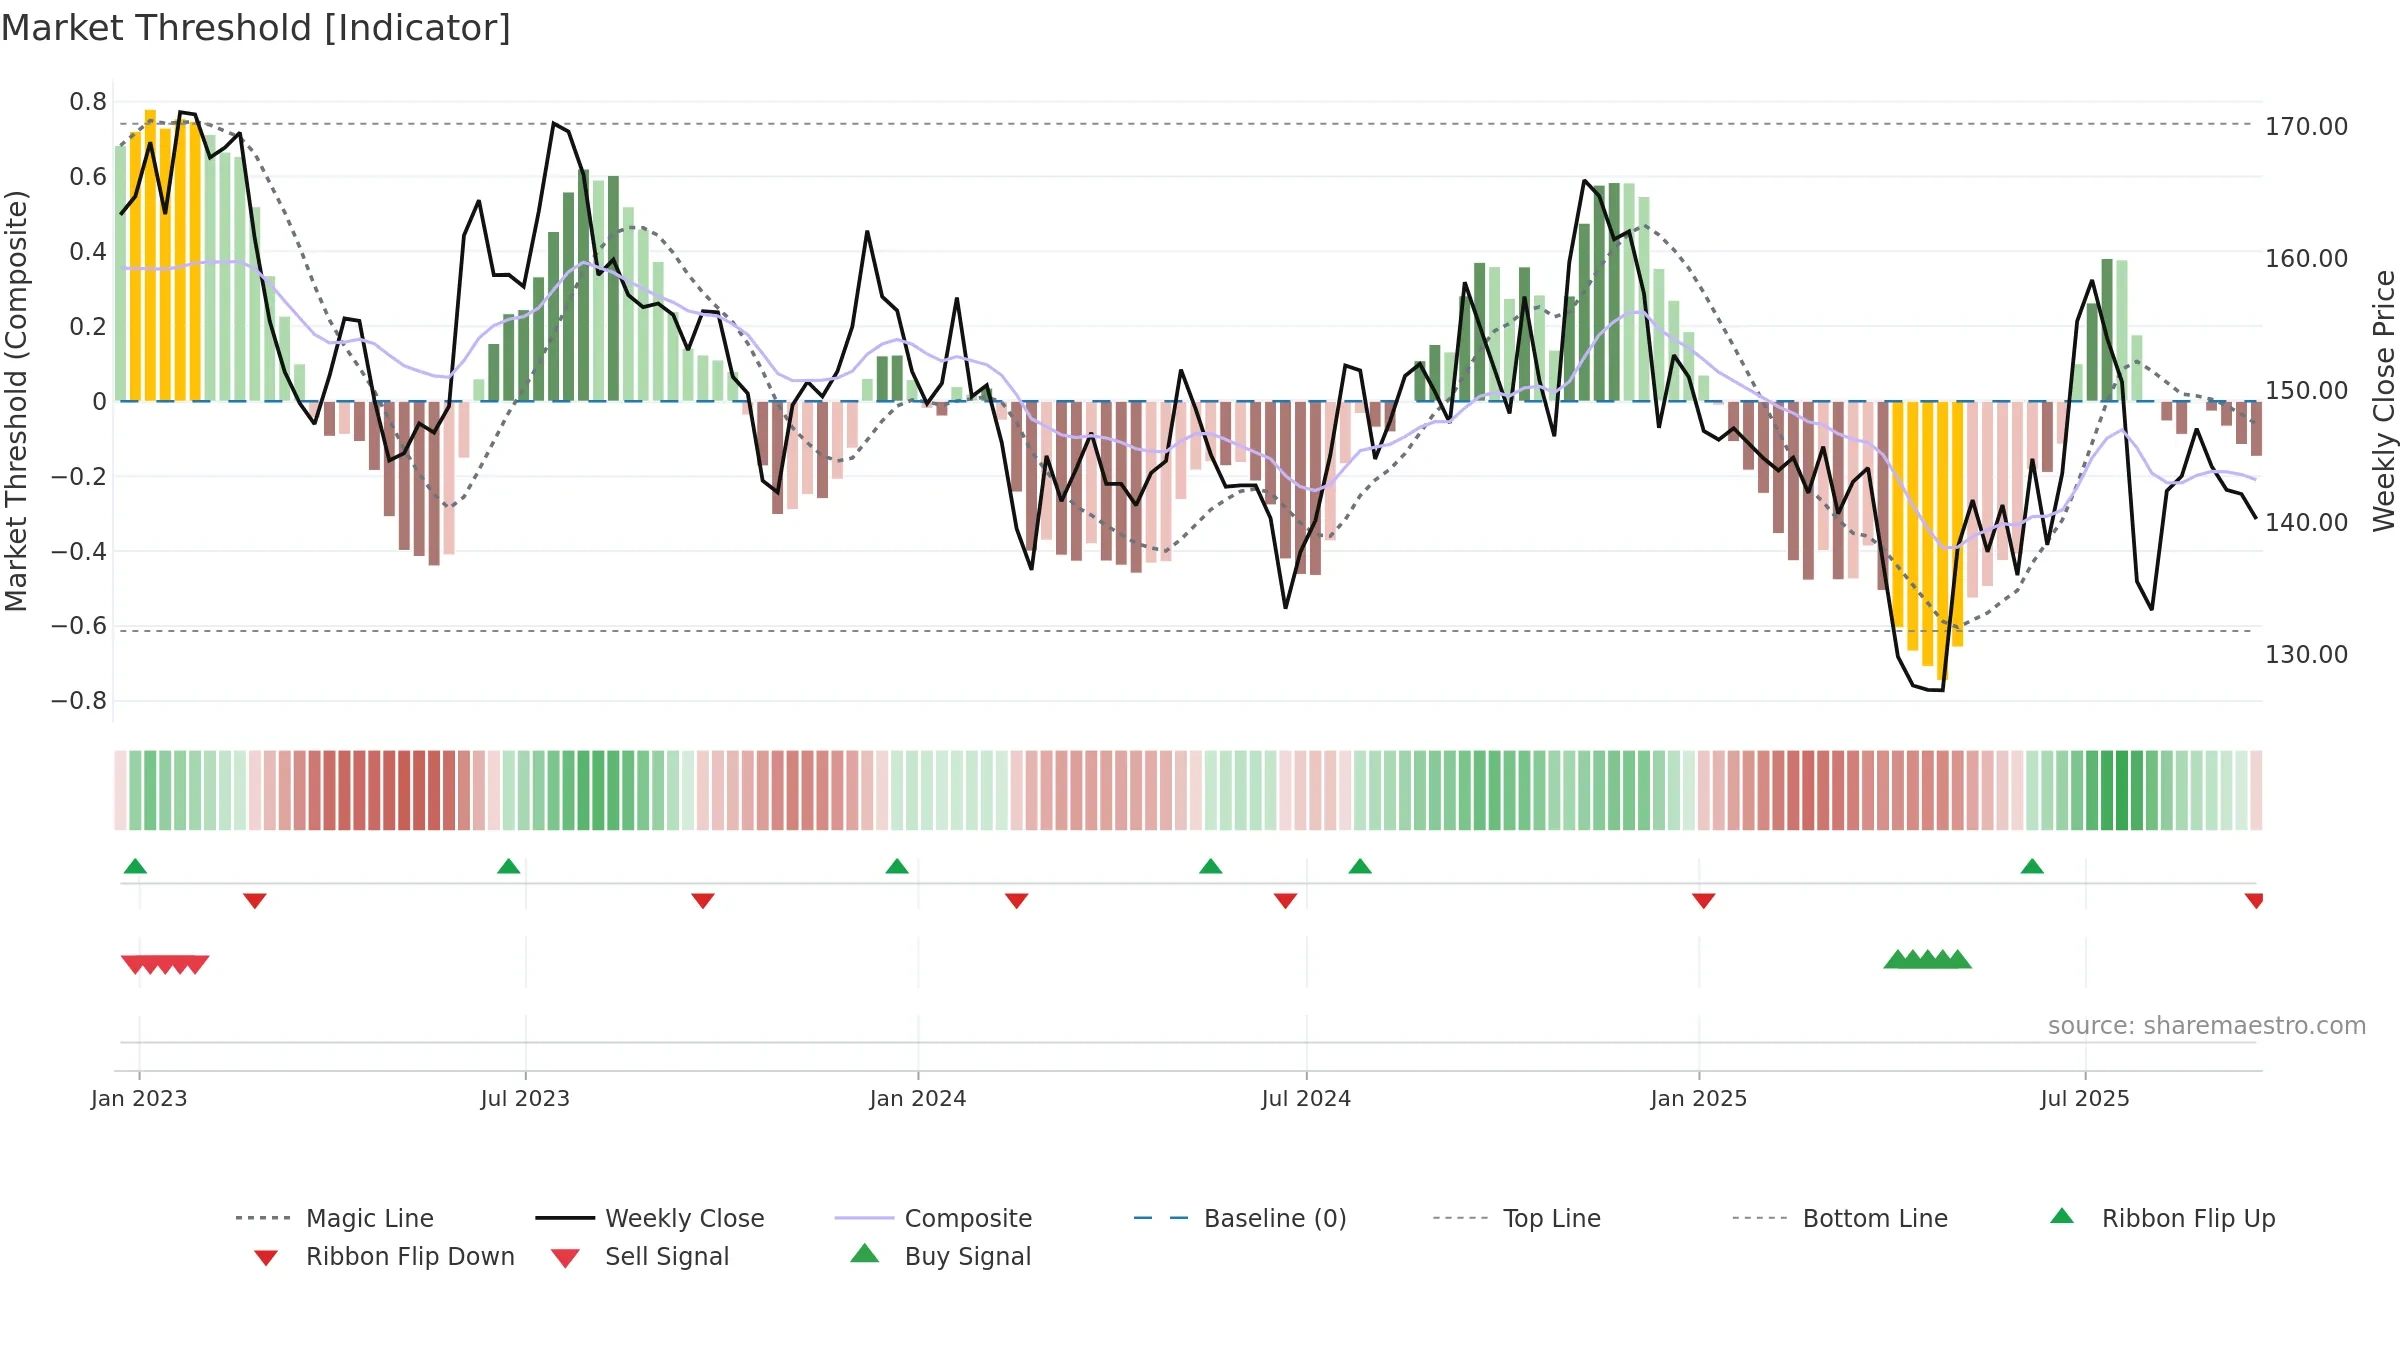
Conclusion
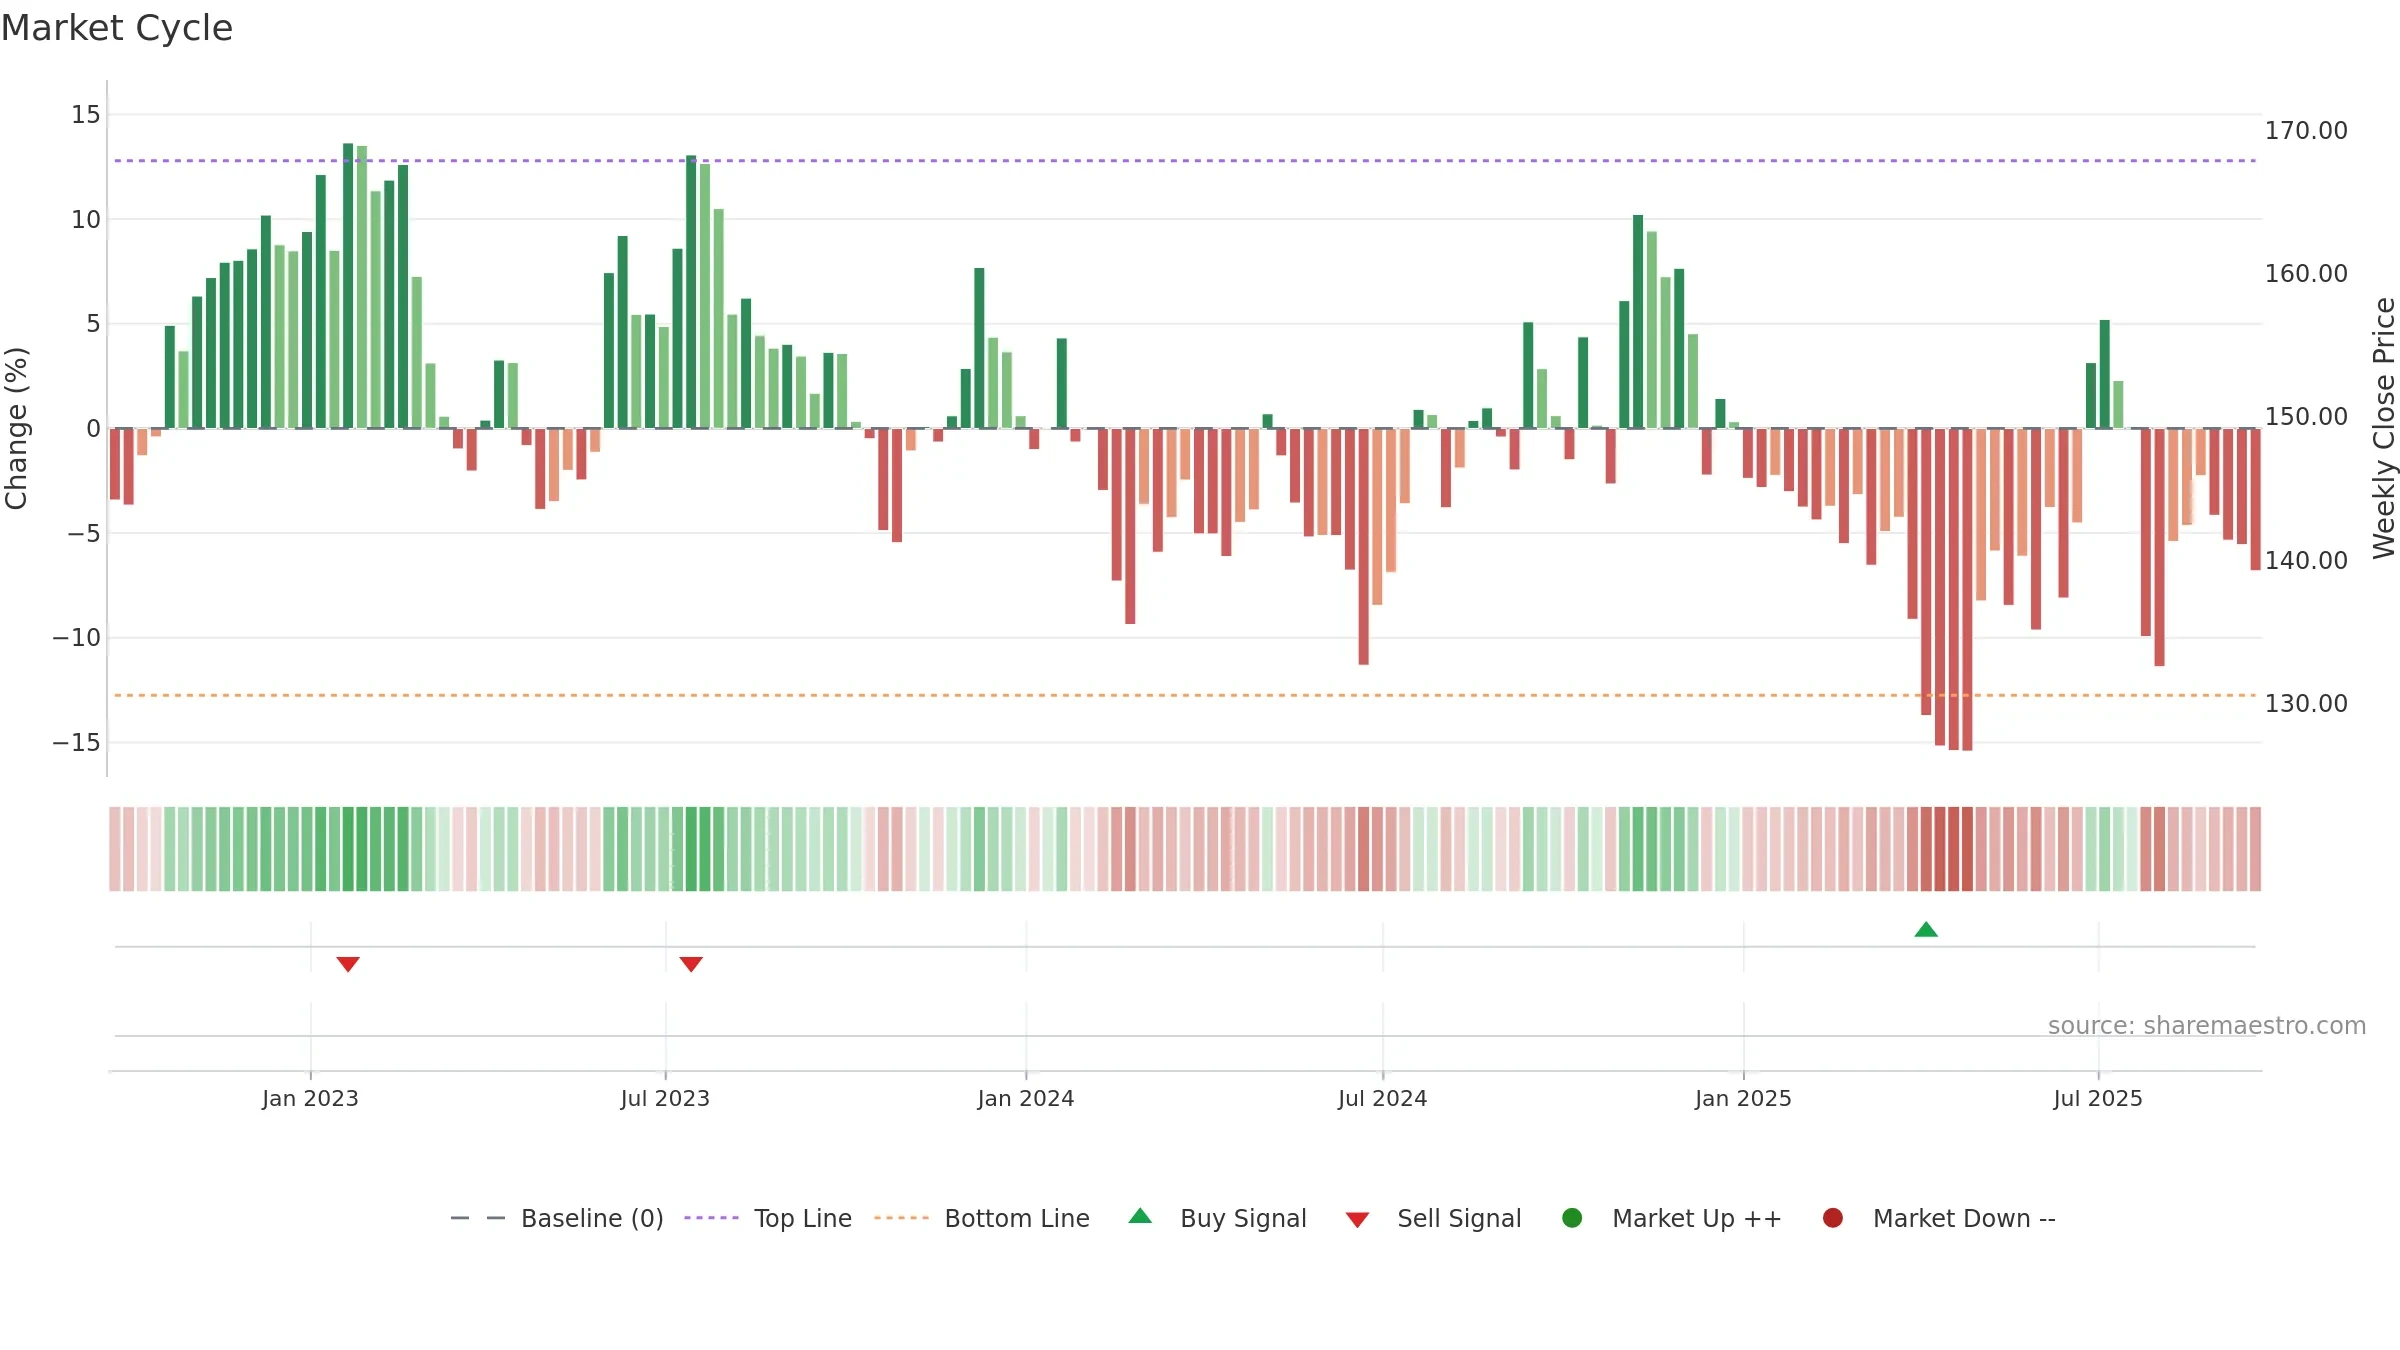
Positive setup. ★★★★☆ confidence. Trend: Range / Neutral · 5.17% over window · vol 1.40% · liquidity convergence · posture below · RS weak
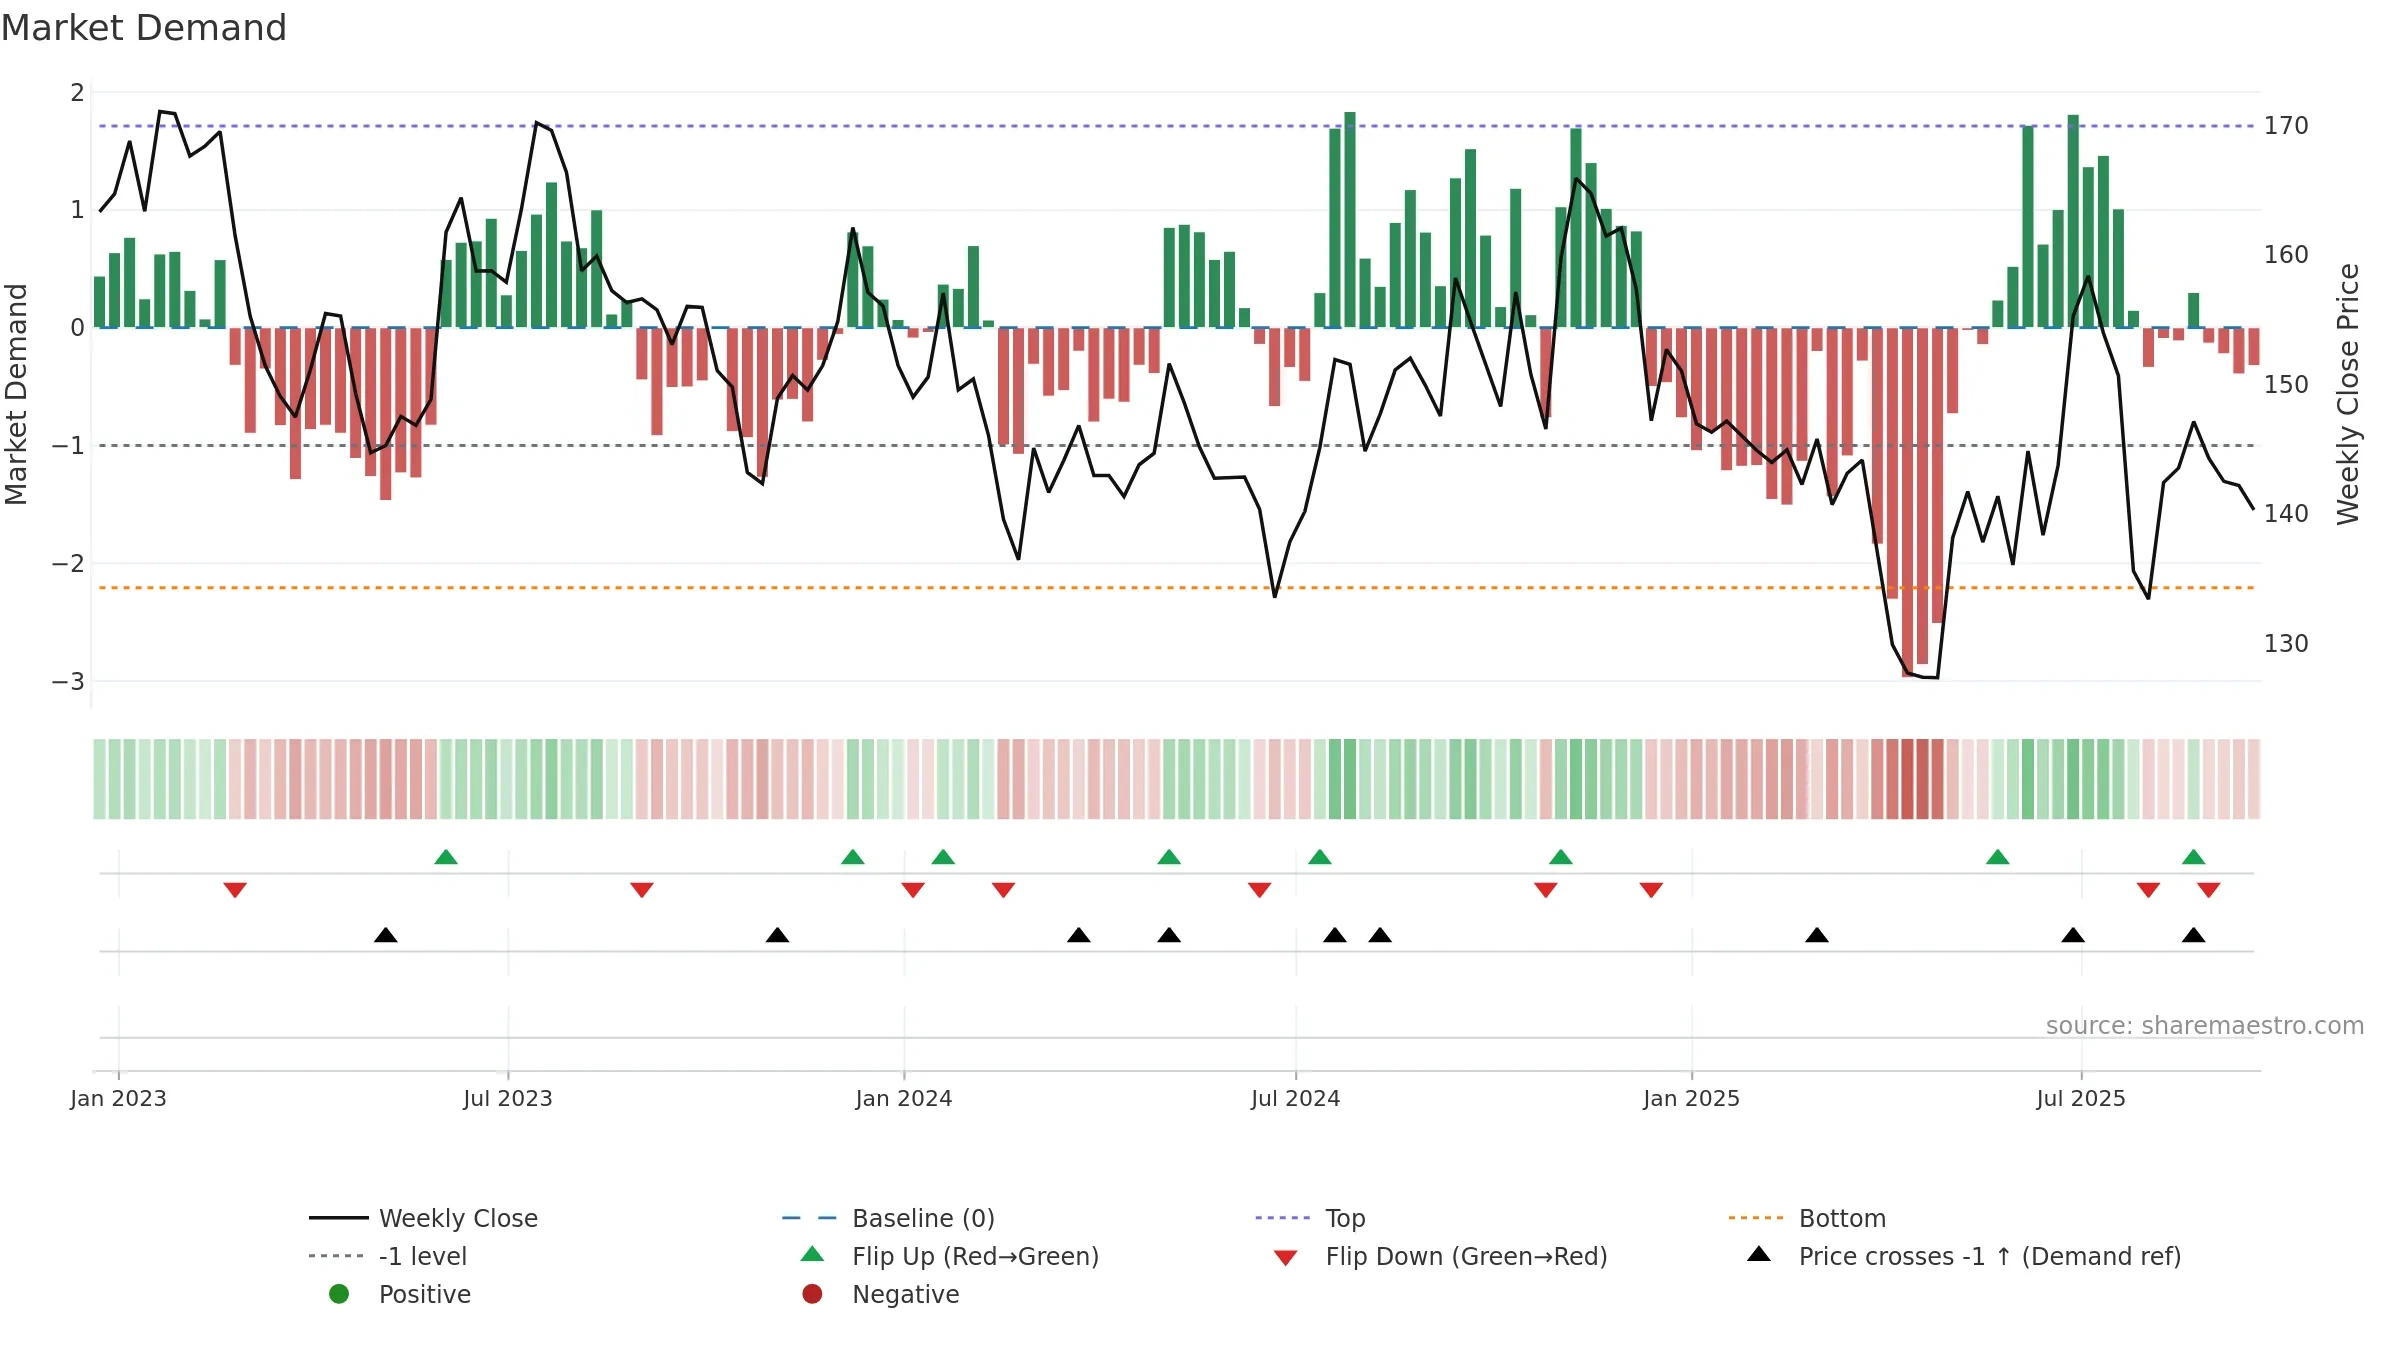
- Liquidity confirms the price trend
- Low return volatility supports durability
- Price is not above key averages
- Mansfield RS: weak & falling
Why: Price window 5.17% over w. Close is -4.64% below the prior-window high. Return volatility 1.40%. Volume trend rising. Liquidity convergence with price. Trend state range / neutral. Momentum neutral and rising. Valuation neutral.
Tip: Most metrics include a hover tooltip where they appear in the report.