Anebulo Pharmaceuticals, Inc.
ANEB NASDAQ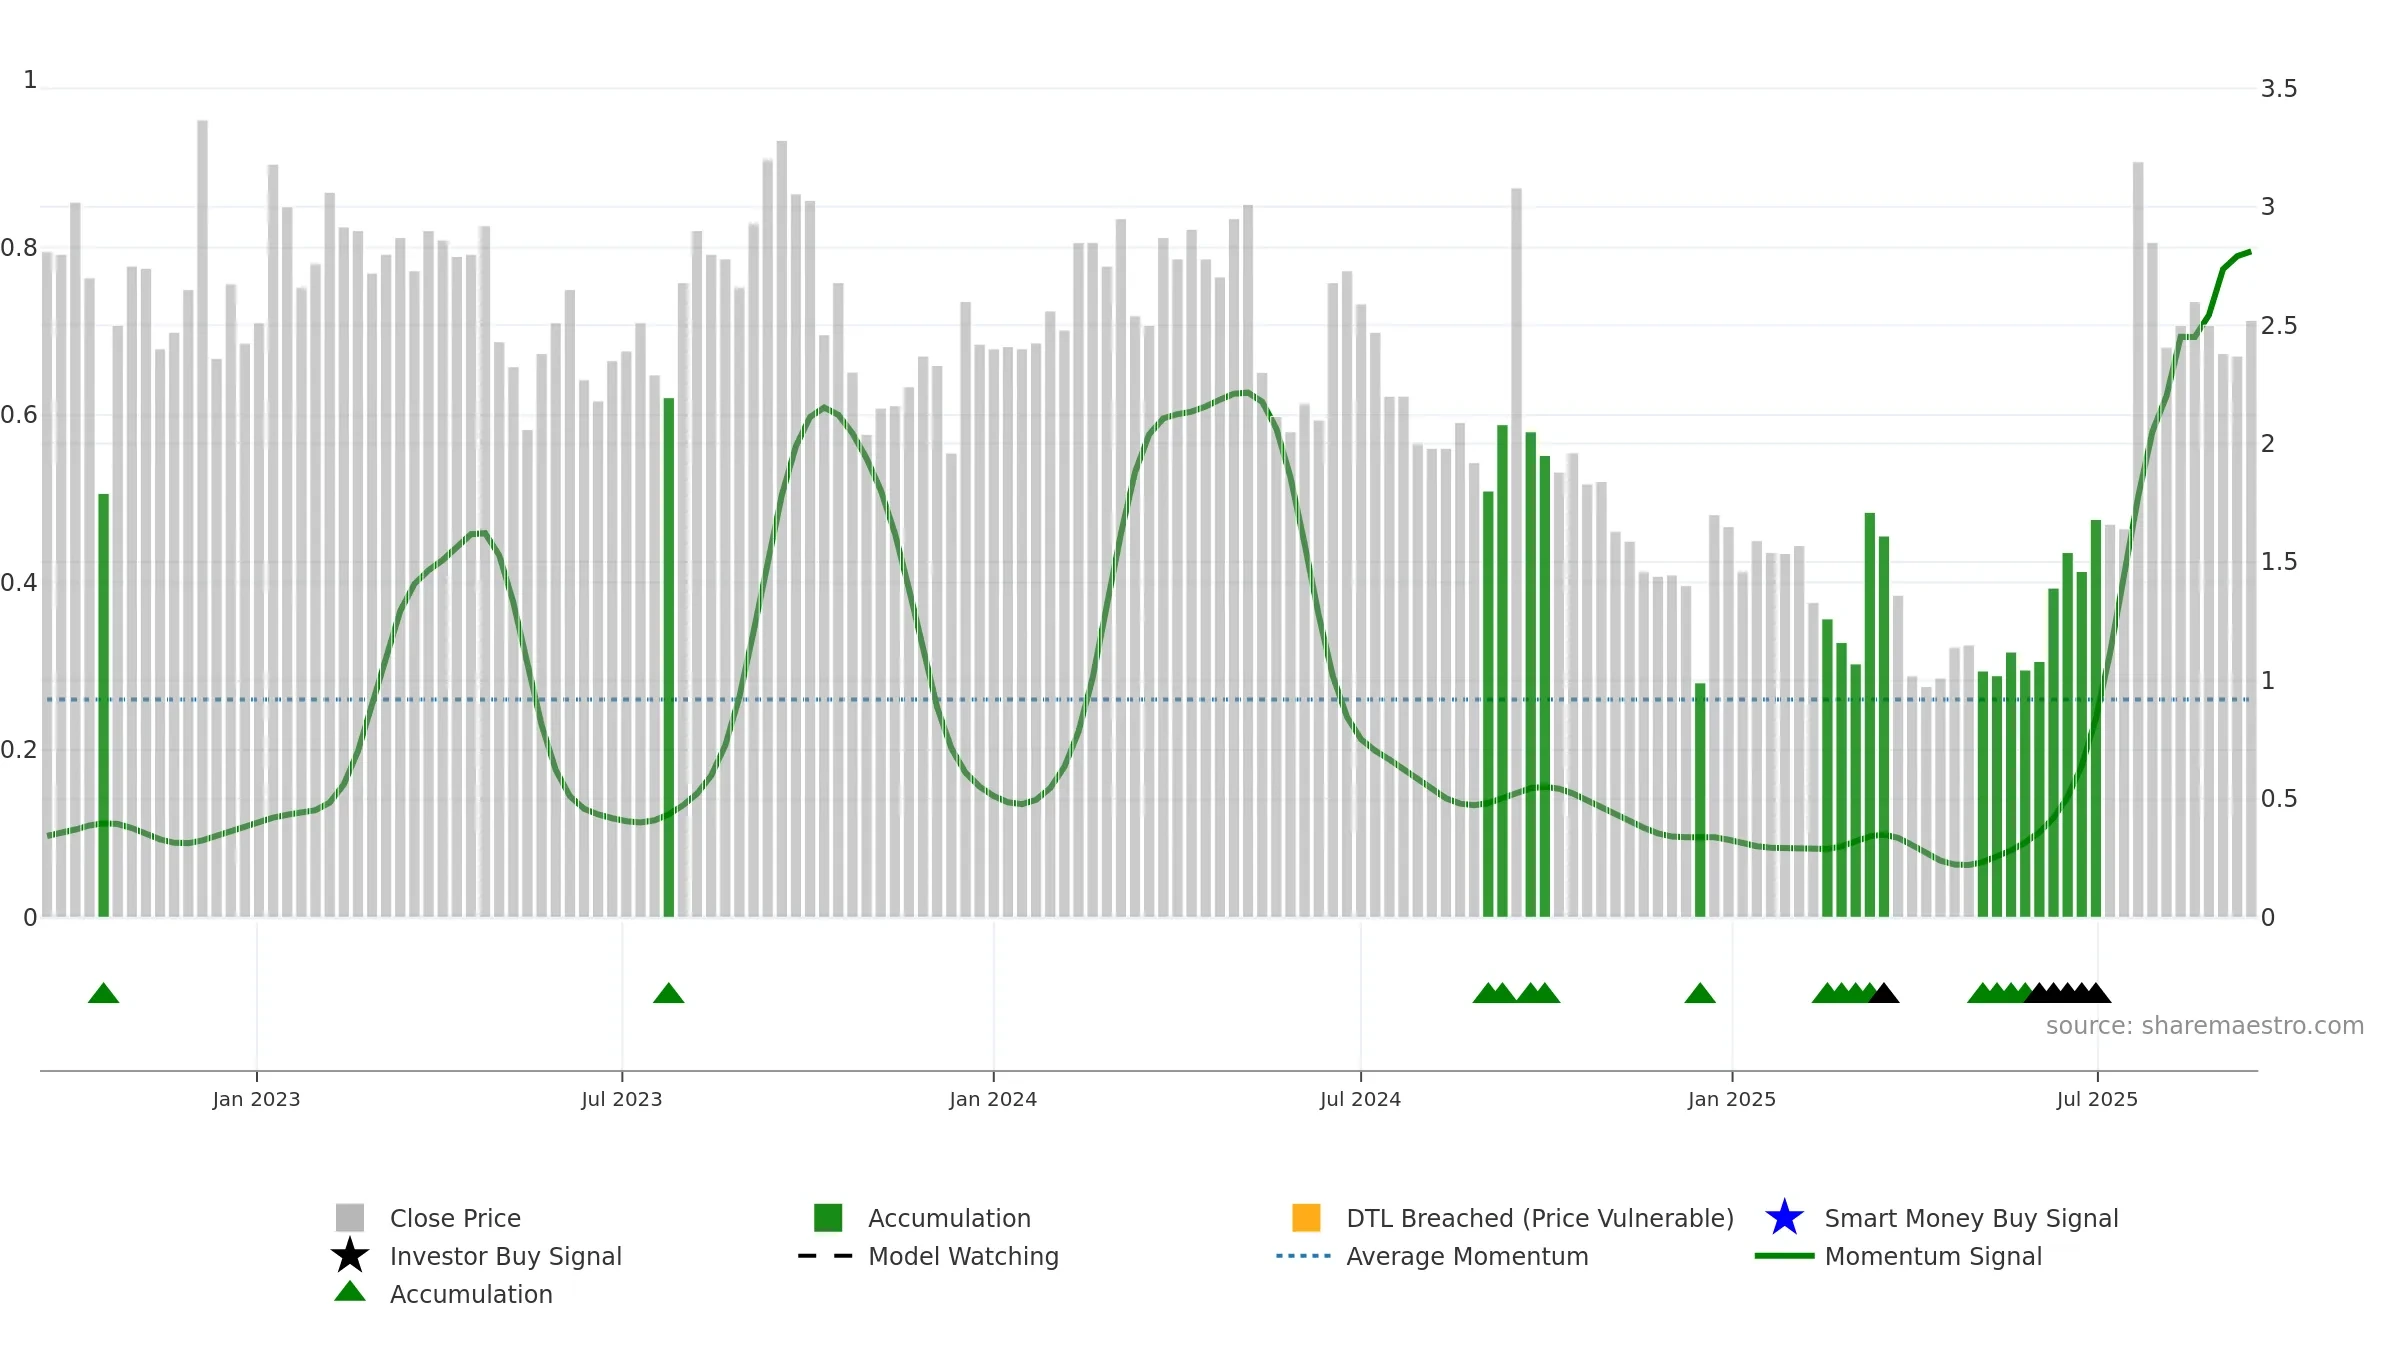
Weekly Report
Anebulo Pharmaceuticals, Inc. closed at 2.5200 (2.02% WoW) . Data window ends Mon, 15 Sep 2025.
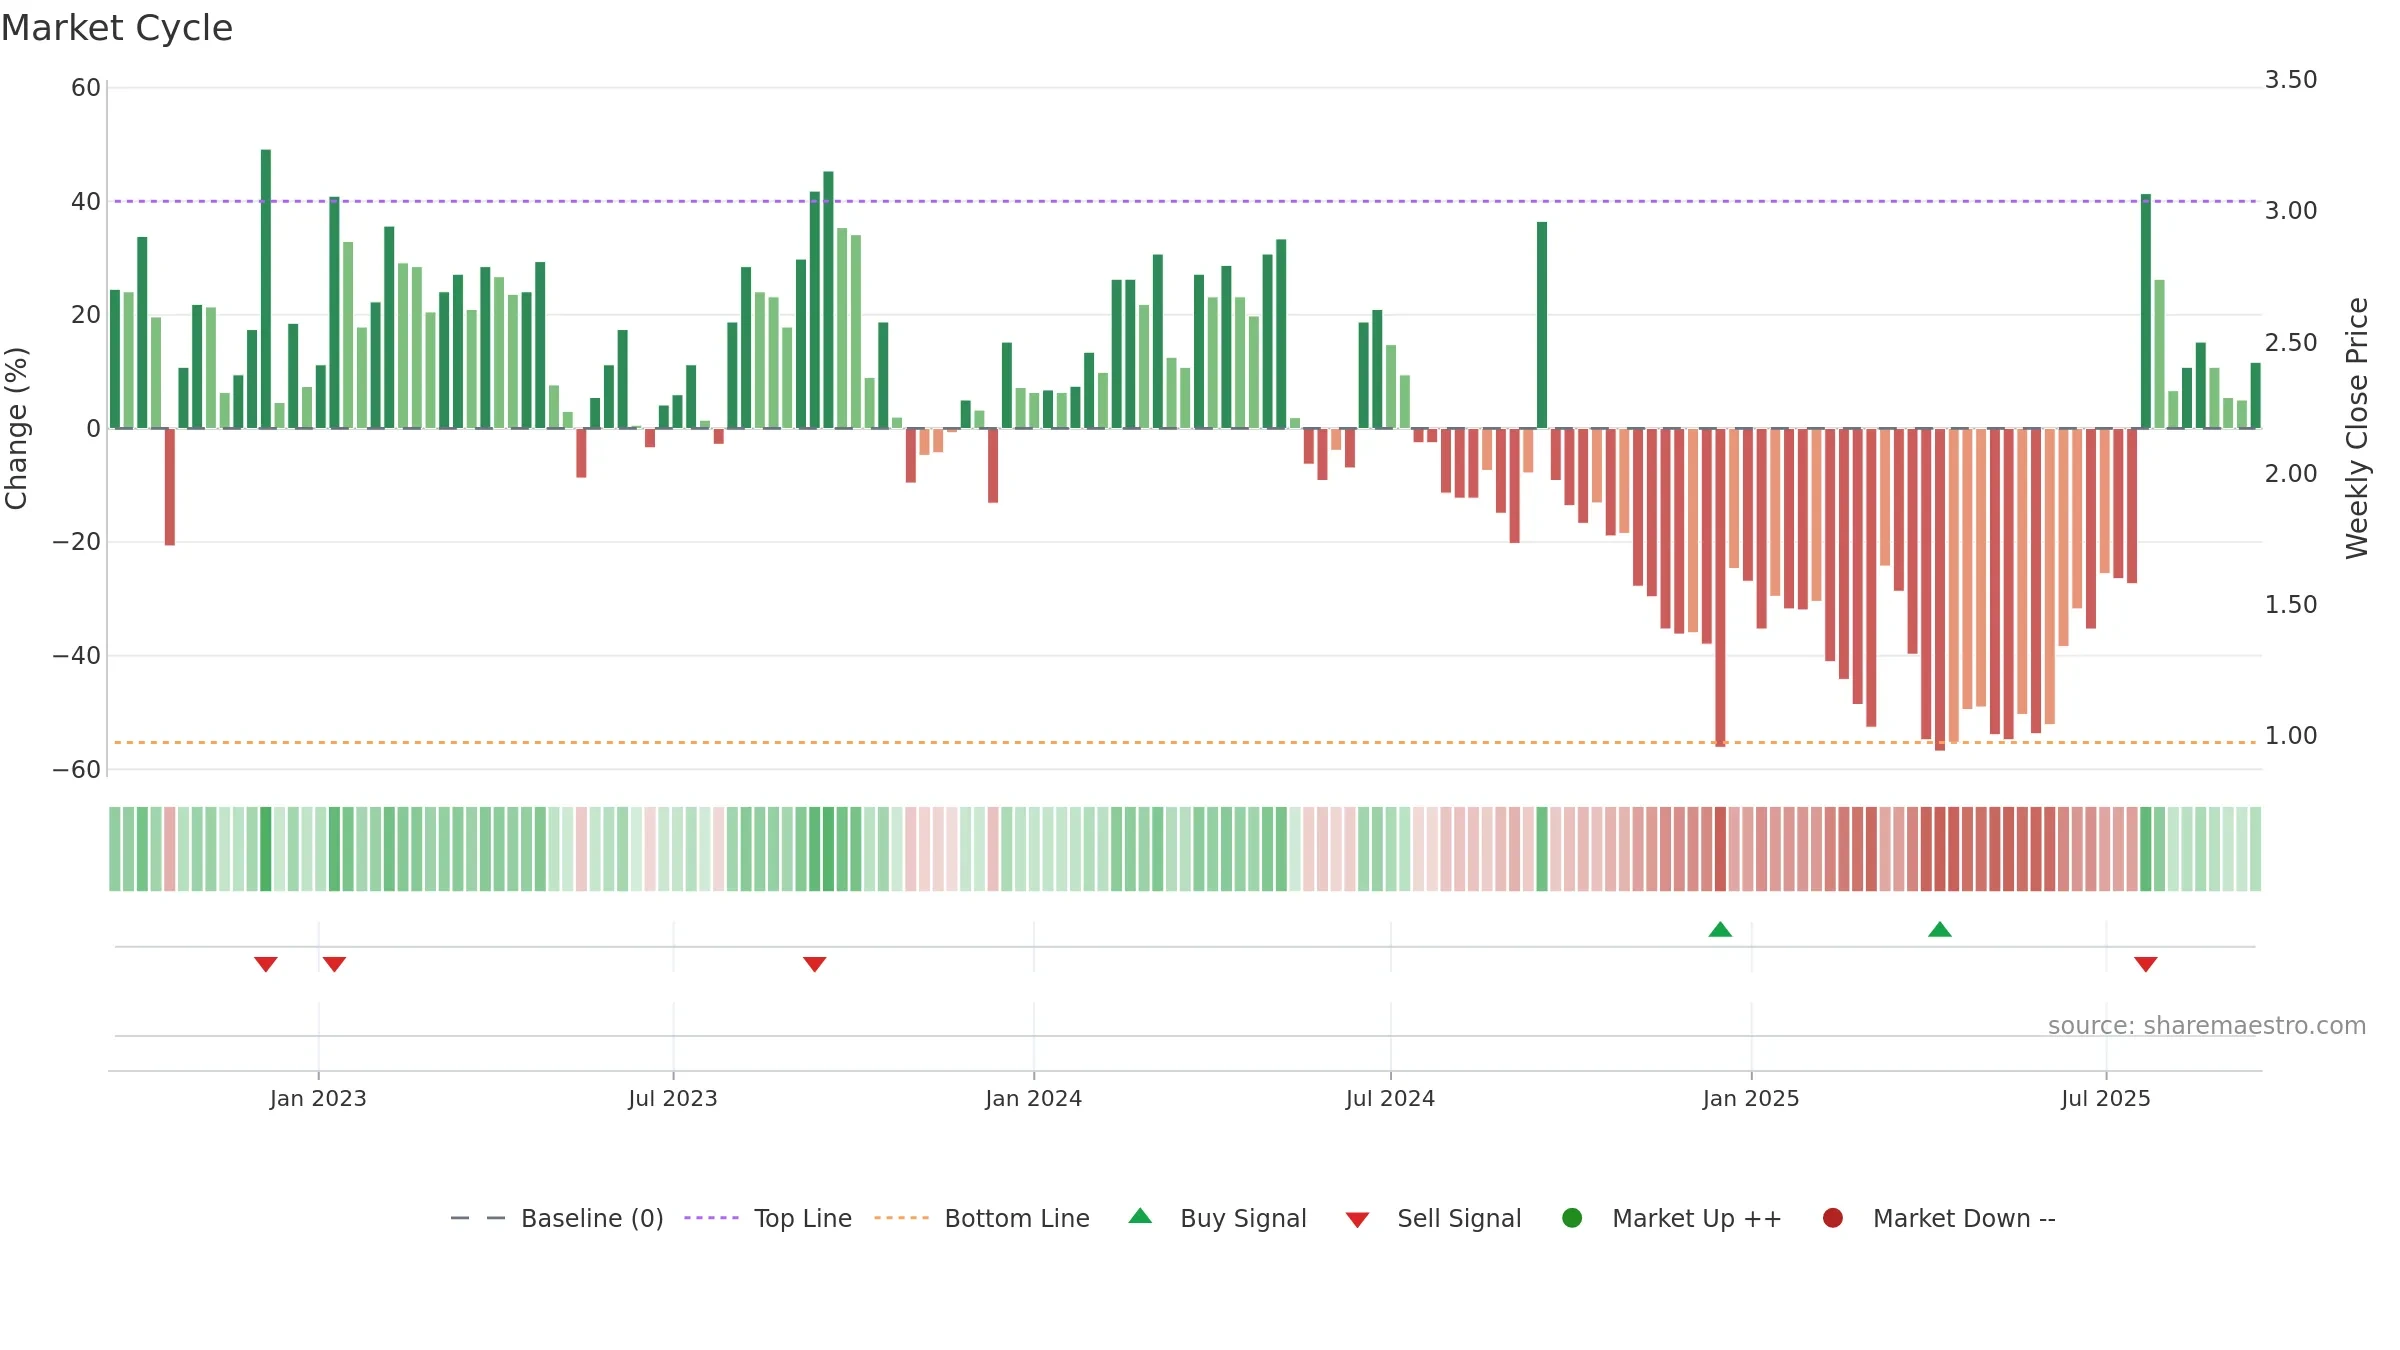
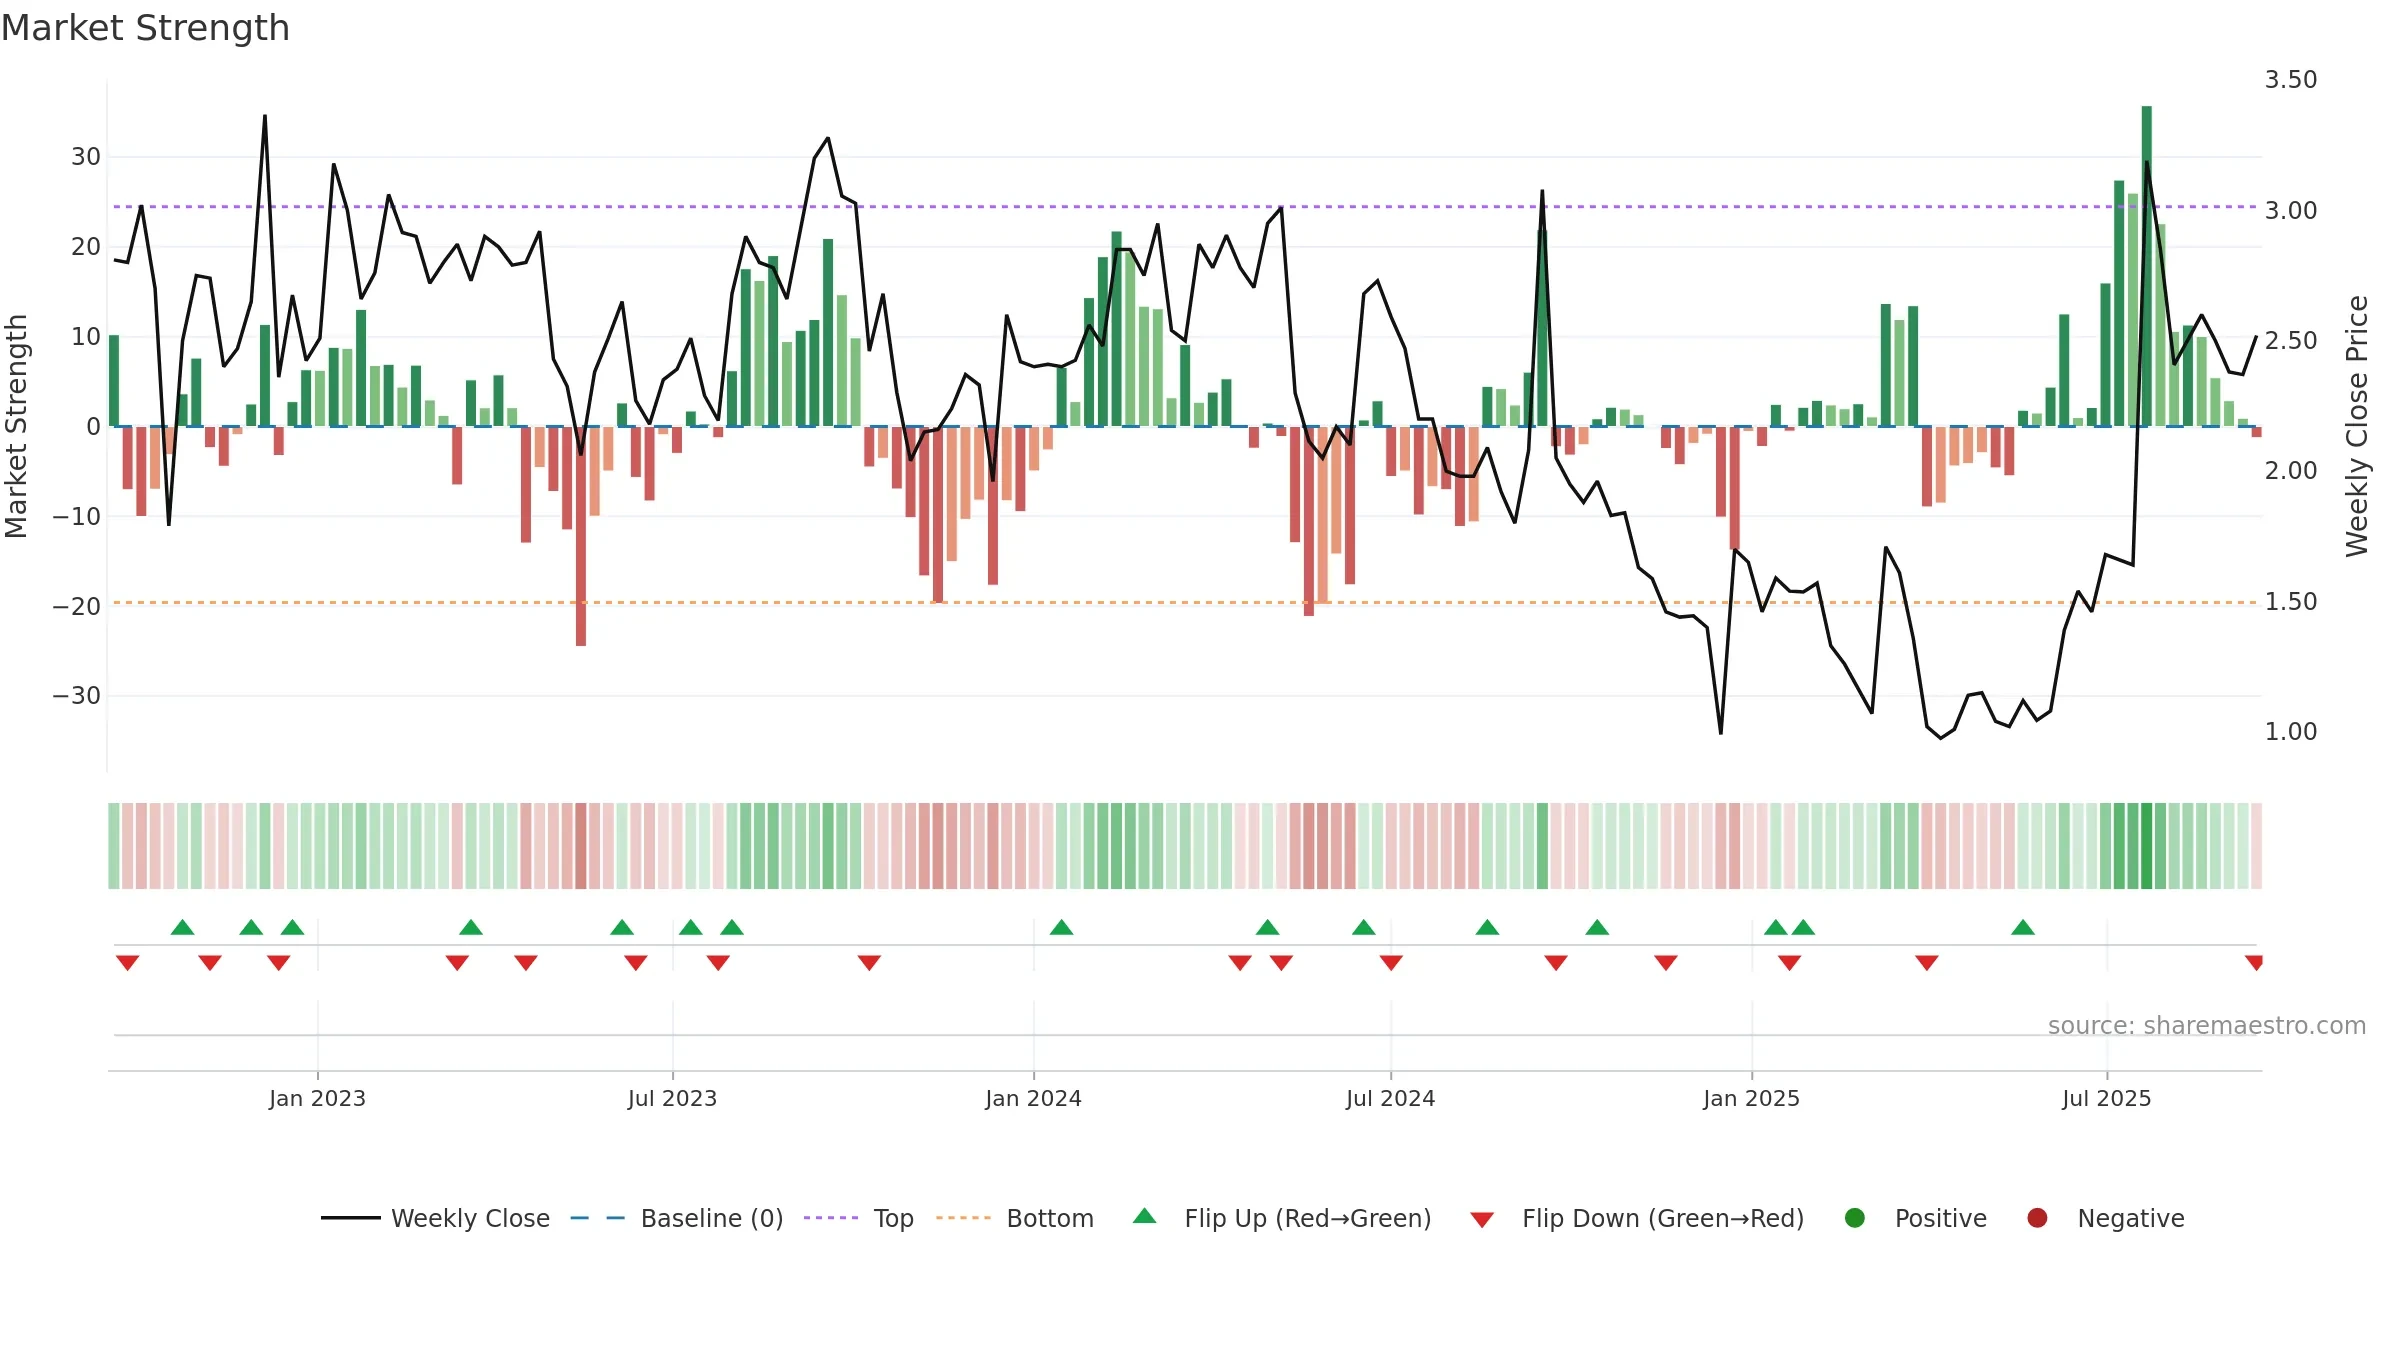
How to read this — Price slope is downward, indicating persistent supply pressure. Elevated weekly volatility increases whipsaw risk. Volume trend diverges from price — watch for fatigue or rotation. Price holds above key averages, indicating constructive participation.
Down-slope argues for patience; rallies can fade sooner unless participation improves. Because liquidity isn’t confirming, prefer evidence of fresh demand before chasing moves.
Gauge maps the trend signal to a 0–100 scale.
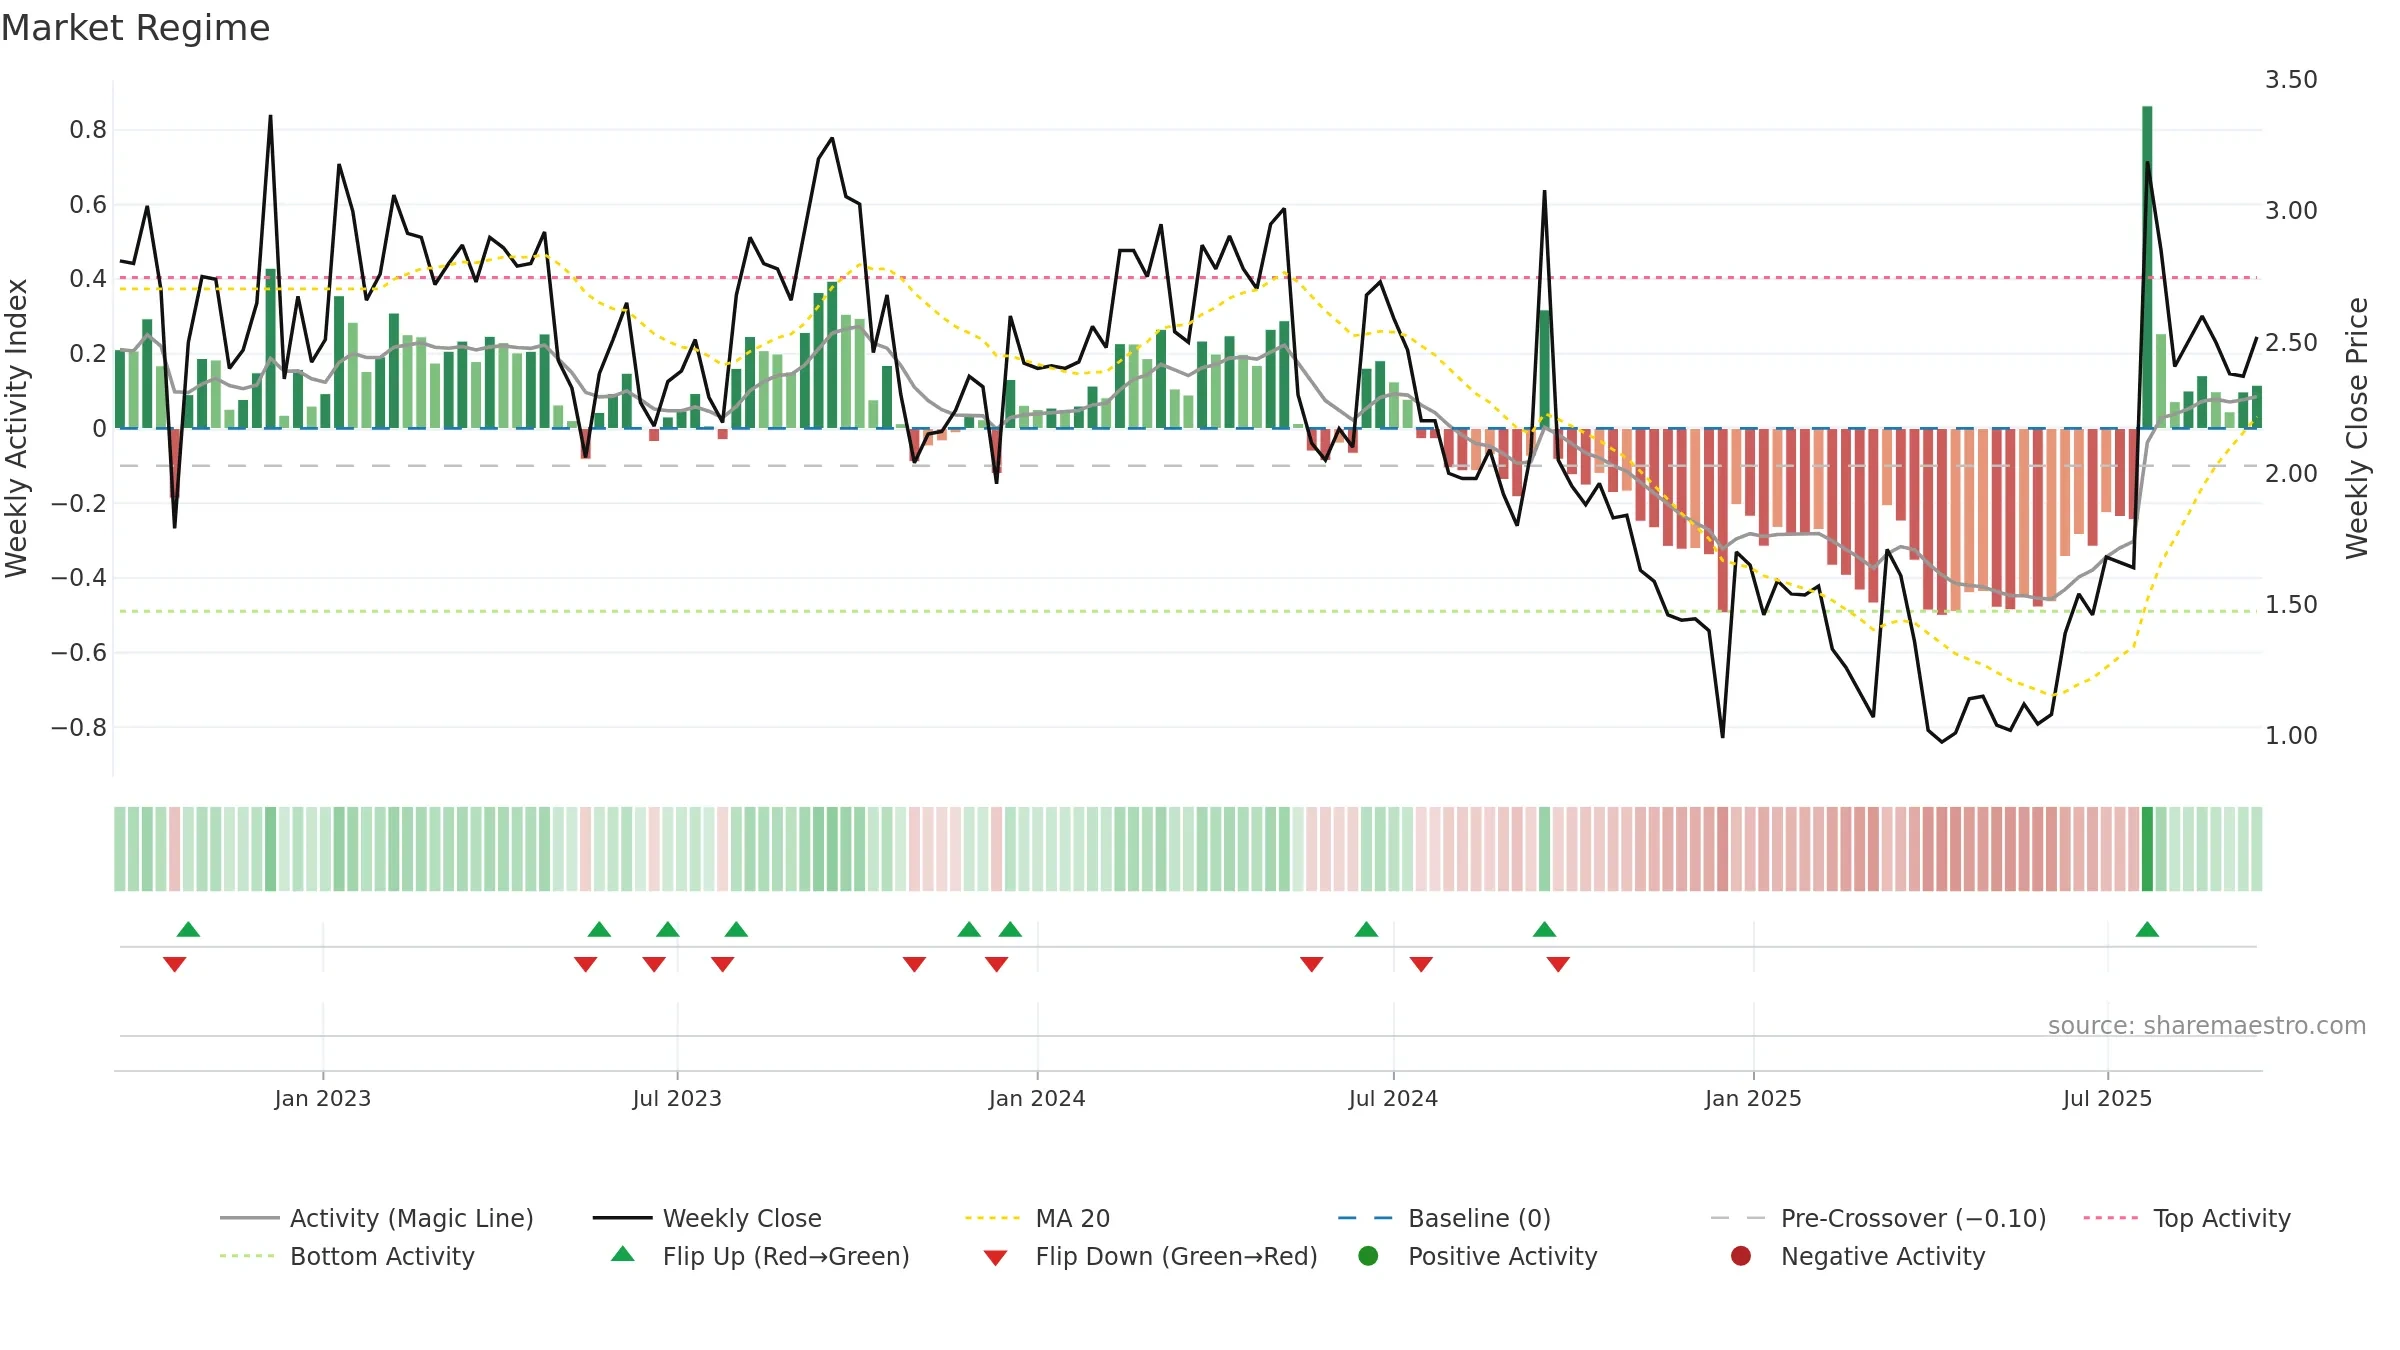
How to read this — Range-bound conditions; conviction is limited until a break or acceleration emerges.
Wait for a directional break or improving acceleration.
Conclusion
Neutral setup. ★★★☆☆ confidence. Price window: -11. Trend: Range / Neutral; gauge 79. In combination, liquidity diverges from price.
- Momentum is bullish and rising
- Price holds above 8w & 26w averages
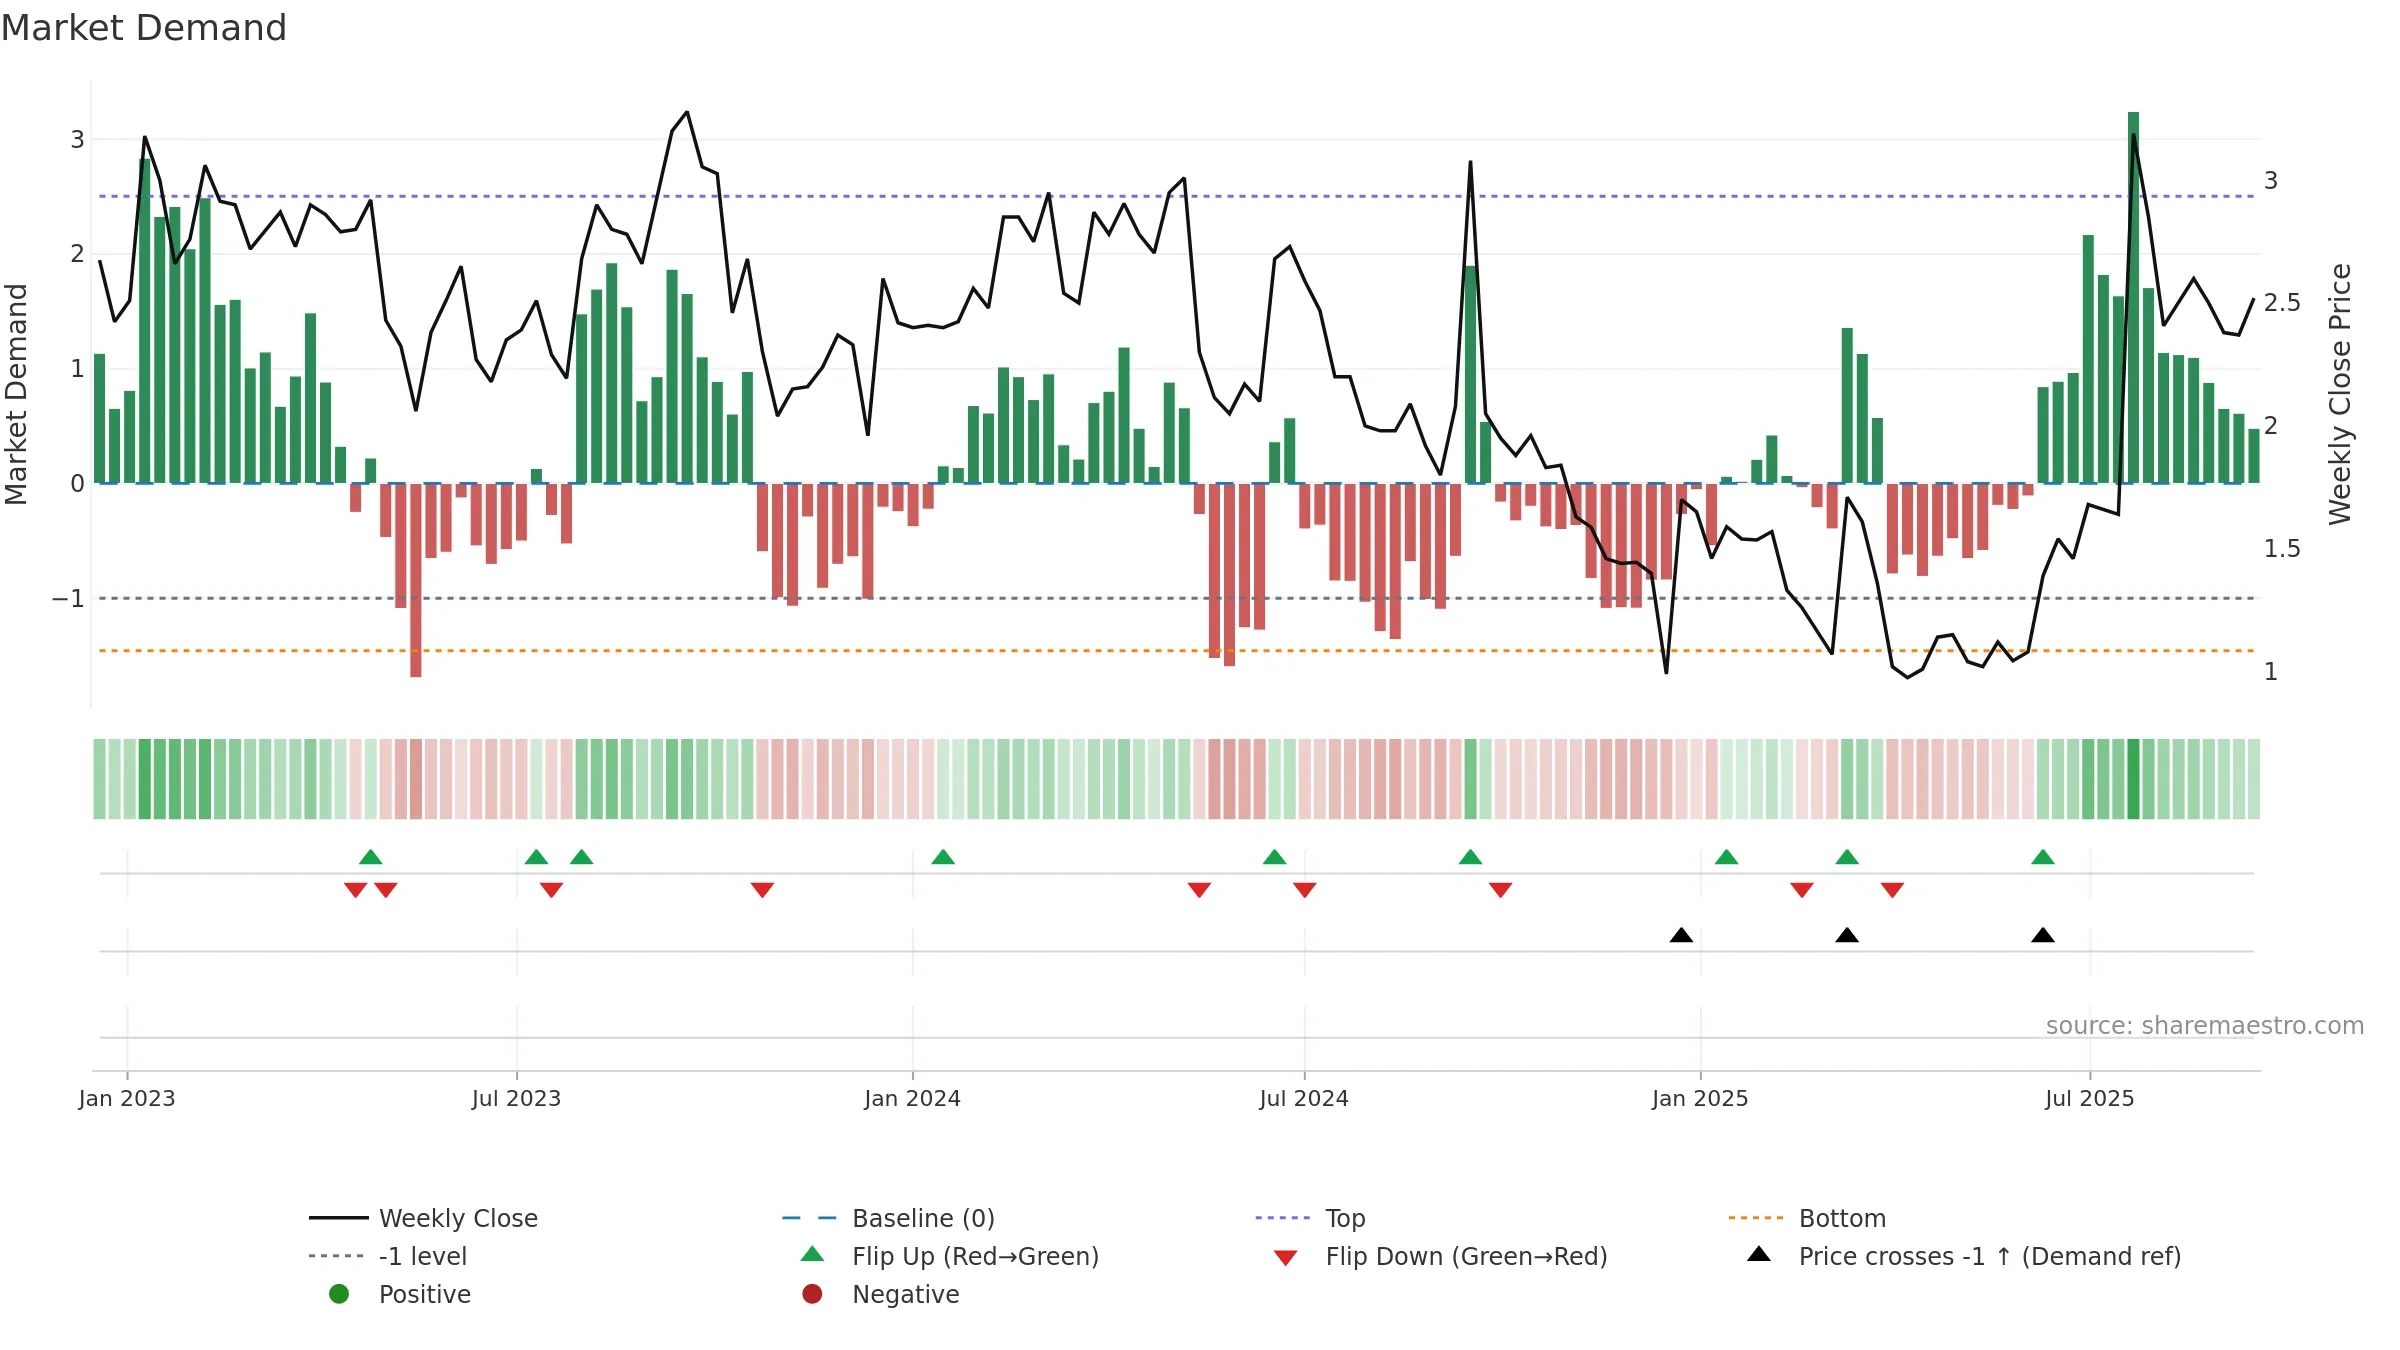
- Liquidity diverges from price
- High return volatility raises whipsaw risk
- Negative multi-week performance
Why: Price window -11.58% over 8w. Close is -11.58% below the prior-window high. Return volatility 5.96%. Volume trend rising. Liquidity divergence with price. Trend state range / neutral. Momentum bullish and rising.
Tip: Most metrics include a hover tooltip where they appear in the report.