No results found.

JPMorgan BetaBuilders U.S. Mid Cap Equity ETF

BBMC ETF-US
Week Ending
Fri, 19 Sep 2025
Open
106.4100
Close
105.6520
High
106.4100
Low
105.2810
Trend
0.66534
Sharemaestro [Charts]
BBMC weekly Smart Money chart, closing 2025-09-19.
BBMC weekly Market Snapshot chart, closing 2025-09-19.
BBMC weekly Market Cycle chart, closing 2025-09-19.
BBMC weekly Market Demand chart, closing 2025-09-19.
BBMC weekly Market Strength chart, closing 2025-09-19.
BBMC weekly Market Dynamics chart, closing 2025-09-19.
BBMC weekly Market Threshold chart, closing 2025-09-19.

Weekly Report

JPMorgan BetaBuilders U.S. Mid Cap Equity ETF (BBMC) Week Ending: Fri, 19 Sep 2025 ★★★★☆
Price
Weekly Close

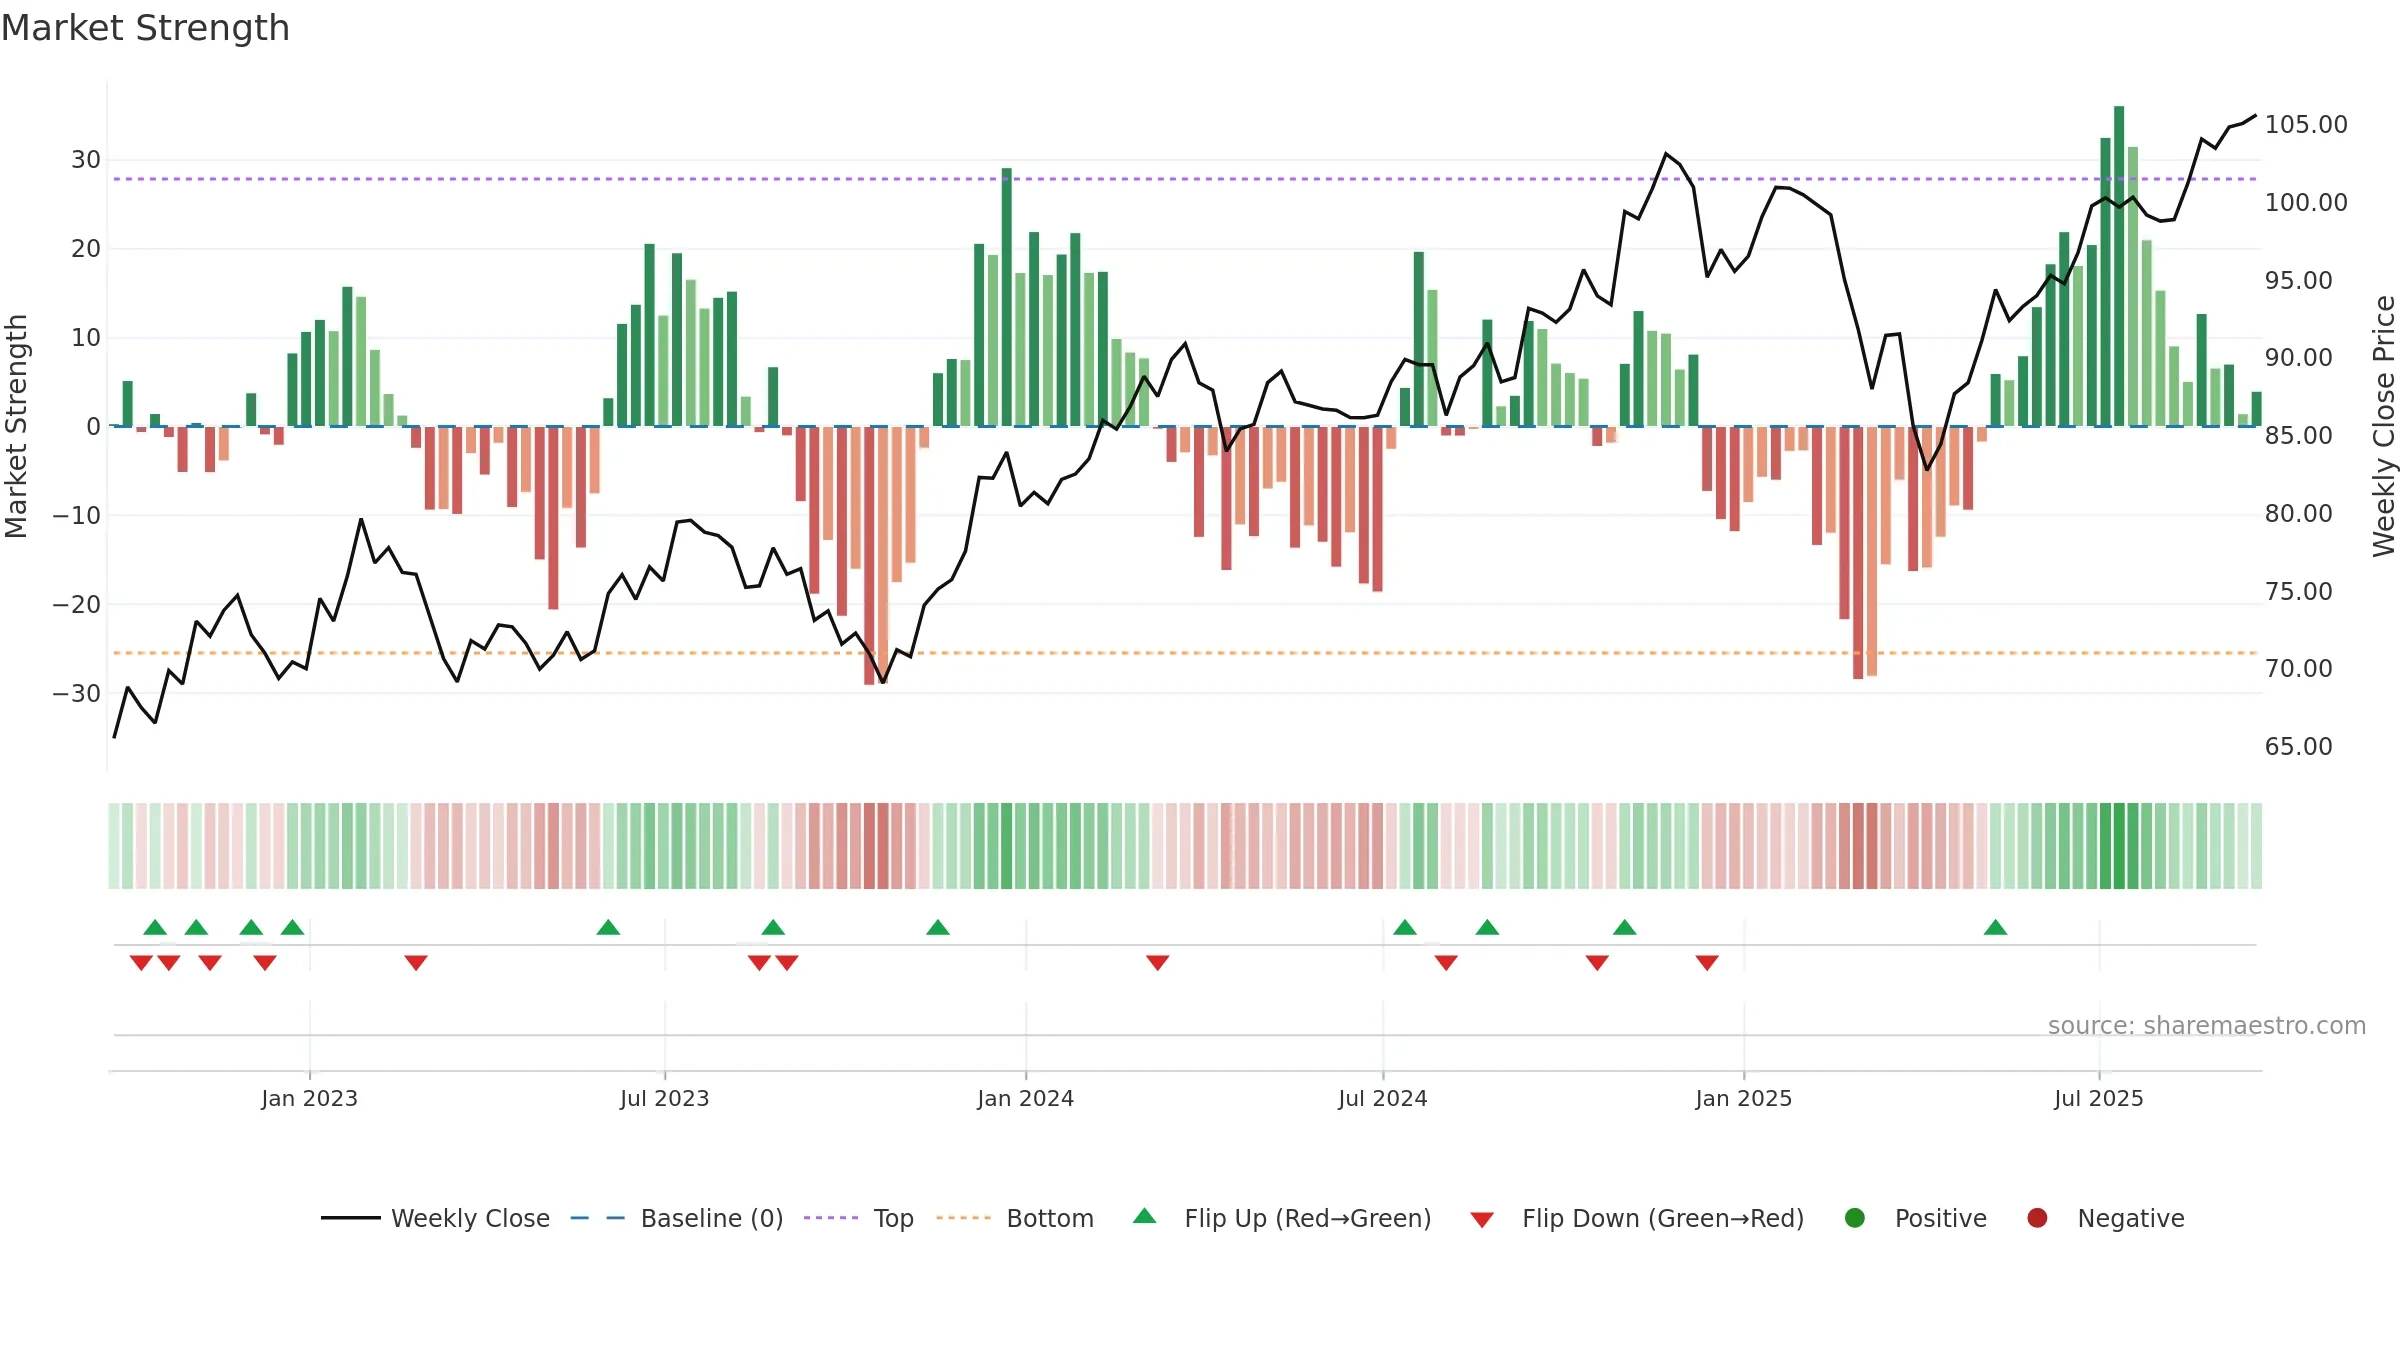
JPMorgan BetaBuilders U.S. Mid Cap Equity ETF closed at 105.6520 (-0.71% WoW) . Data window ends Fri, 19 Sep 2025.

Price Window6.93% over 8w
Return Volatility1.07%
Volume TrendRising
Vs 8-week High0.00%
Accumulation Weeks1
Distribution Weeks2
MA StackConstructive
4–8 CrossoverNone
Price vs MAsAbove
Baseline Deviation0.24% (widening)
Interpretation

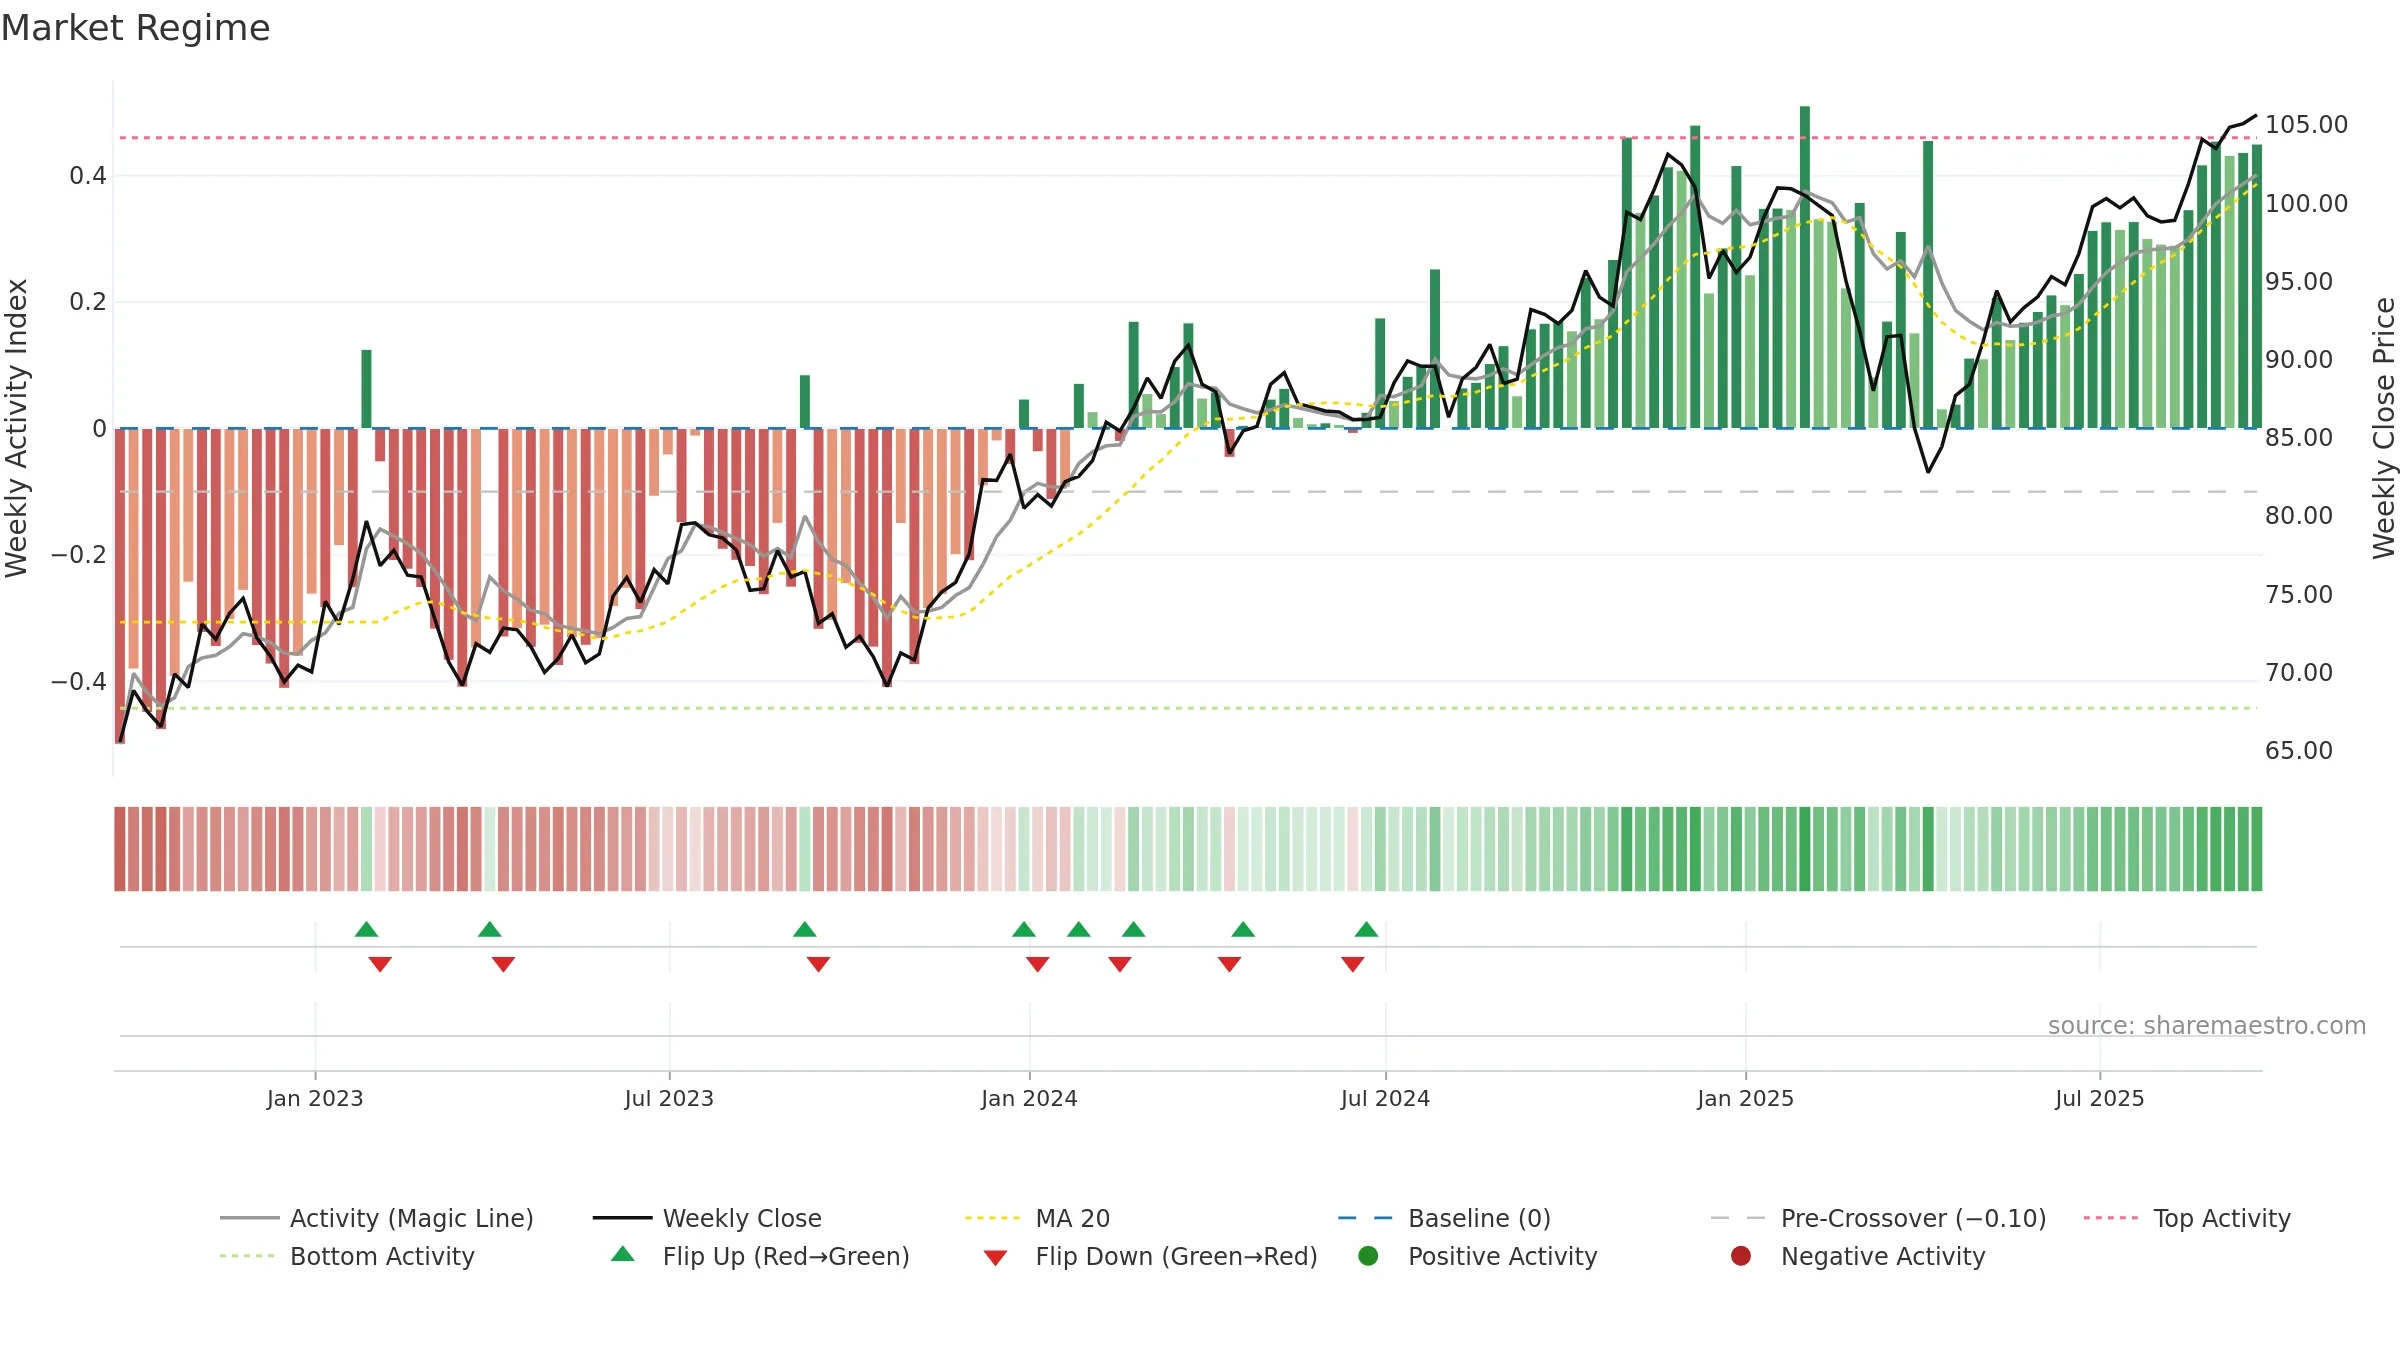
How to read this — Price slope is upward, indicating persistent buying over the window. Low weekly volatility favours steadier follow-through. Volume and price are moving in the same direction — a constructive confirmation. Accumulation weeks: 1; distribution weeks: 2. Price-level slope and return-drift differ — moves have been uneven week to week. Constructive MA stack supports the up-drift; pullbacks may find support at the 8–13 week region. Price holds above key averages, indicating constructive participation.

What this means for you

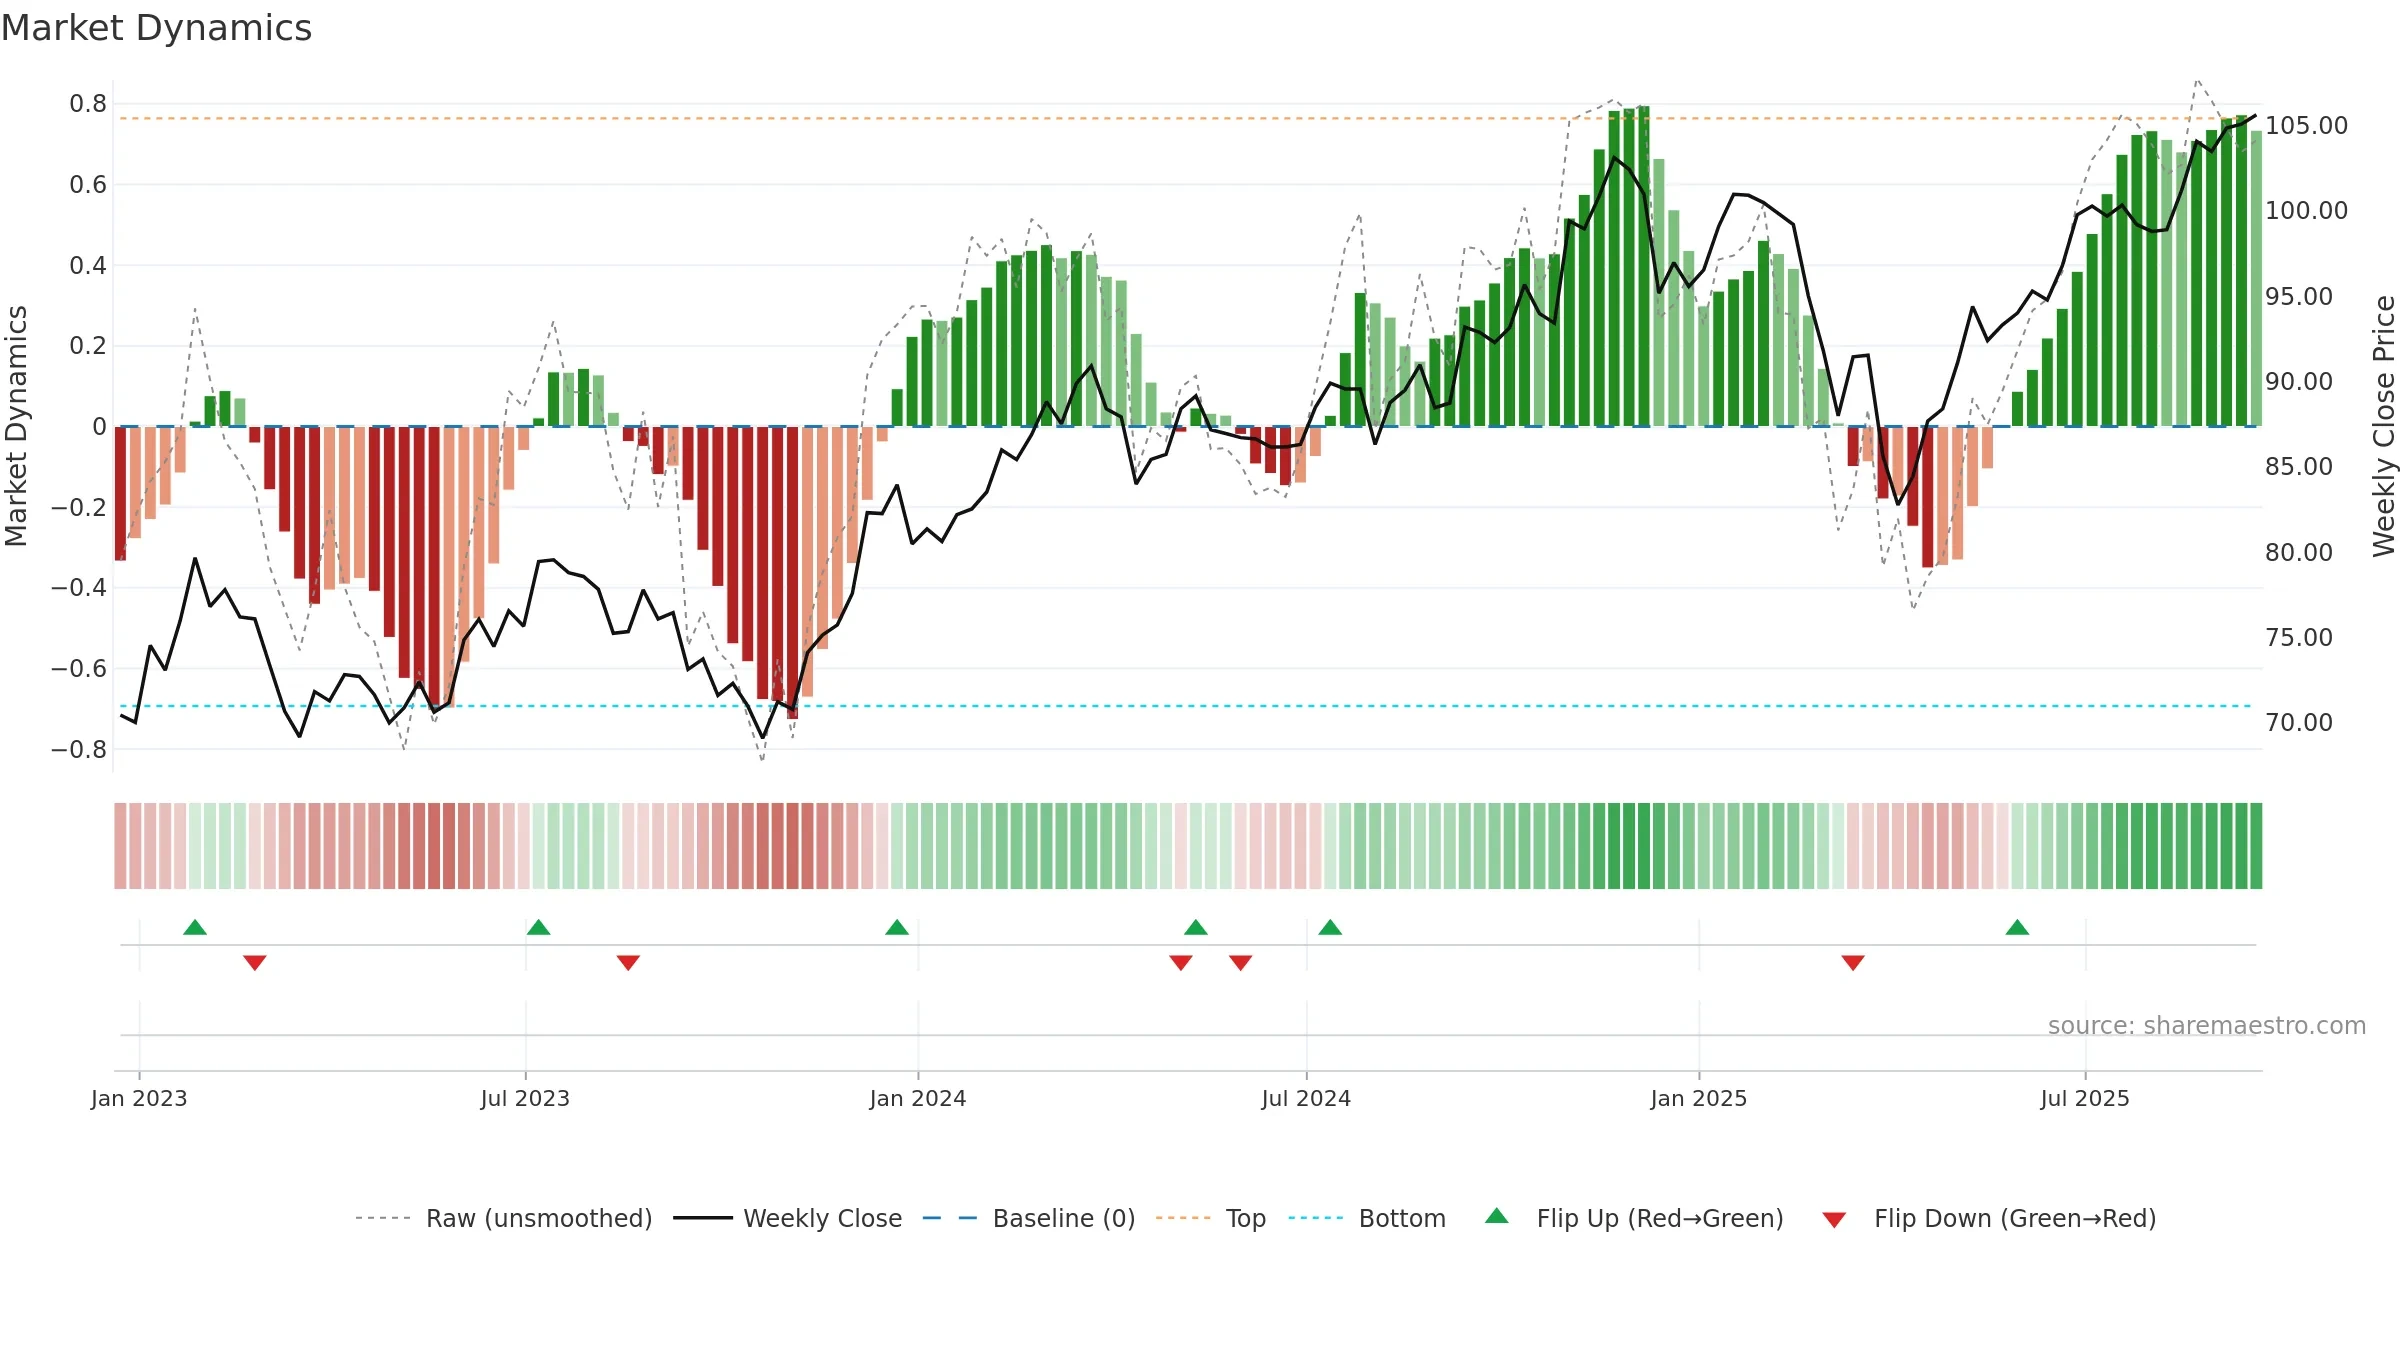
Up-slope supports buying interest; pullbacks may be contained if activity stays firm.

Trend
Sharemaestro Trend Line

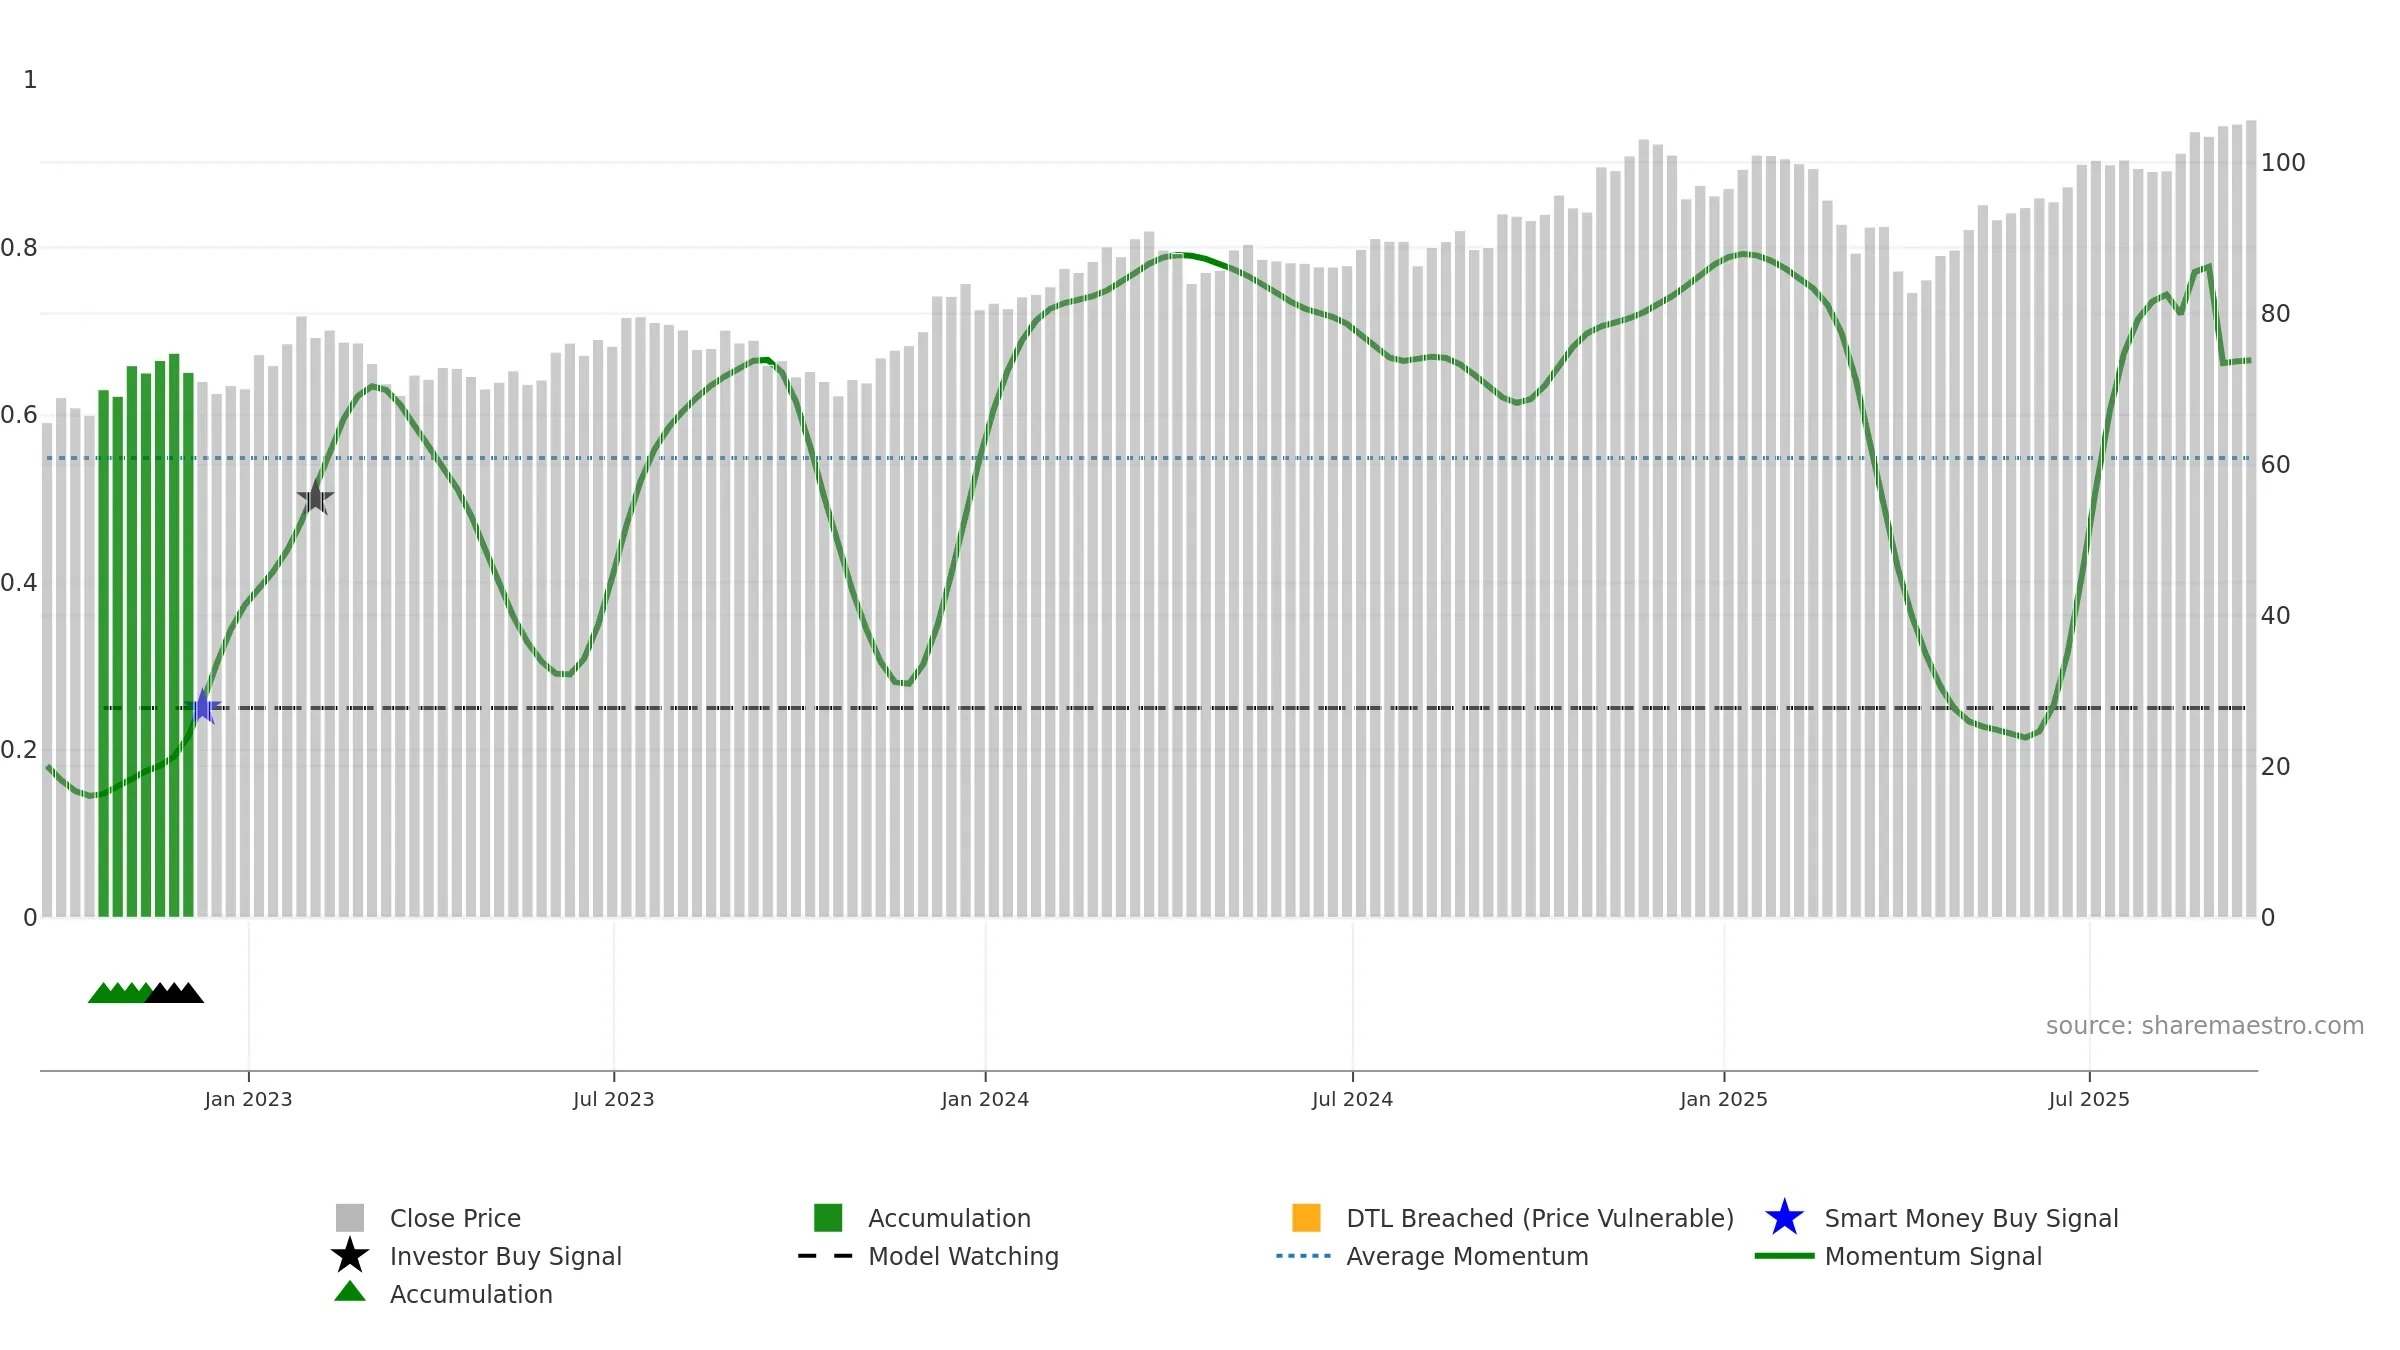
Gauge maps the trend signal to a 0–100 scale.

Gauge Reading66.5/100
DirectionFalling
Accelerationdecelerating
Gauge VolatilityNormal
Zone LabelNeutral
Bullish Weeks8
Neutral Weeks0
Bearish Weeks0
Interpretation

How to read this — Neutral levels indicate a balance between buyers and sellers. A falling gauge warns of momentum fatigue. Deceleration reduces the odds of persistence.

What this means for you

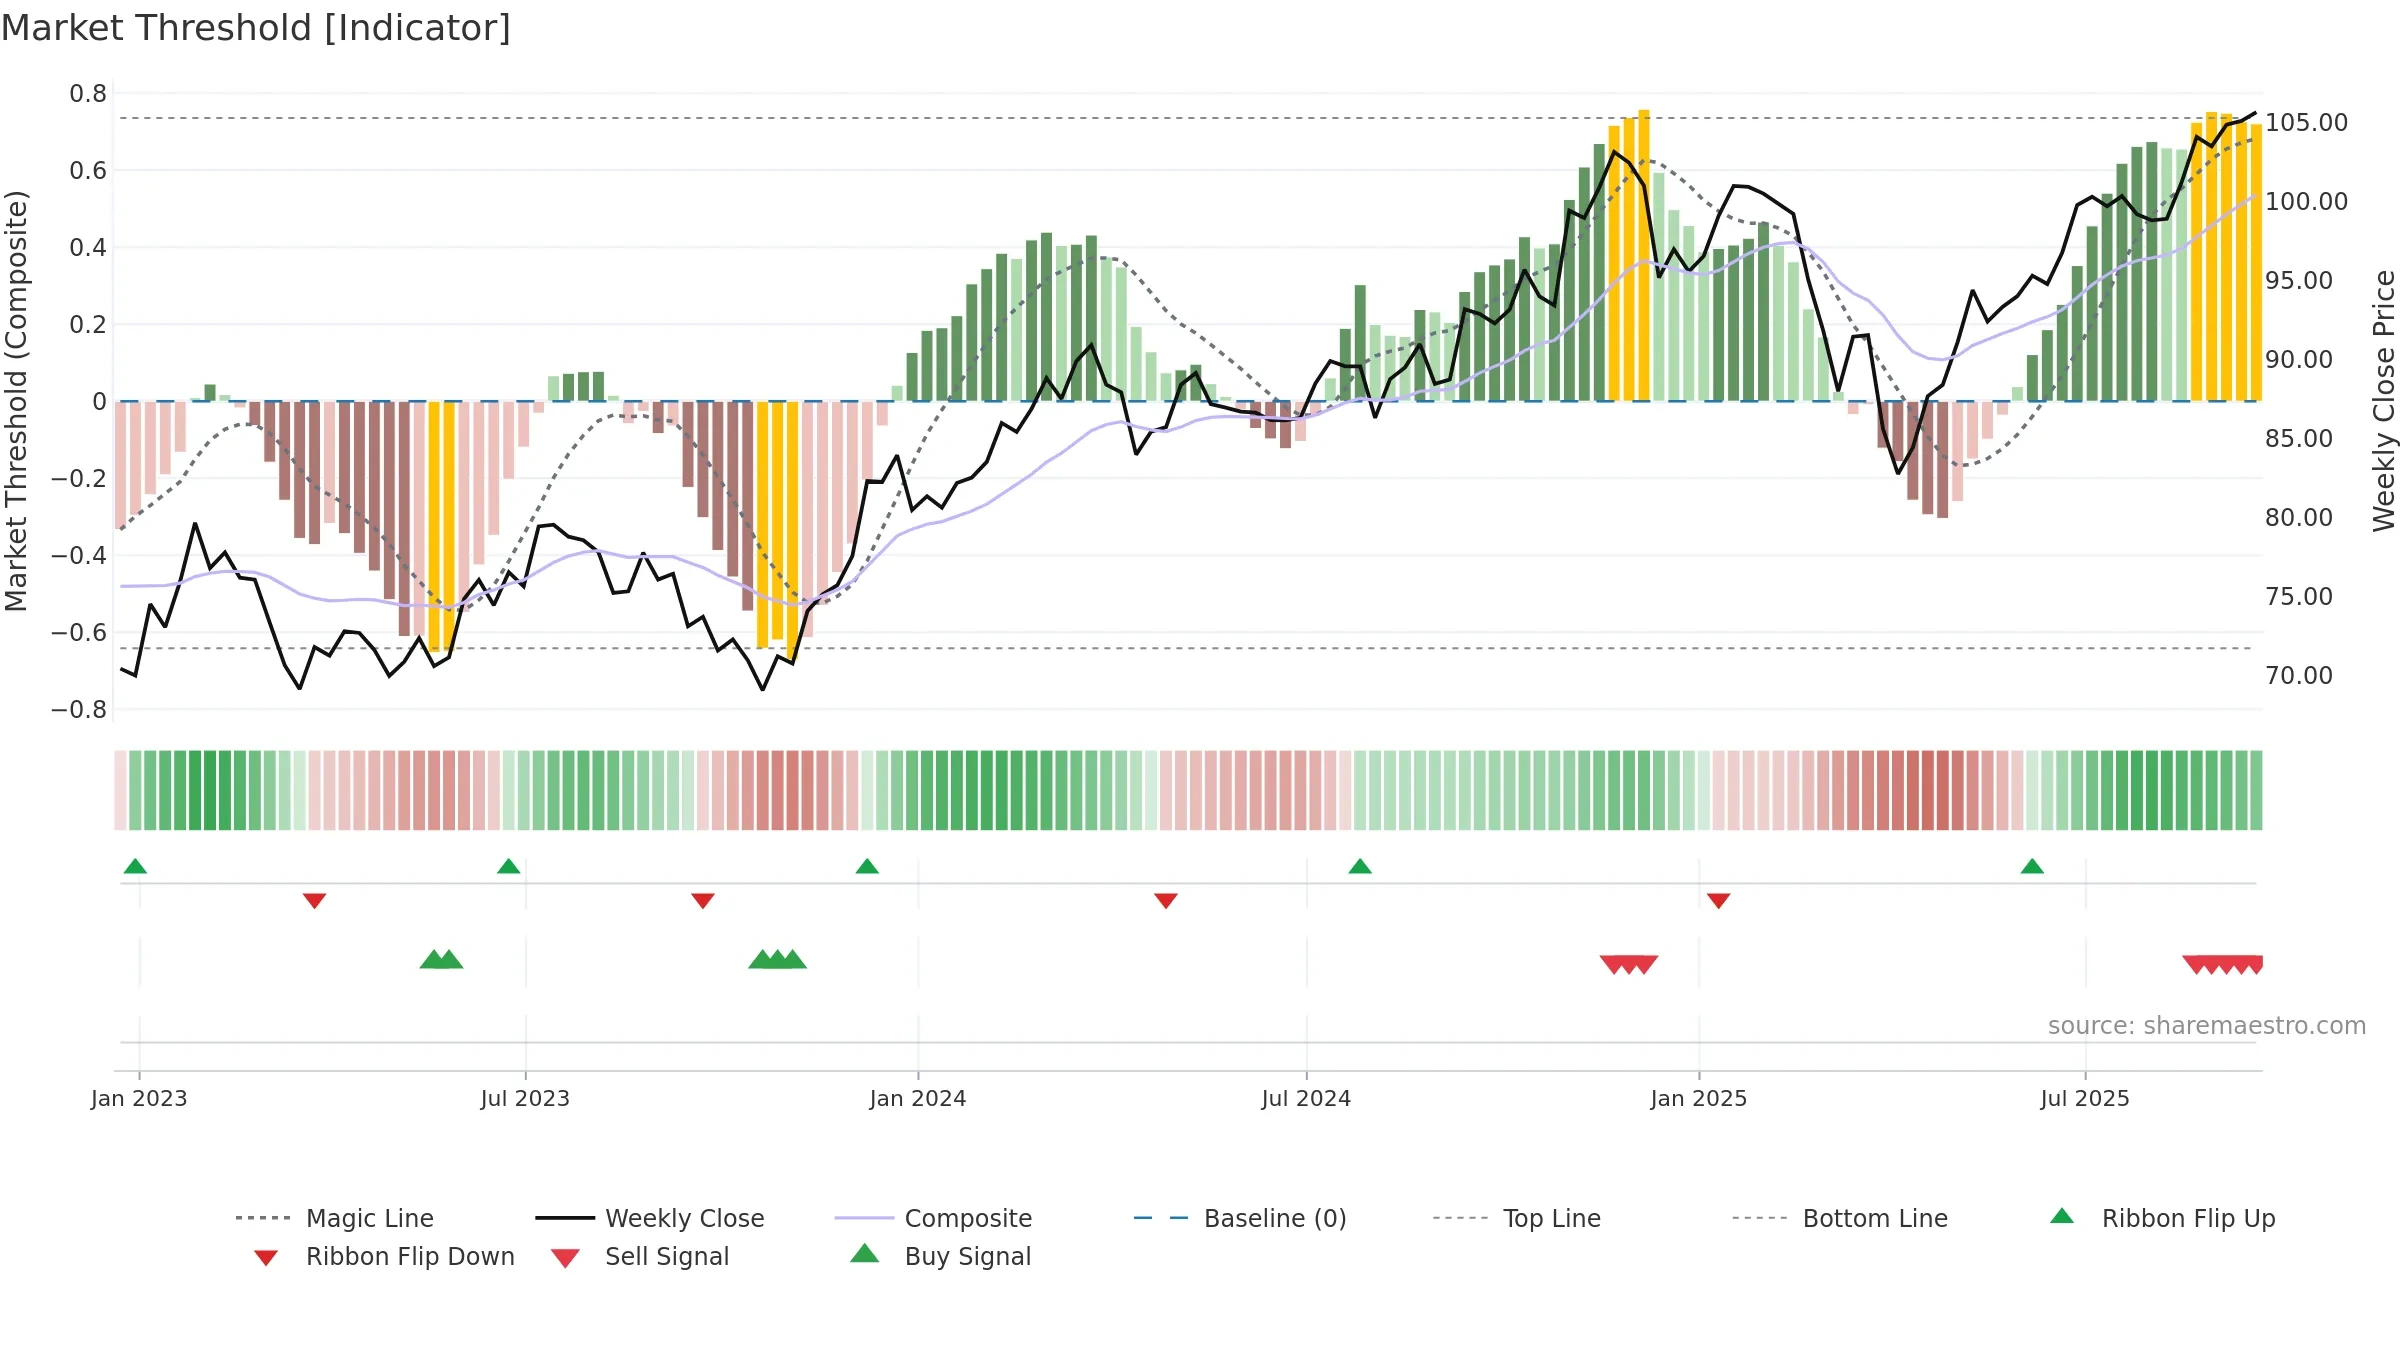
Mixed backdrop; confirmation from price action is helpful.

Conclusion

Positive ★★★★☆

Positive setup. ★★★★☆ confidence. Price window: 6. Trend: Neutral @ 66. In combination, liquidity confirms the move.

Why: Price window 6.93% over 8w. Close is 0.00% above the window high. Return volatility 1.07%. Volume trend rising. Liquidity convergence with price. Accumulation 1; distribution 2. MA stack constructive. Baseline deviation 0.24% (widening). Momentum neutral and falling. Acceleration decelerating. Gauge volatility normal.

Price Window Endpoint return over the last N weeks using weekly closes: (Closelast − Closefirst)/Closefirst × 100.
Return Volatility Std-dev of weekly returns (%). Higher = choppier.
Volume Trend Slope of weekly volume across the window (rising / falling / flat).
Vs N-week High % distance of latest close from the highest close in the window.
Accumulation Weeks Weeks price rose on higher volume than the prior week.
Distribution Weeks Weeks price fell on higher volume than the prior week.
MA Stack Relative order of short / intermediate / long MAs. Short > long is constructive.
4–8 Crossover Latest cross of 4-week vs 8-week MA (bullish / bearish / none).
Price vs MAs Whether the close is above/below key averages (8w & 26w).
Baseline Deviation % distance from the market-cycle baseline (fair-value track).
Gauge Reading Smoothed trend signal mapped to 0–100.
Direction Slope sign of the gauge across the window (rising / falling).
Acceleration Change in the slope of the gauge (accelerating / decelerating).
Gauge Volatility Variability of the gauge (low / normal / high).
Zone Label Classification by level (Bullish / Neutral / Bearish).
Target Price (Flag) If flagged: Positive/Negative stance. Otherwise: numeric fair value.
Composite Score Overall model score (0–10).
Hybrid Efficiency Efficiency of growth × quality (0–10).
Rating Model’s verdict for the snapshot.
Weekly Close Sparkline of the last 52 weekly closing prices.
Trend Line Sparkline of the smoothed trend signal over the last 52 weeks.

Tip: Most metrics also include a hover tooltip where they appear in the report.

Download JSON Download CSV JSON-LD Snapshots: 2025-09-19