No results found.

Simplify Managed Futures Strategy ETF

CTA ETF-US
Week Ending
Mon, 15 Sep 2025
Open
27.4700
Close
27.6600
High
27.8100
Low
27.3900
Trend
0.31122
Sharemaestro [Charts]
CTA weekly Smart Money chart, closing 2025-09-15.
CTA weekly Market Snapshot chart, closing 2025-09-15.
CTA weekly Market Cycle chart, closing 2025-09-15.
CTA weekly Market Demand chart, closing 2025-09-15.
CTA weekly Market Strength chart, closing 2025-09-15.
CTA weekly Market Dynamics chart, closing 2025-09-15.
CTA weekly Market Threshold chart, closing 2025-09-15.

Weekly Report

Simplify Managed Futures Strategy ETF (CTA) Week Ending: Mon, 15 Sep 2025 ★★★☆☆
Price
Weekly Close

Simplify Managed Futures Strategy ETF closed at 27.6600 (0.69% WoW) . Data window ends Mon, 15 Sep 2025.

Price Window4.30% over 8w
Return Volatility2.42%
Volume TrendRising
Vs 8w High-0.90%
Price vs MAsAbove
What stands out

How to read this — Price slope is upward, indicating persistent buying over the window. Volume and price are moving in the same direction — a constructive confirmation. Price holds above key averages, indicating constructive participation.

What to watch

Up-slope supports buying interest; pullbacks may be contained if activity stays firm.

Trend
Sharemaestro Trend Line

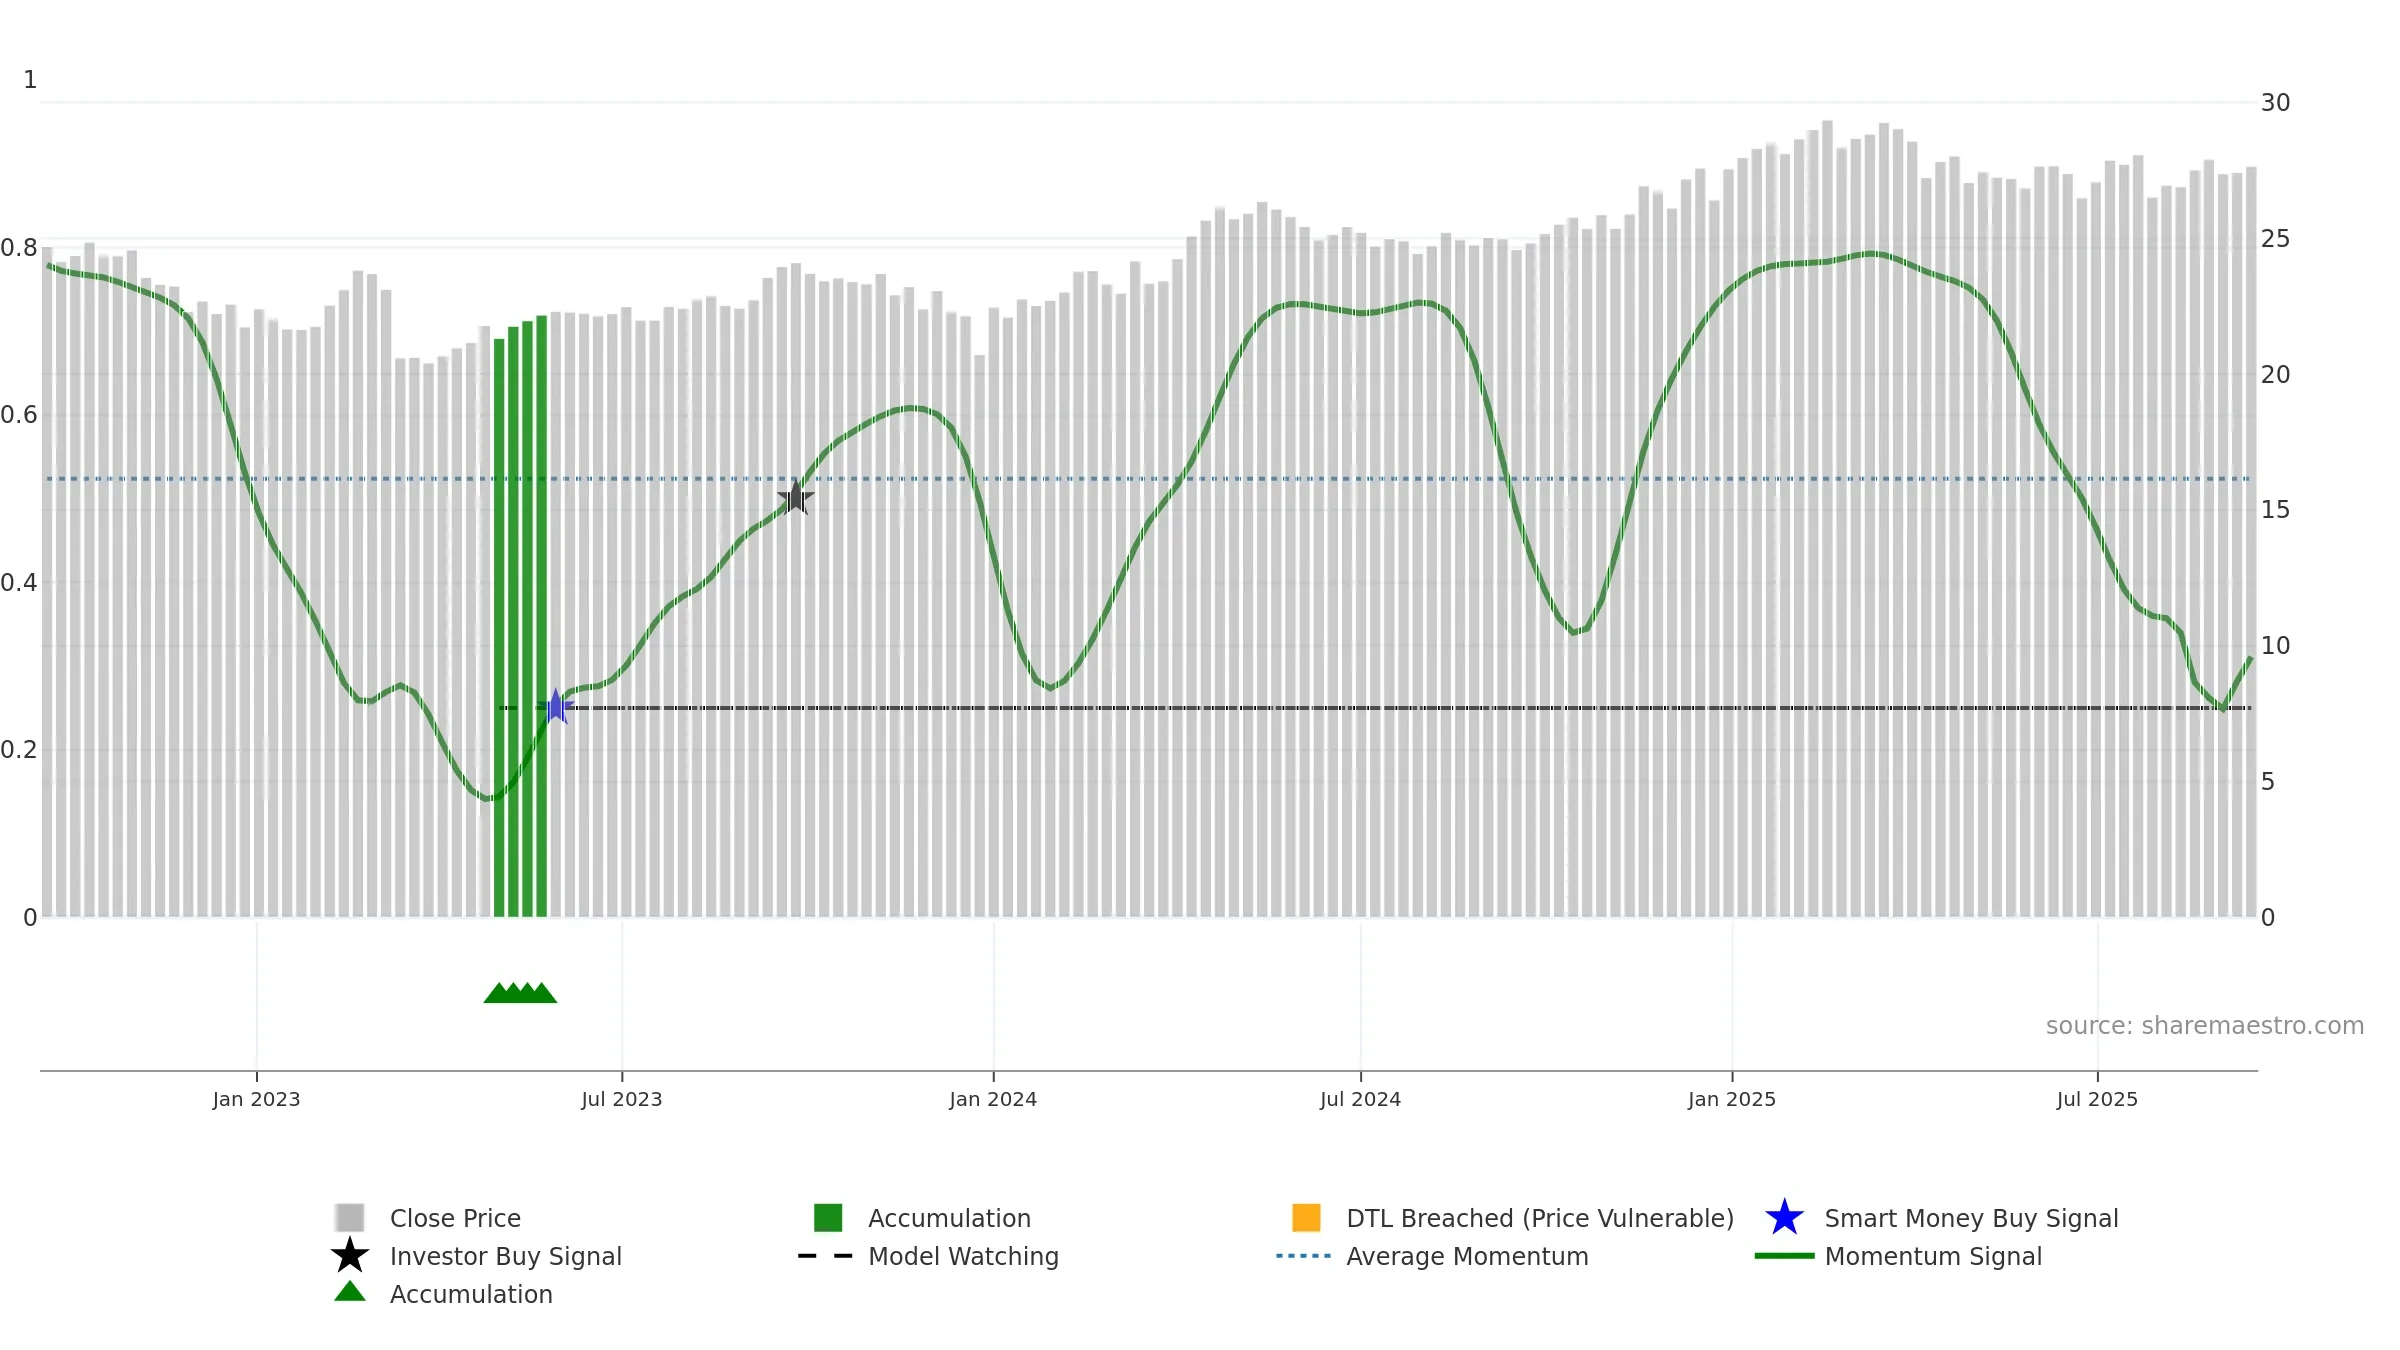
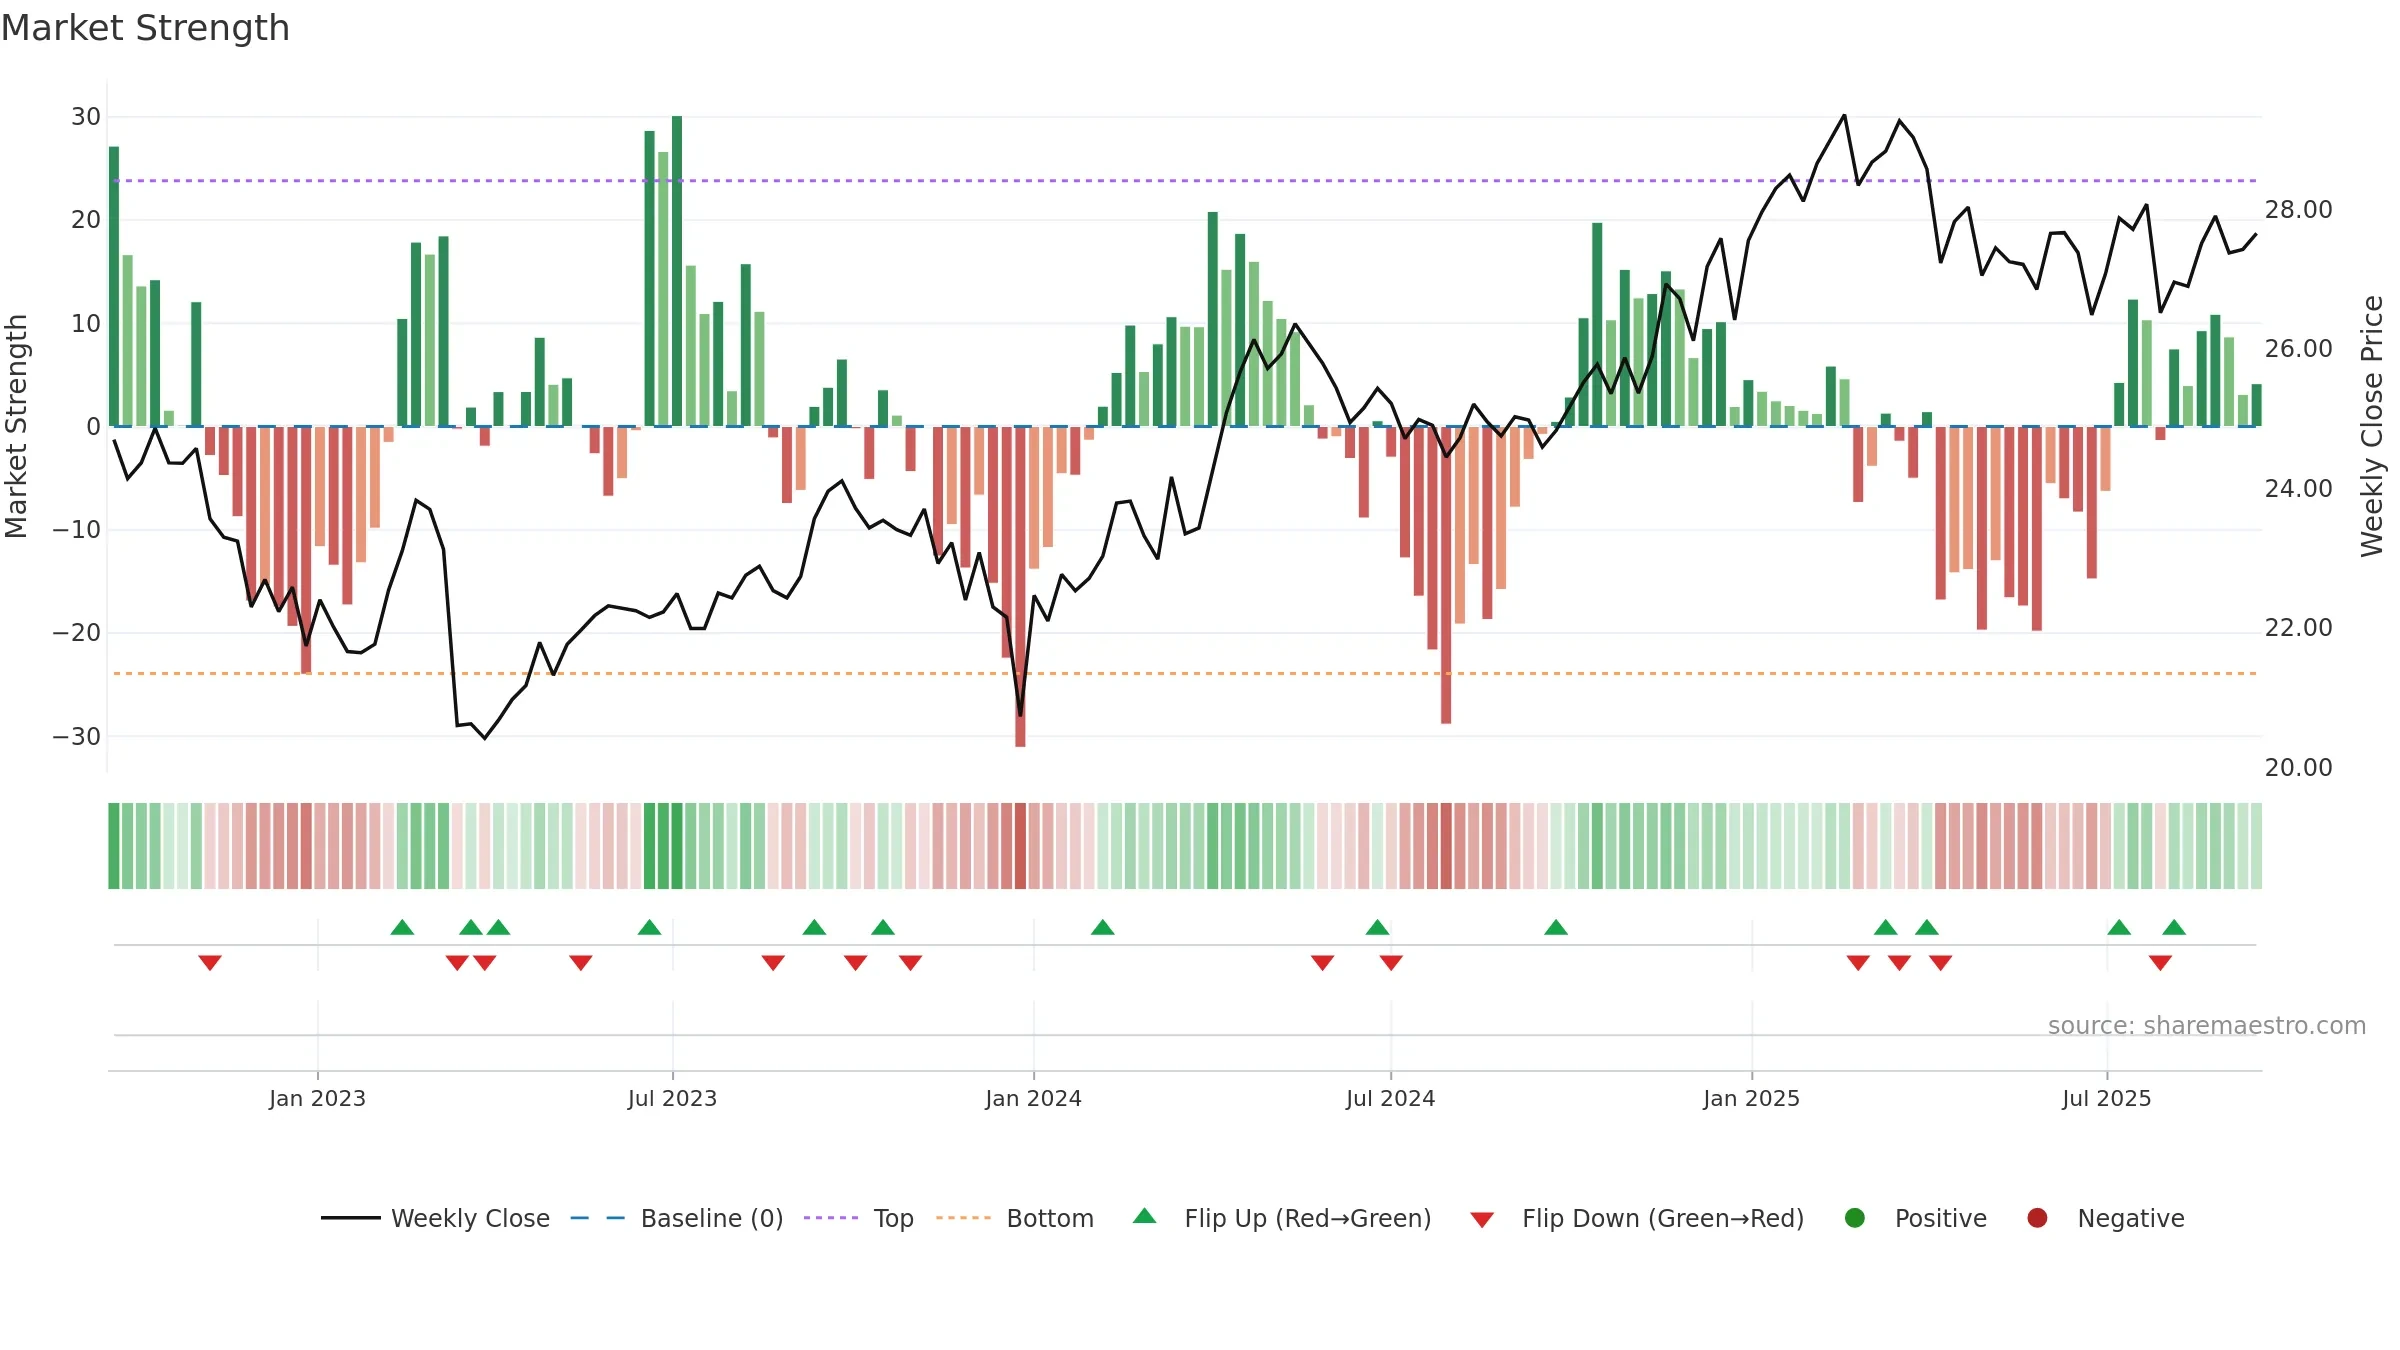
Gauge maps the trend signal to a 0–100 scale.

Gauge Reading31.1/100
DirectionFalling
Accelerationaccelerating
Trend StateBottoming Attempt
What stands out

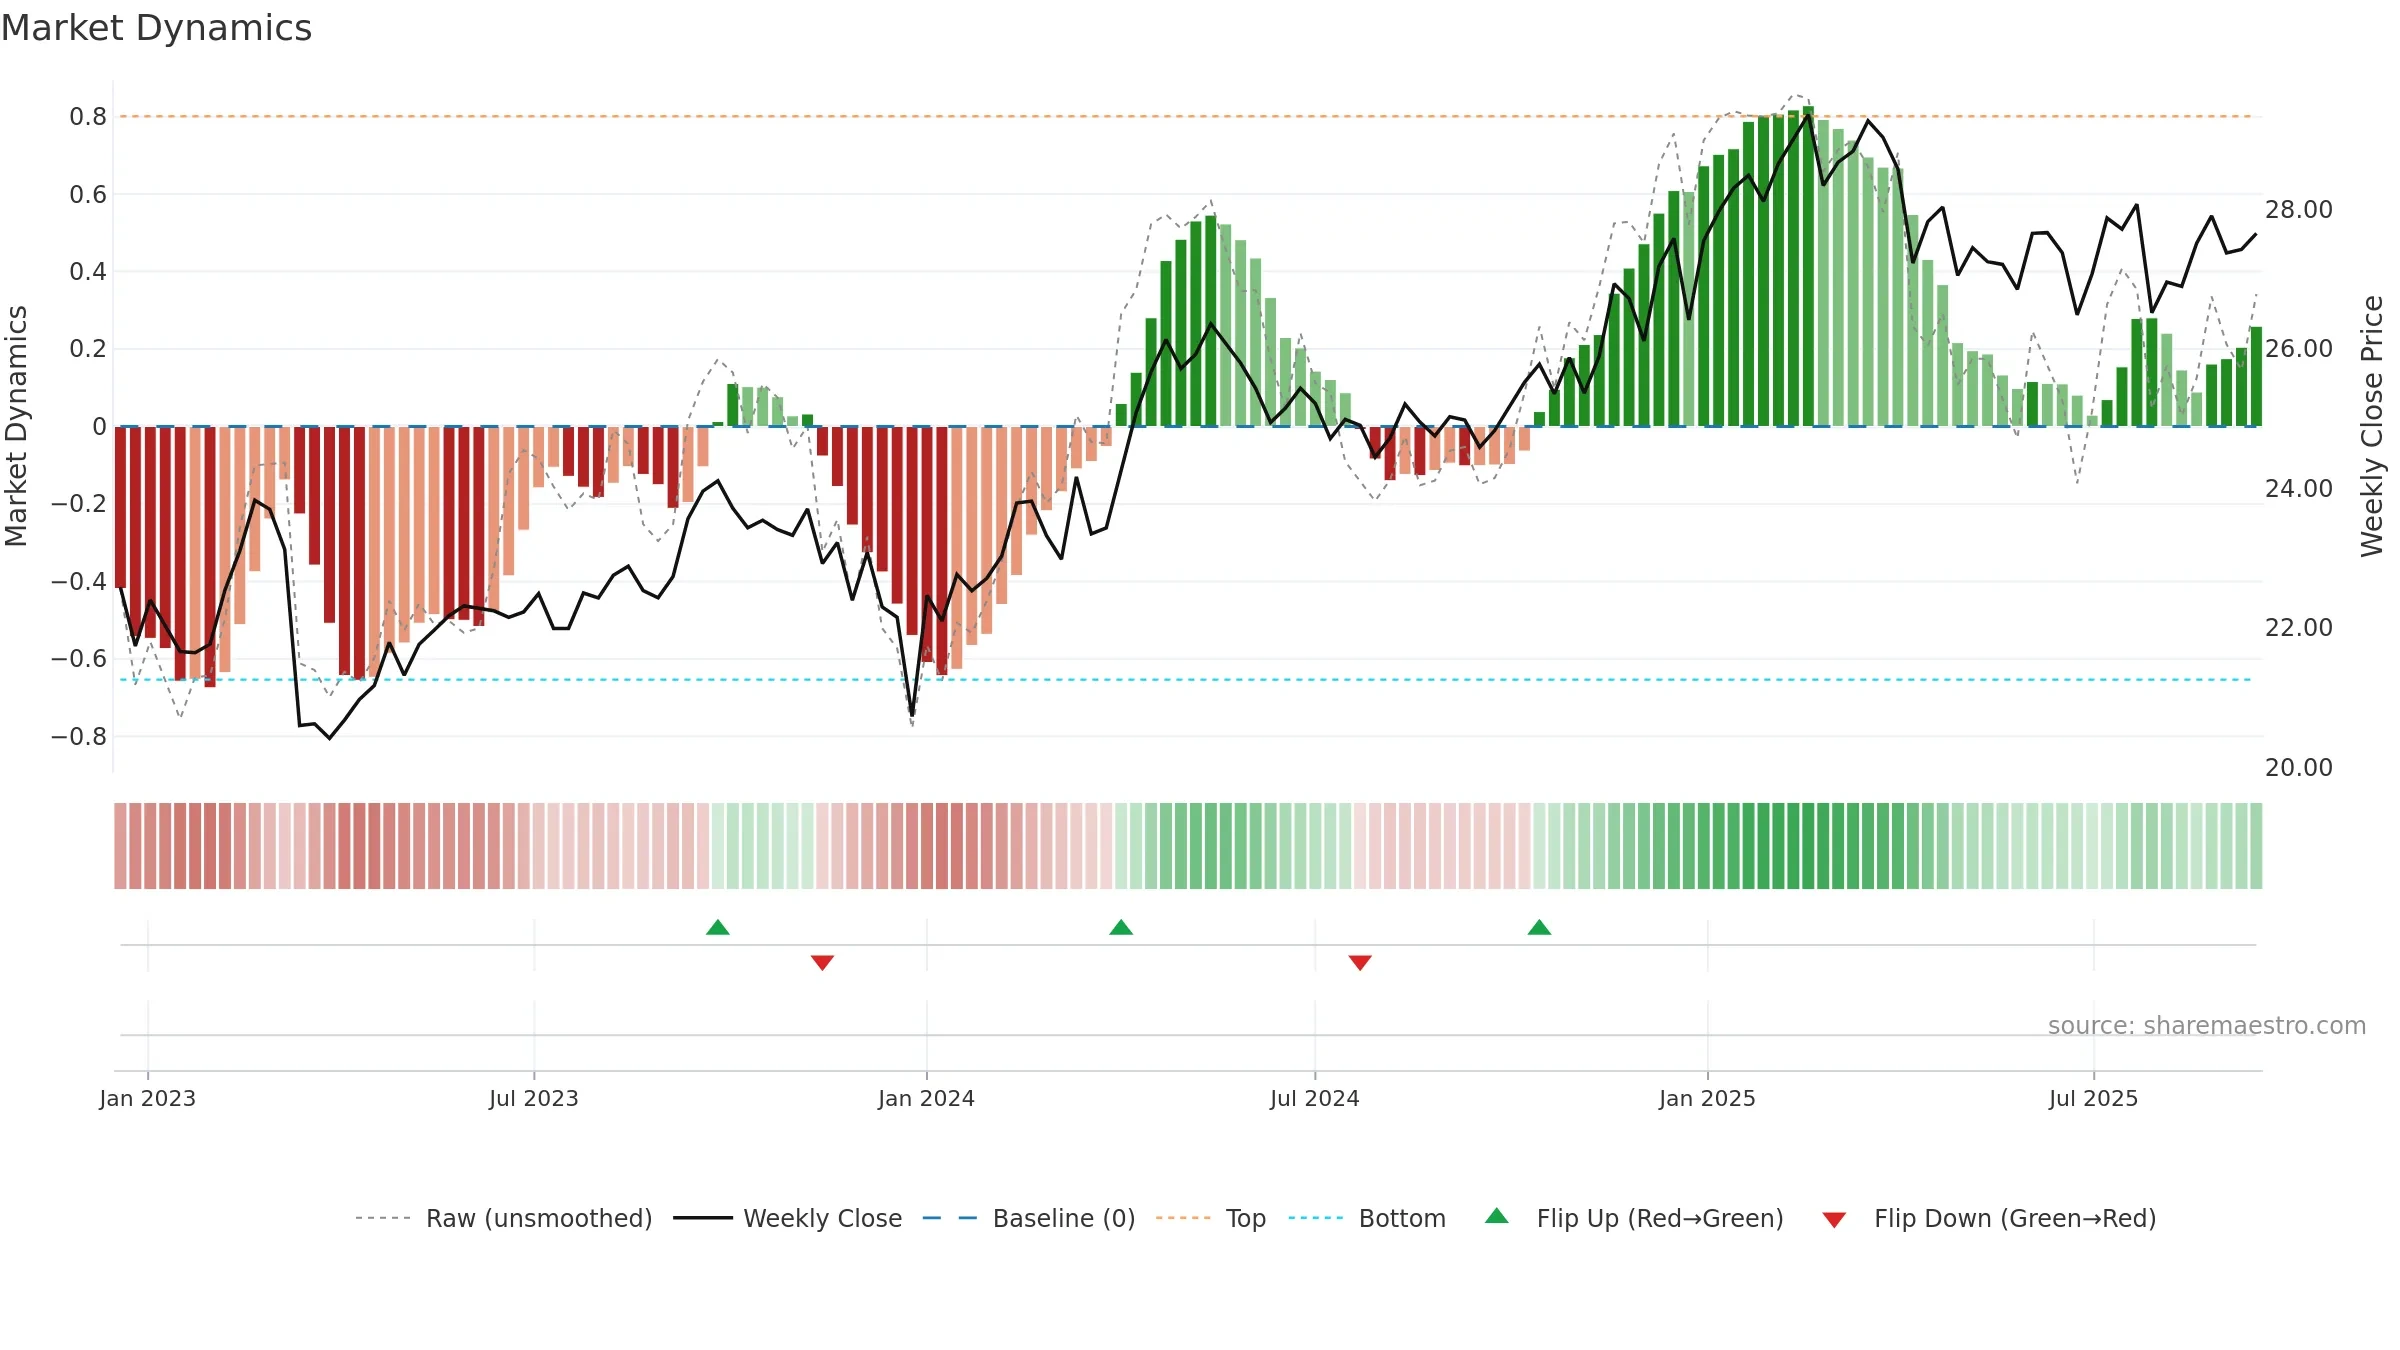
How to read this — Bearish backdrop but short-term momentum is improving; confirmation still needed.

What to watch

Early improvement — look for a reclaim of 0.50→0.60 to validate.

Conclusion

Neutral ★★★☆☆

Neutral setup. ★★★☆☆ confidence. Price window: 4. Trend: Bottoming Attempt; gauge 31. In combination, liquidity confirms the move.

Strengths
  • Early improvement from bearish zone (bottoming attempt)
  • Price holds above 8w & 26w averages
  • Liquidity confirms the price trend
Watch-outs
  • Momentum is weak/falling

Why: Price window 4.30% over 8w. Close is -0.90% below the prior-window high. Return volatility 2.42%. Volume trend rising. Liquidity convergence with price. Trend state bottoming attempt. Momentum bearish and falling .

Price Window Endpoint return over the last N weeks using weekly closes: (Closelast − Closefirst)/Closefirst × 100.
Return Volatility Std-dev of weekly returns (%). Higher = choppier.
Volume Trend Slope of weekly volume across the window (rising / falling / flat).
Vs N-week High % distance of latest close from the highest close in the window.
Accumulation Weeks Weeks price rose on higher volume than the prior week.
Distribution Weeks Weeks price fell on higher volume than the prior week.
MA Stack Relative order of short / intermediate / long MAs. Short > long is constructive.
4–8 Crossover Latest cross of 4-week vs 8-week MA (bullish / bearish / none).
Price vs MAs Whether the close is above/below key averages (8w & 26w).
Baseline Deviation % distance from the market-cycle baseline (fair-value track).
Gauge Reading Smoothed trend signal mapped to 0–100.
Direction Slope sign of the gauge across the window (rising / falling).
Acceleration Change in the slope of the gauge (accelerating / decelerating).
Gauge Volatility Variability of the gauge (low / normal / high).
Zone Label Classification by level (Bullish / Neutral / Bearish).
Target Price (Flag) If flagged: Positive/Negative stance. Otherwise: numeric fair value.
Composite Score Overall model score (0–10).
Hybrid Efficiency Efficiency of growth × quality (0–10).
Rating Model’s verdict for the snapshot.
Weekly Close Sparkline of the last 52 weekly closing prices.
Trend Line Sparkline of the smoothed trend signal over the last 52 weeks.

Tip: Most metrics also include a hover tooltip where they appear in the report.

Download JSON Download CSV JSON-LD Snapshots: 2025-09-15