Virgin Galactic Holdings, Inc.
SPCE NYSE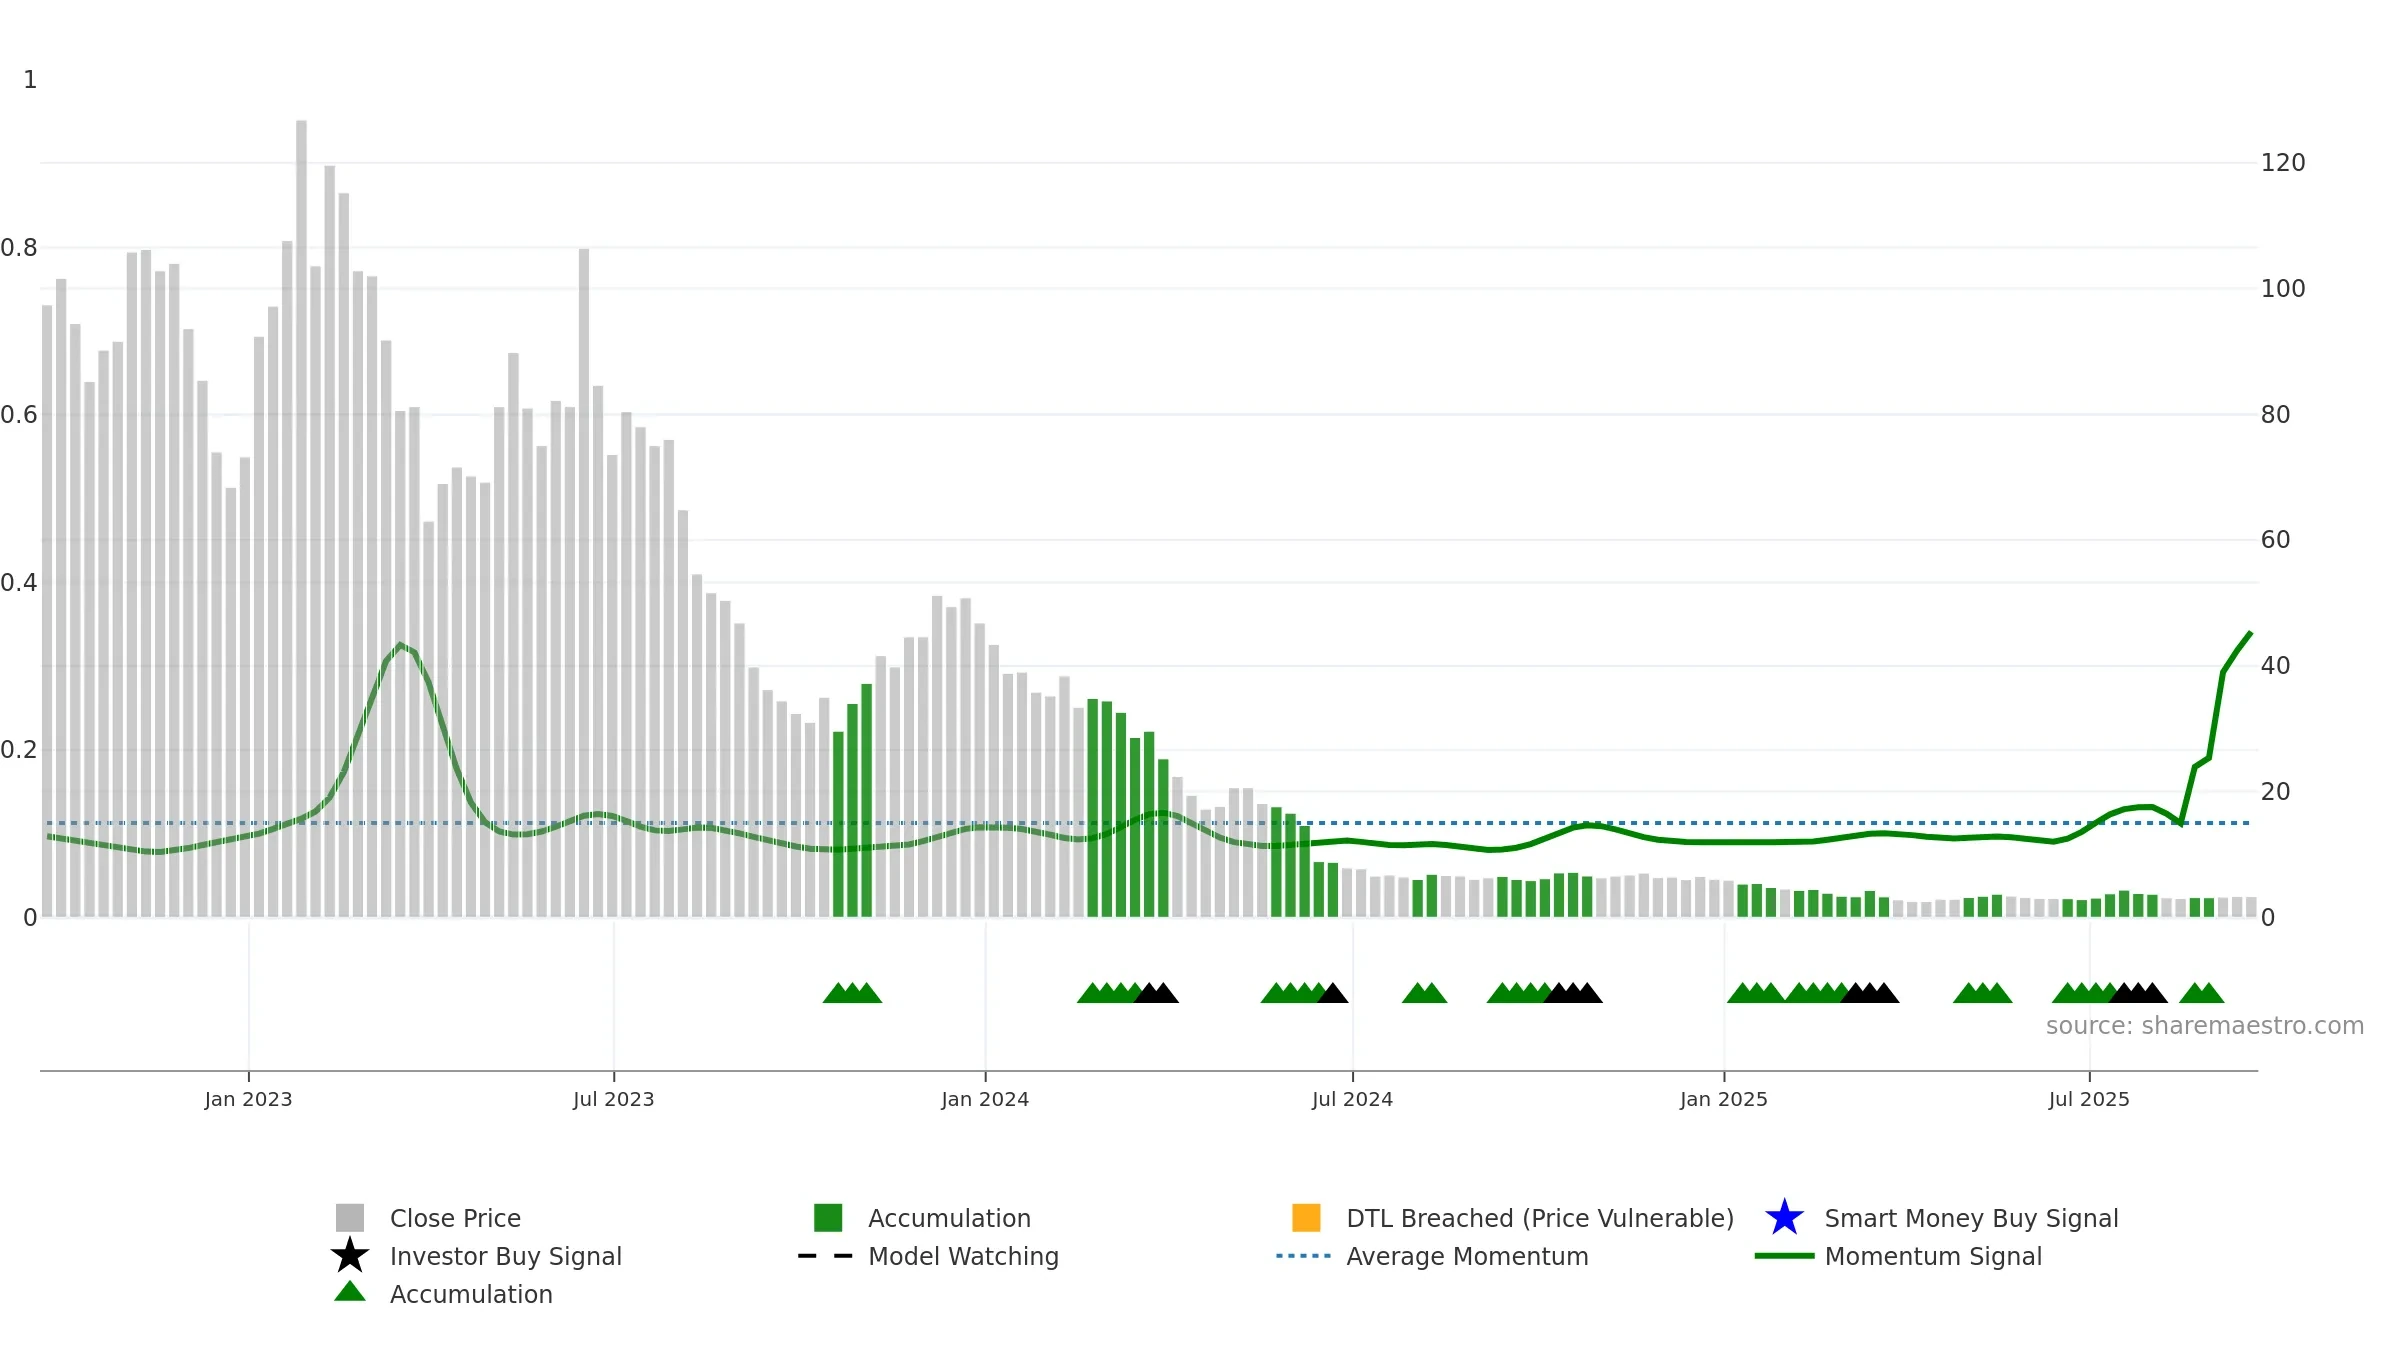
Weekly Report
Virgin Galactic Holdings, Inc. closed at 3.2900 (-0.60% WoW) . Data window ends Fri, 19 Sep 2025.
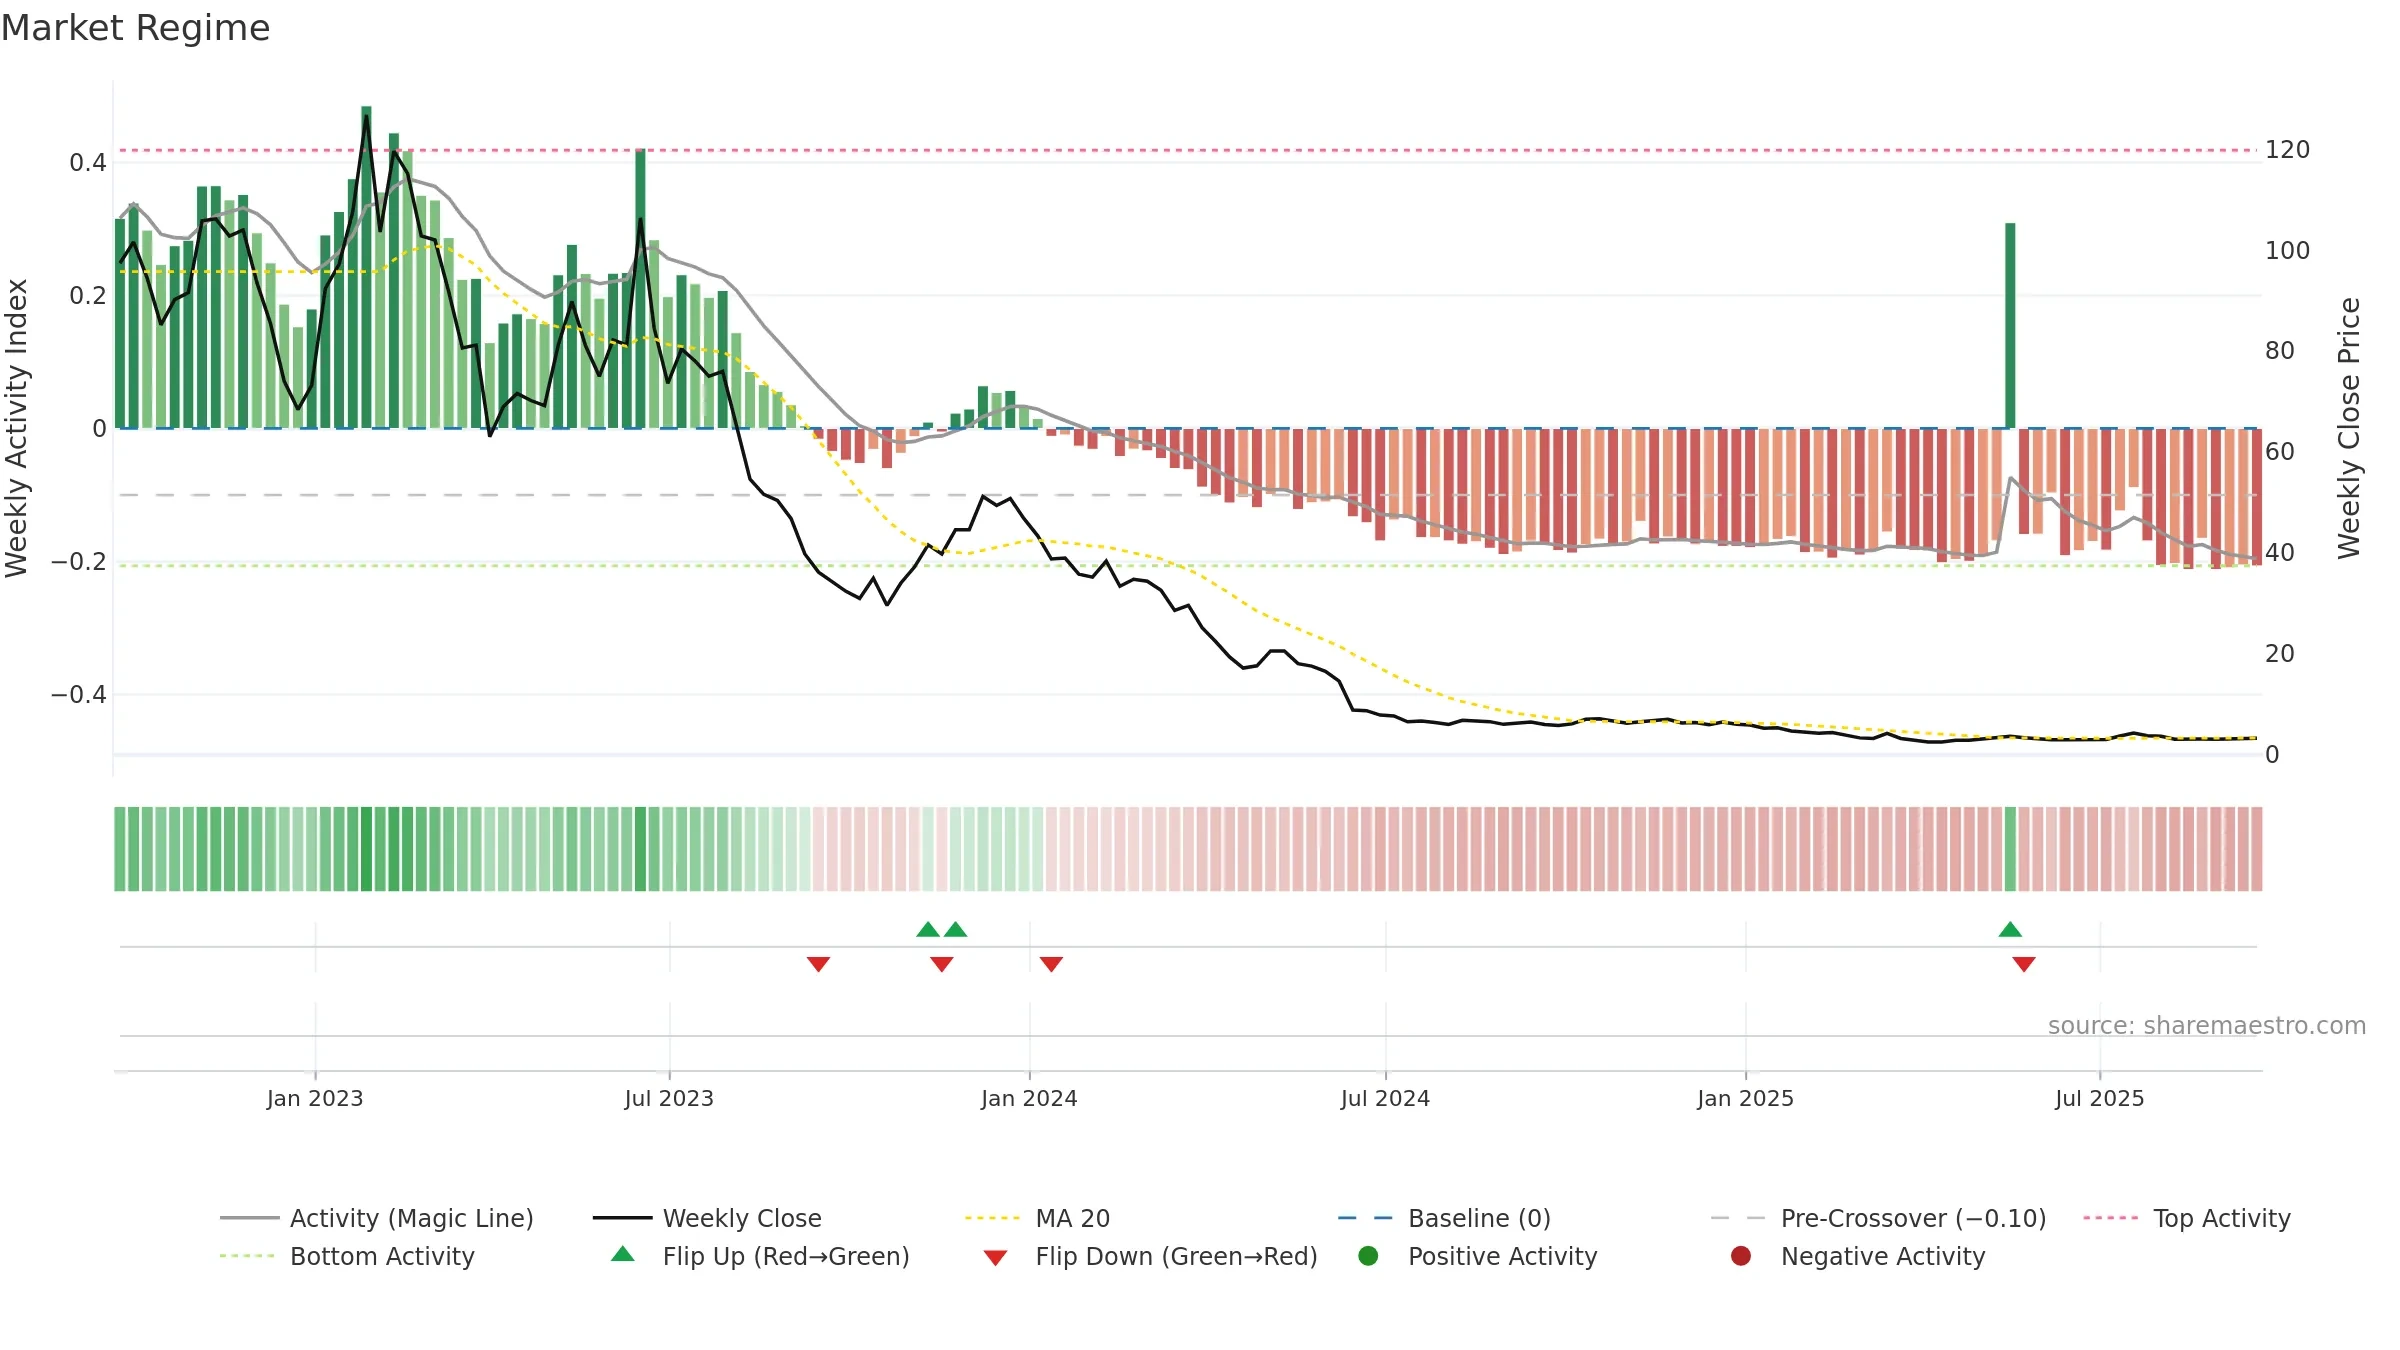
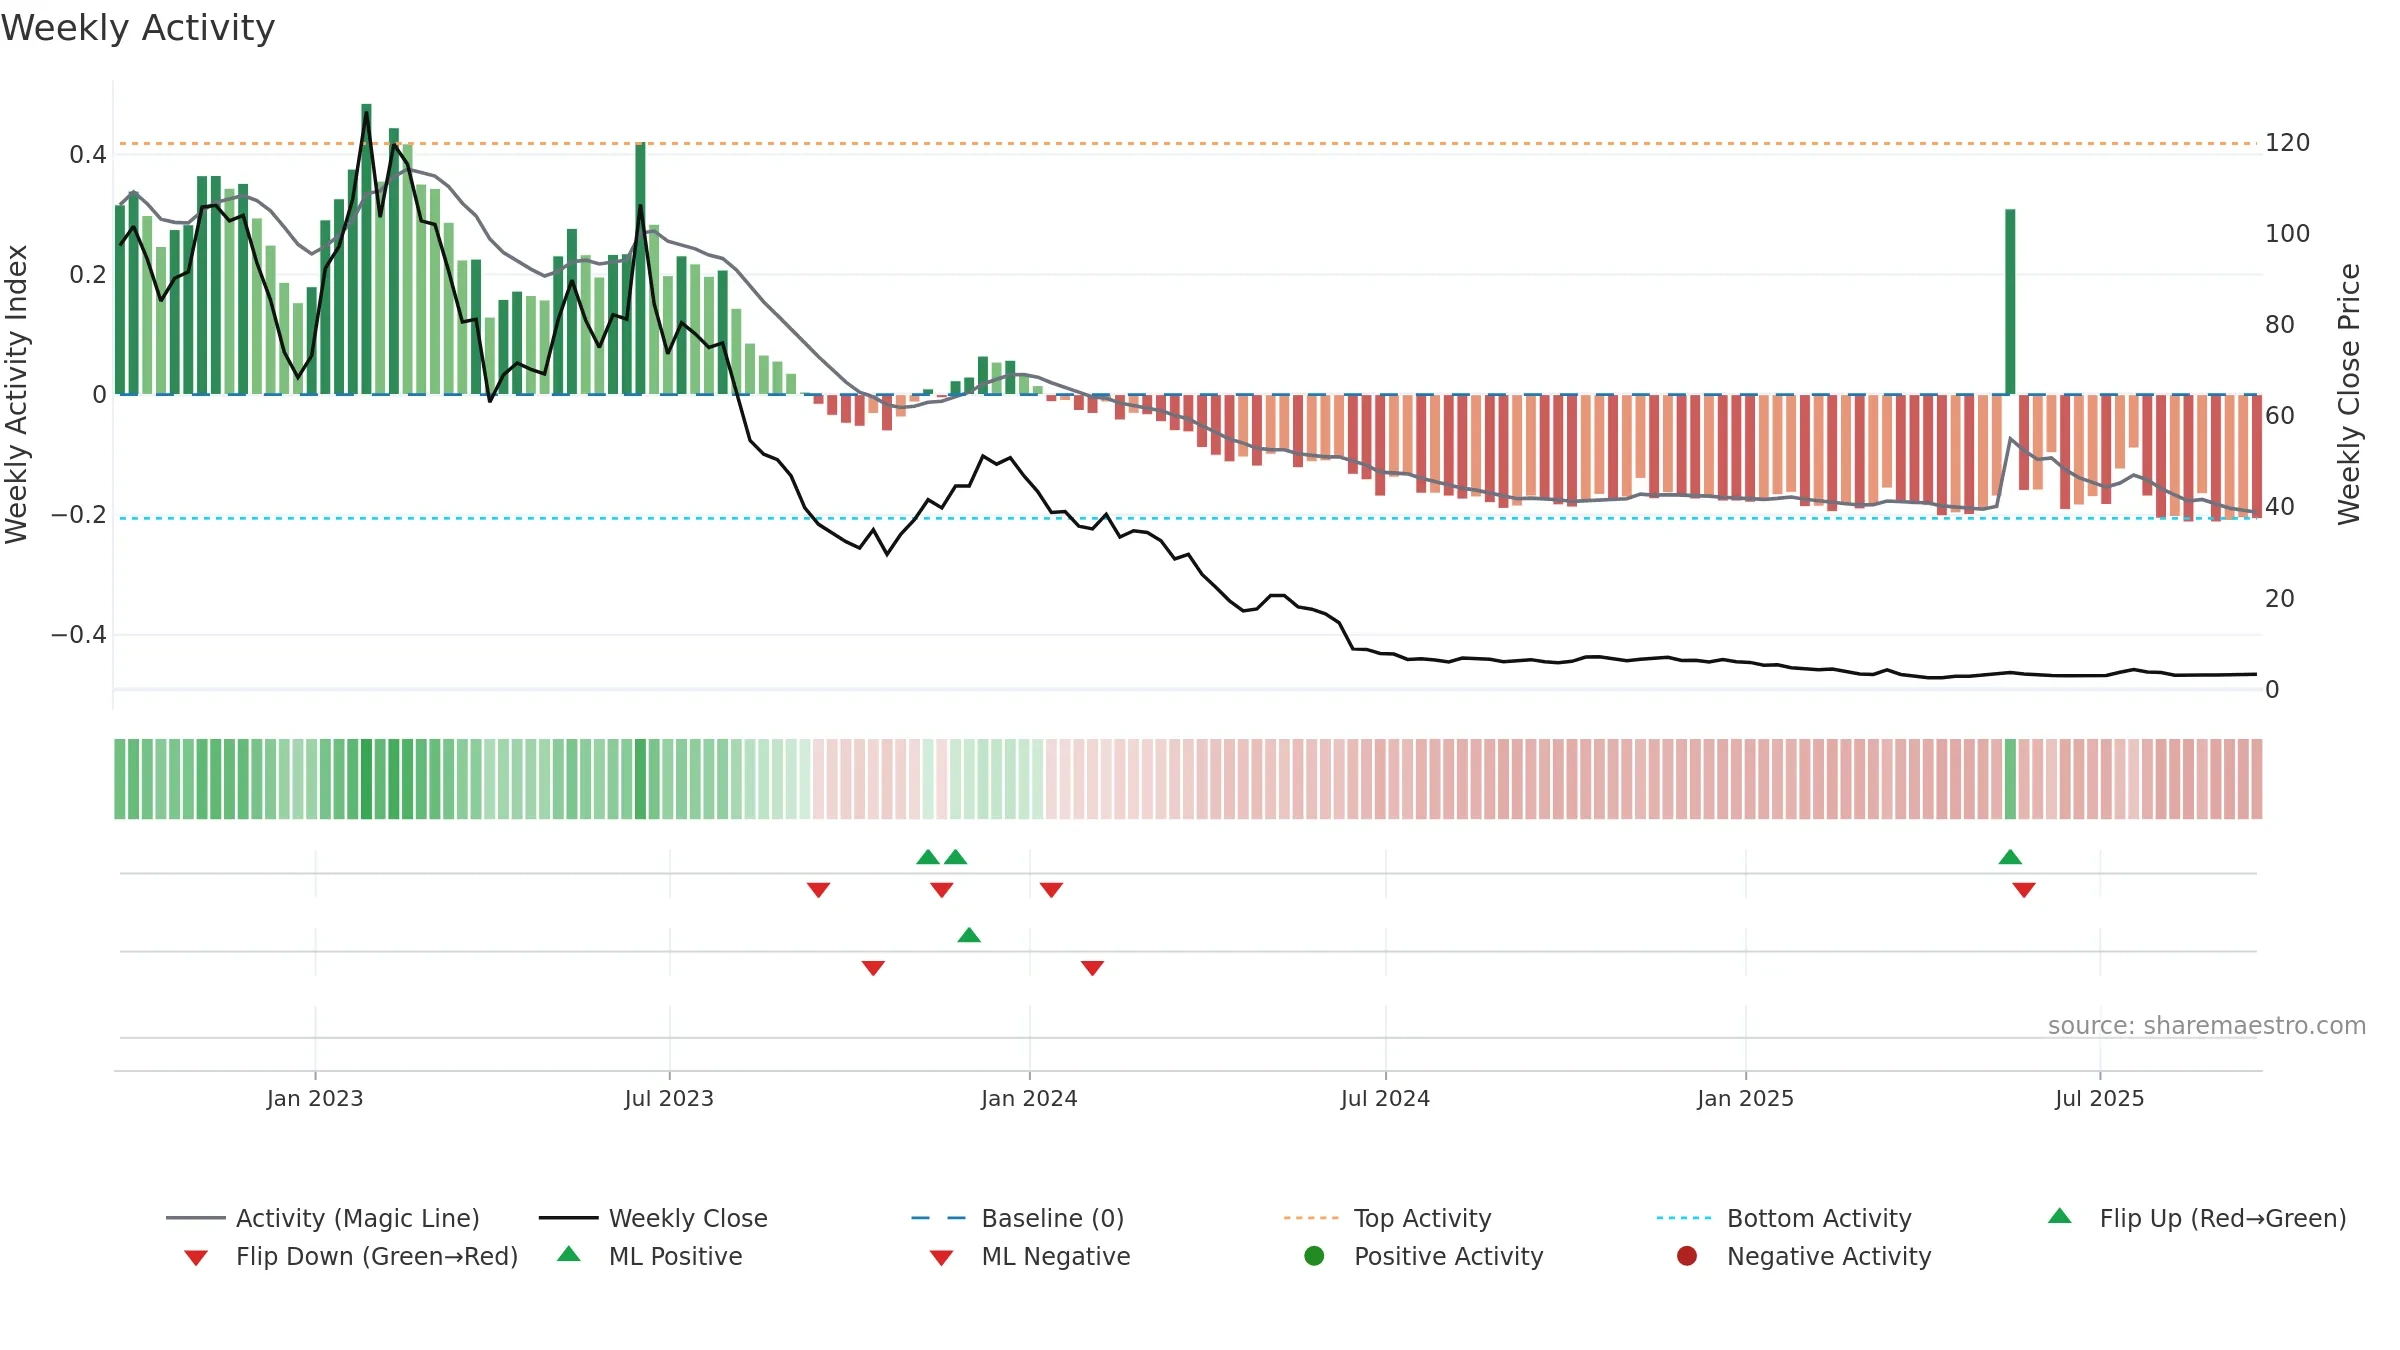
How to read this — Price slope is downward, indicating persistent supply pressure. Volume and price are moving in the same direction — a constructive confirmation. Returns are positively correlated with volume — strength tends to arrive on higher activity. Fresh short-term crossover improves near-term tone. Price holds above key averages, indicating constructive participation.
Down-slope argues for patience; rallies can fade sooner unless participation improves.
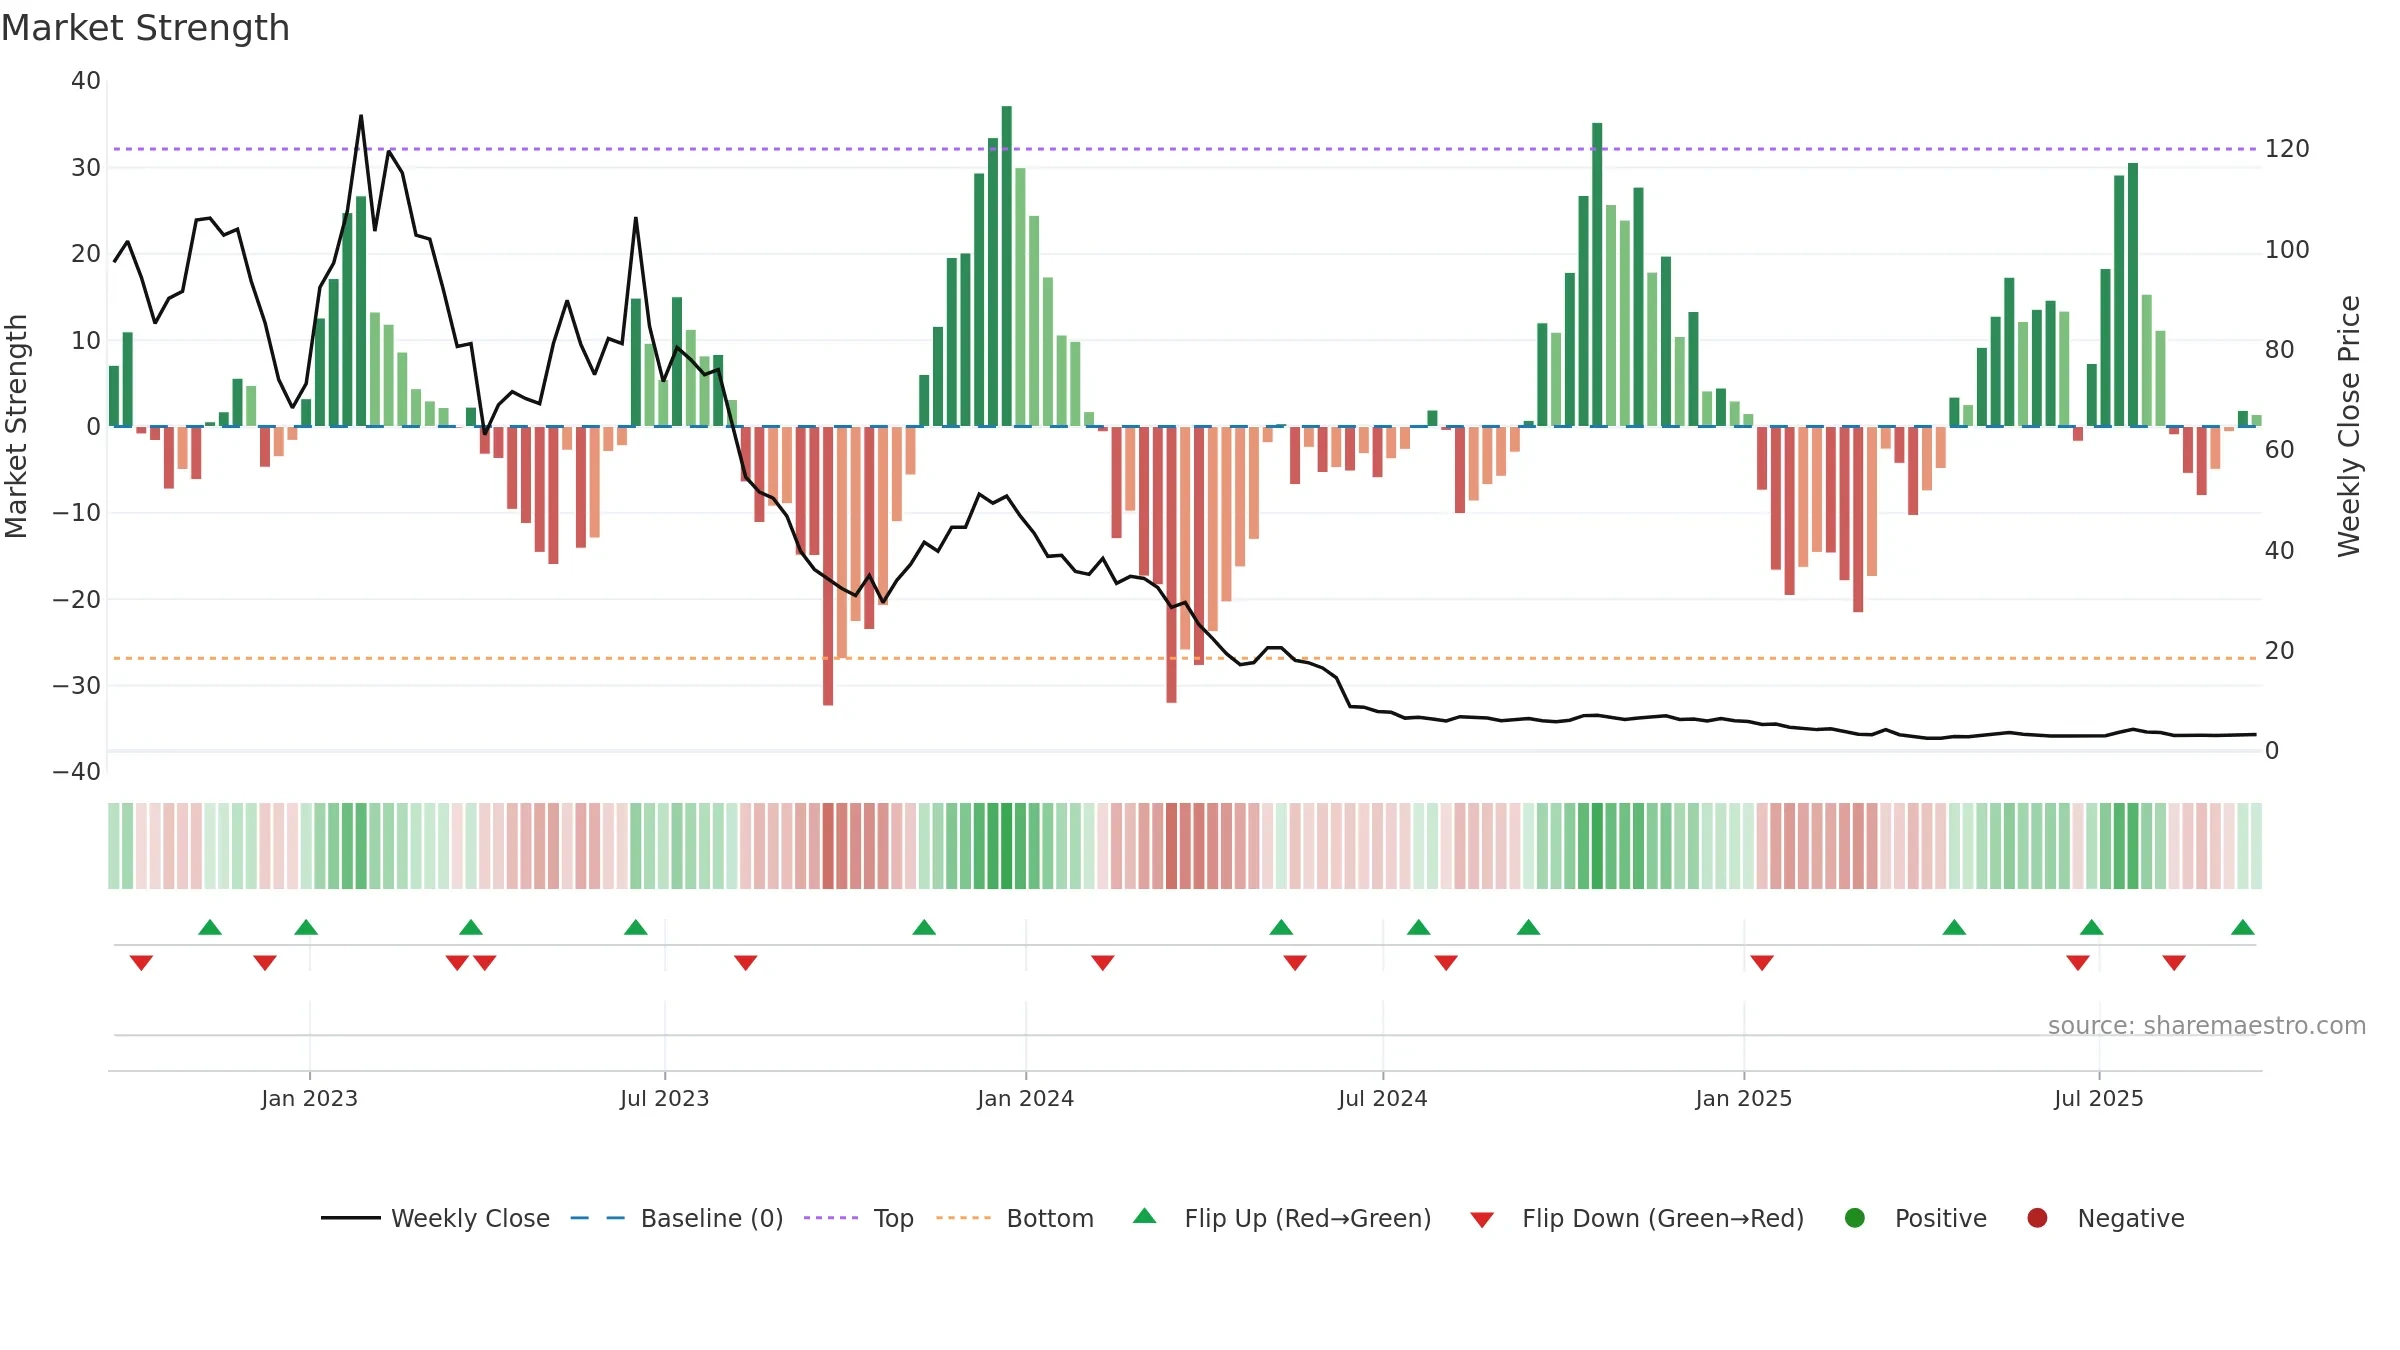
Gauge maps the trend signal to a 0–100 scale.
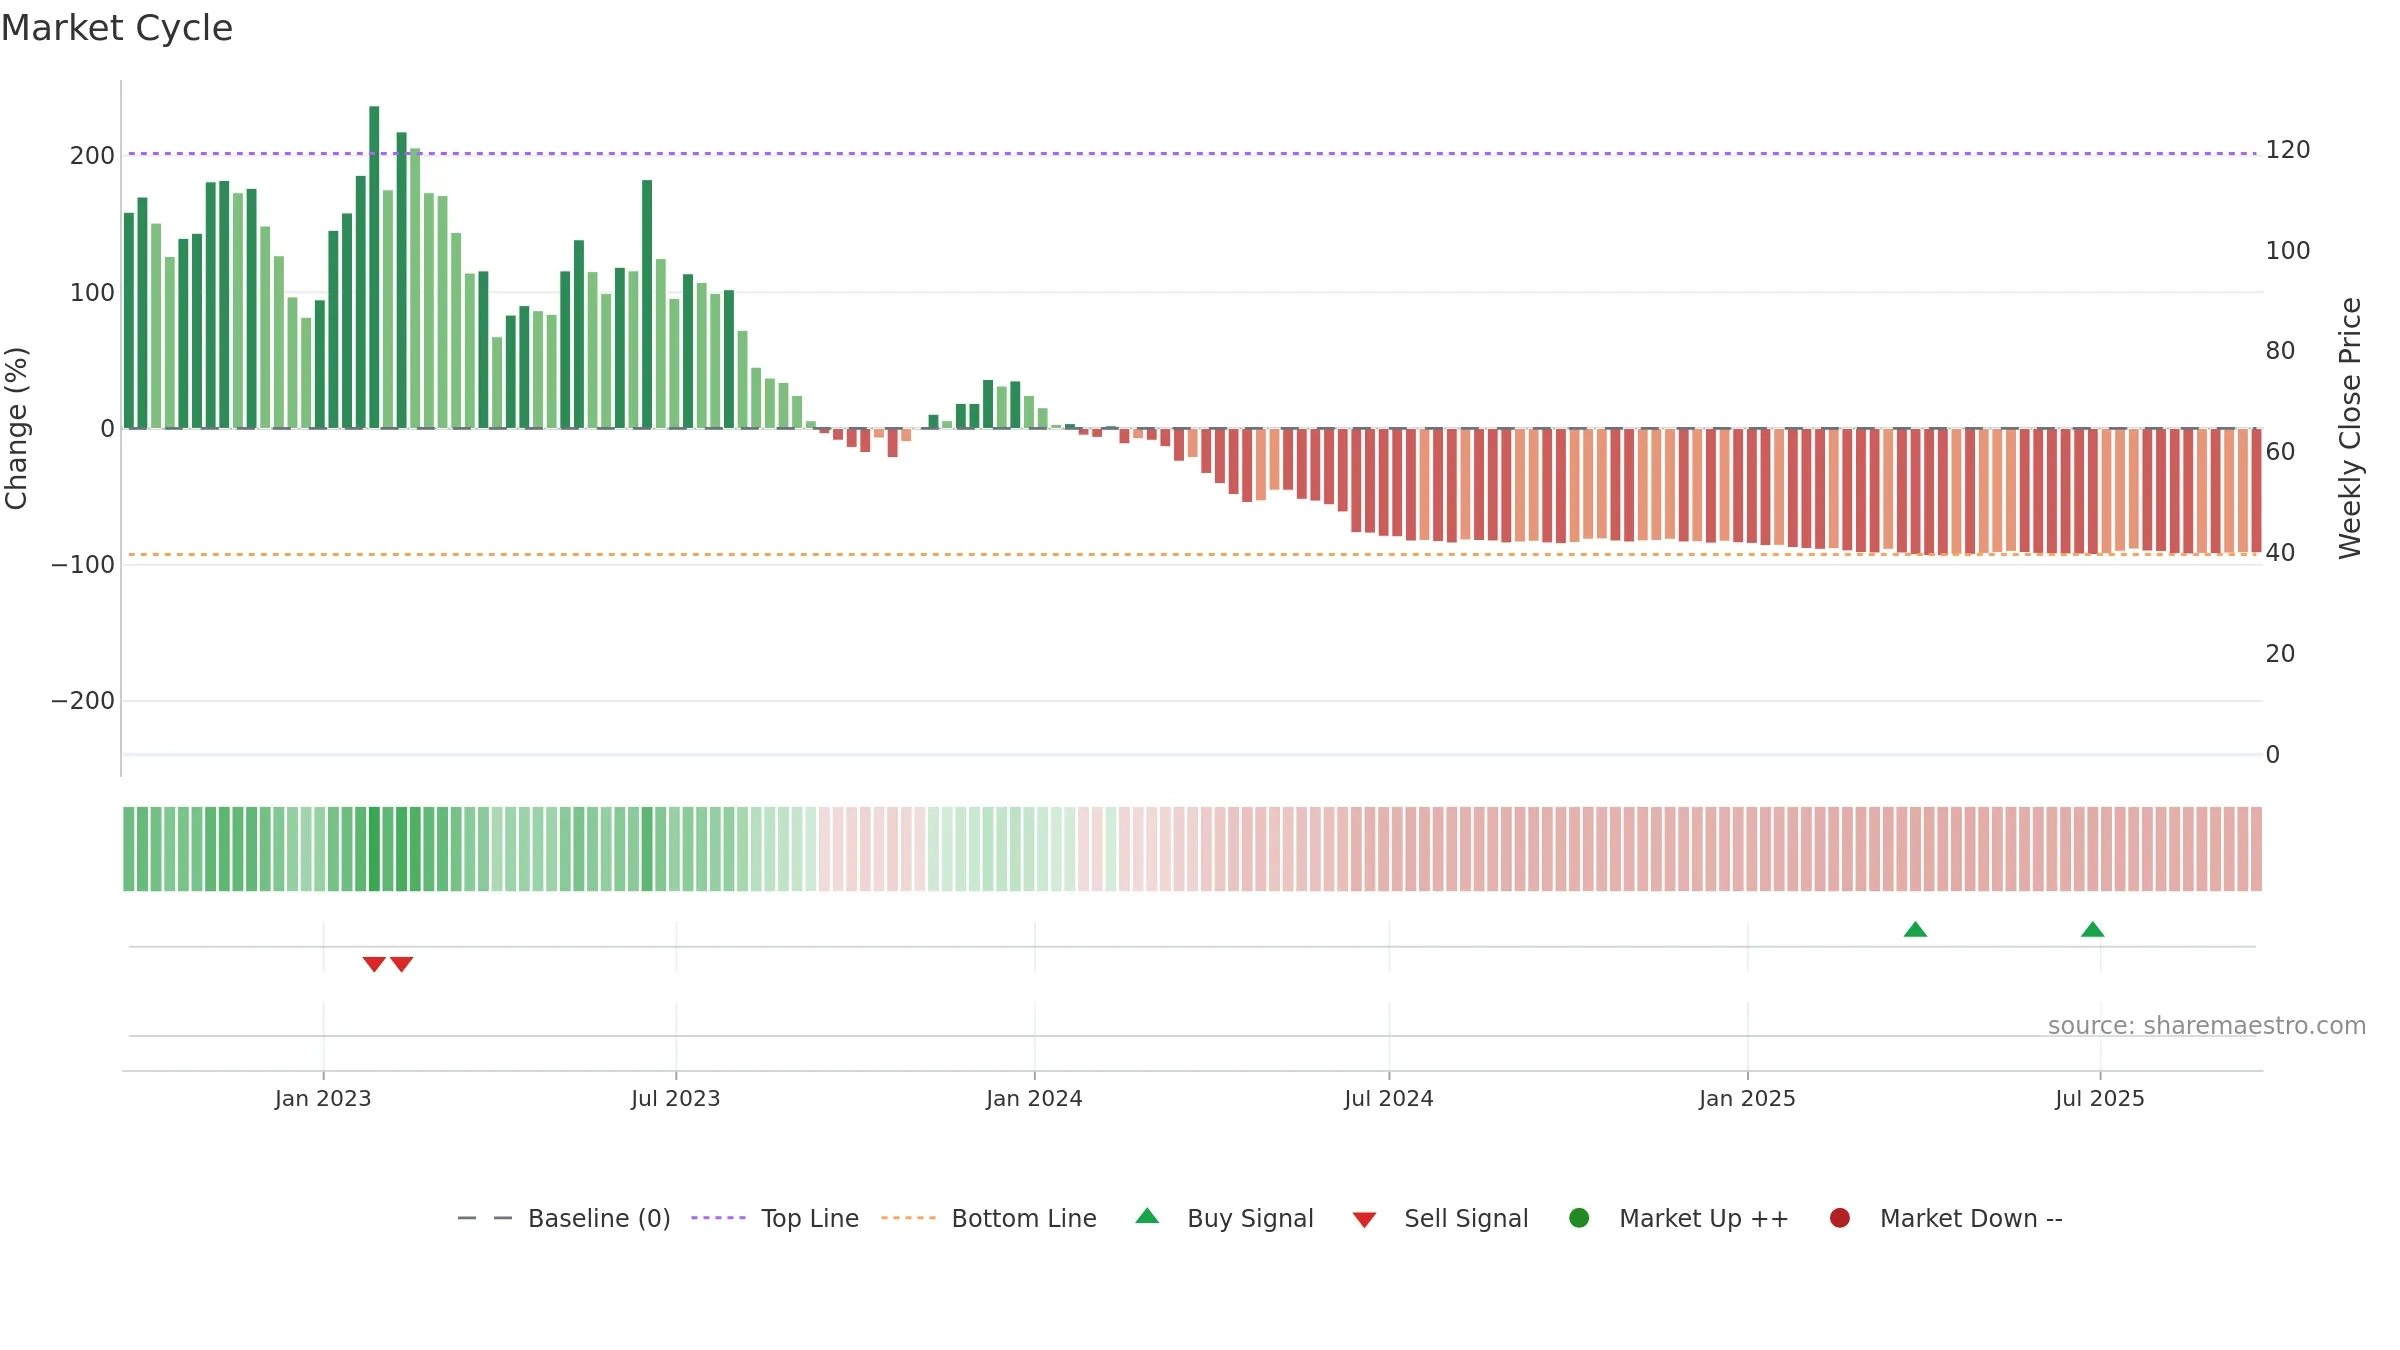
How to read this — Bearish backdrop but short-term momentum is improving; confirmation still needed.
Early improvement — look for a reclaim of 0.50→0.60 to validate.
Conclusion
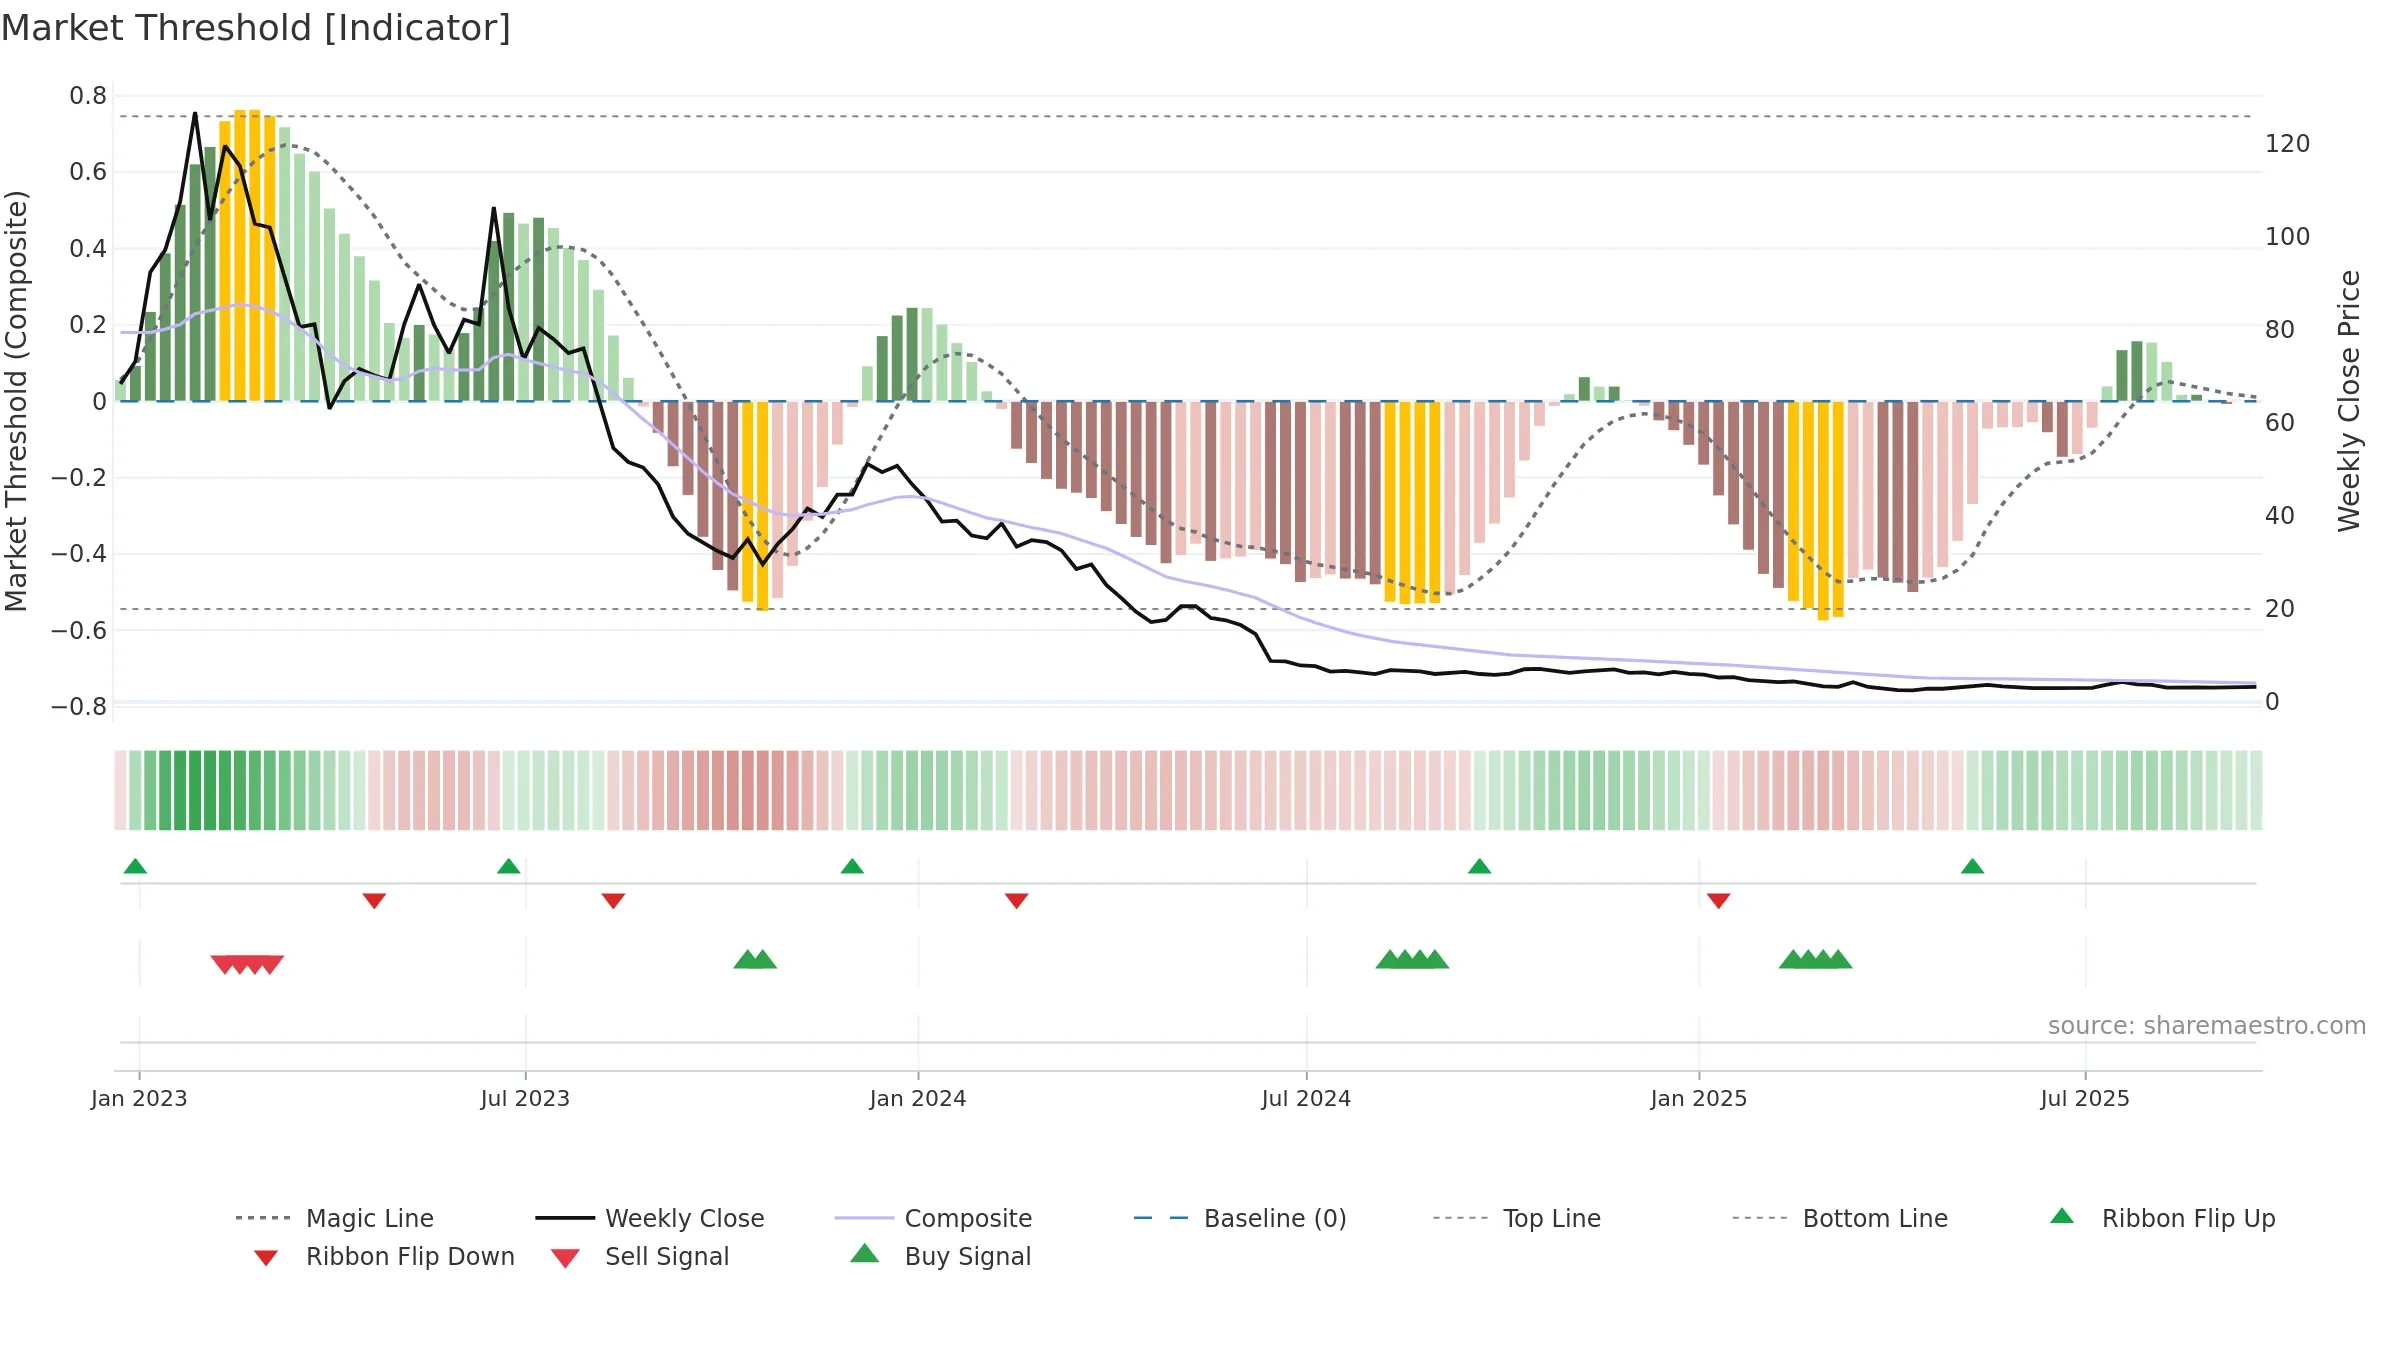
Positive setup. ★★★★☆ confidence. Price window: -10. Trend: Bottoming Attempt; gauge 34. In combination, liquidity confirms the move.
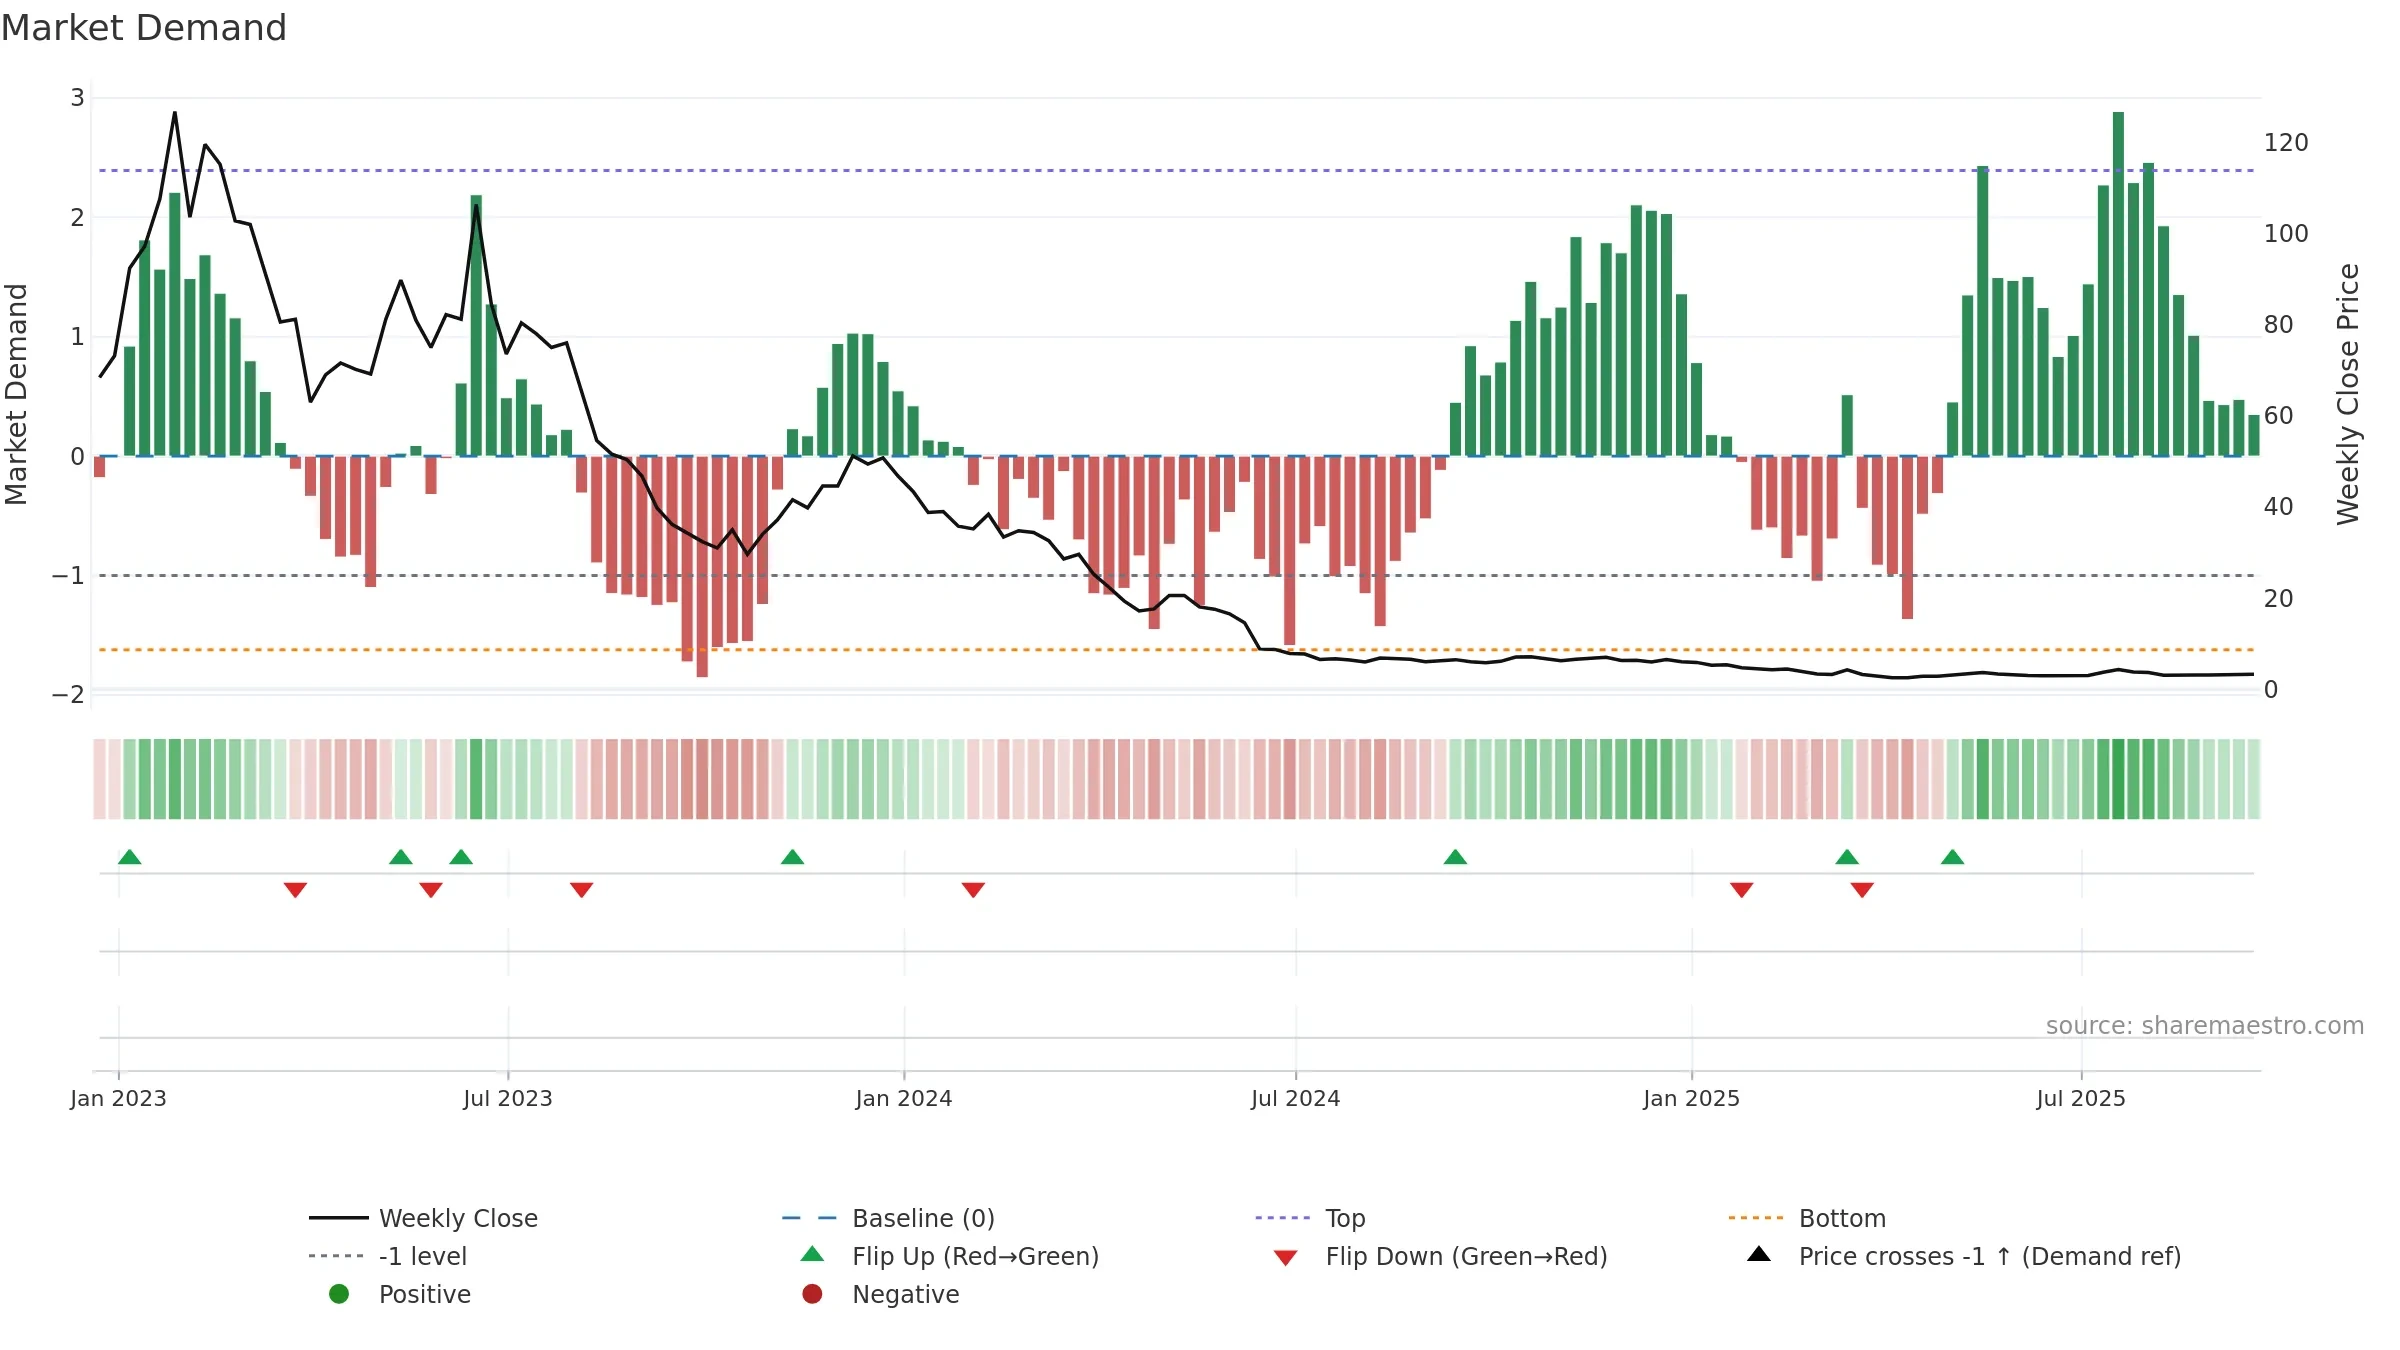
- Early improvement from bearish zone (bottoming attempt)
- Price holds above 8w & 26w averages
- Liquidity confirms the price trend
- Buyers step in at depressed levels (accumulation)
- Negative multi-week performance
Why: Price window -10.60% over 8w. Close is -10.60% below the prior-window high. Return volatility 2.36%. Volume trend falling. Liquidity convergence with price. Trend state bottoming attempt. Low-regime (≤0.25) upticks 3/5 (60.0%) • Accumulating. 4–8w crossover bullish. Momentum neutral and rising.
Tip: Most metrics include a hover tooltip where they appear in the report.