H.B. Fuller Company
FUL NYSE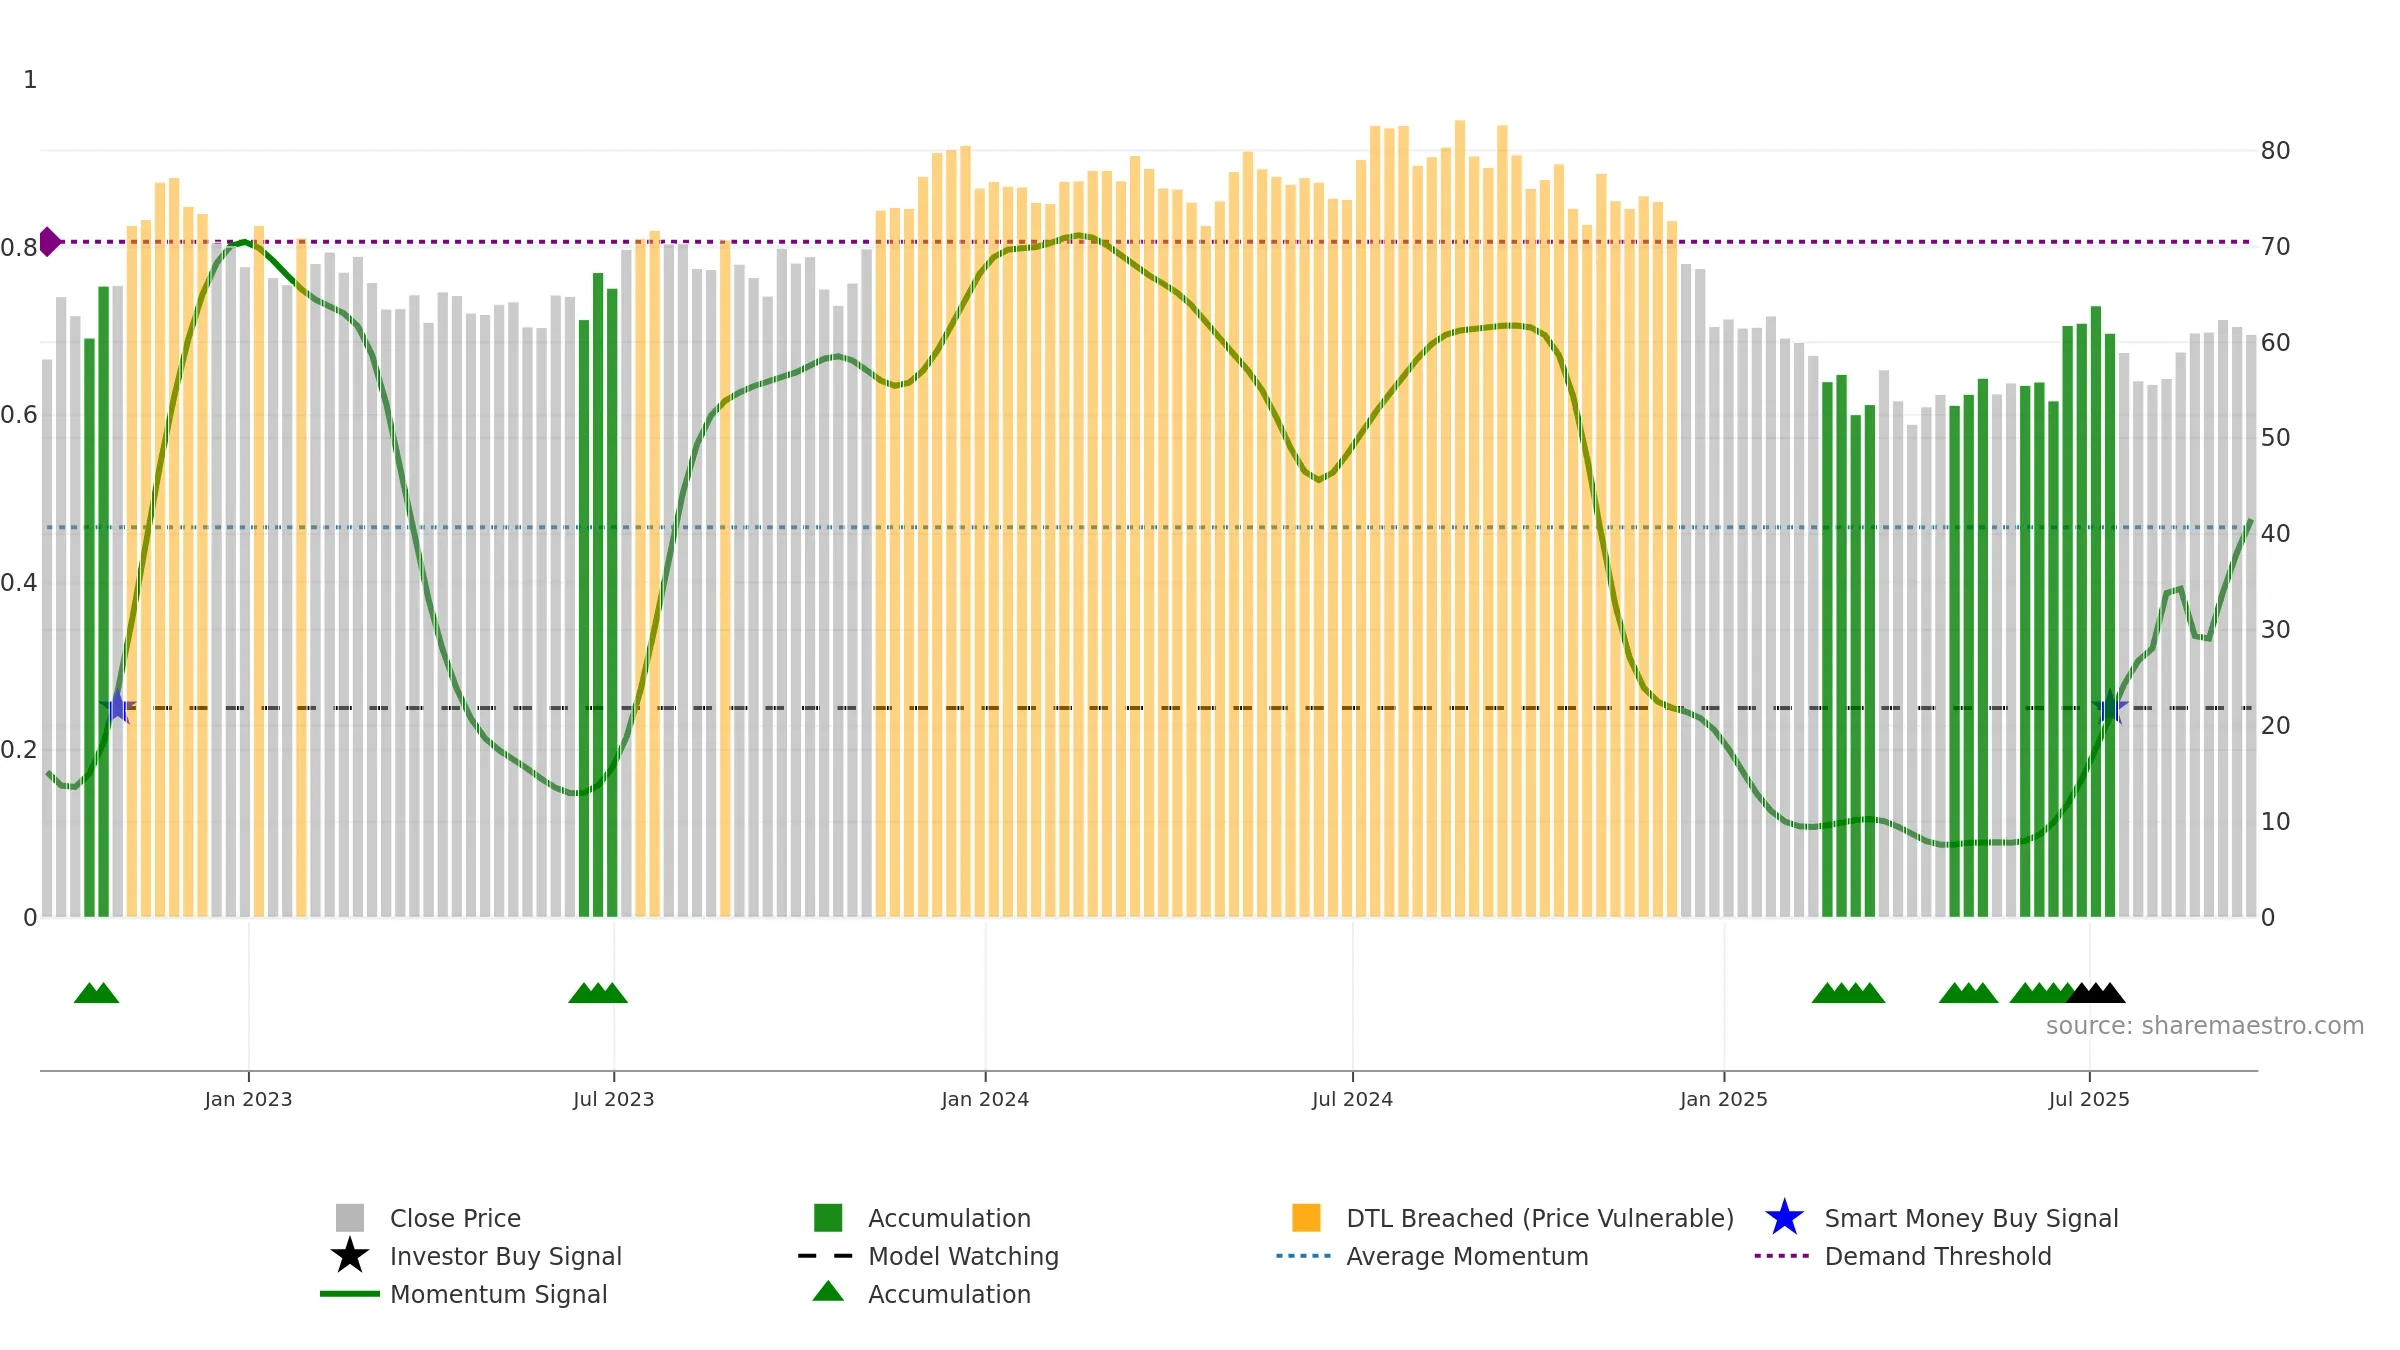
Weekly Report
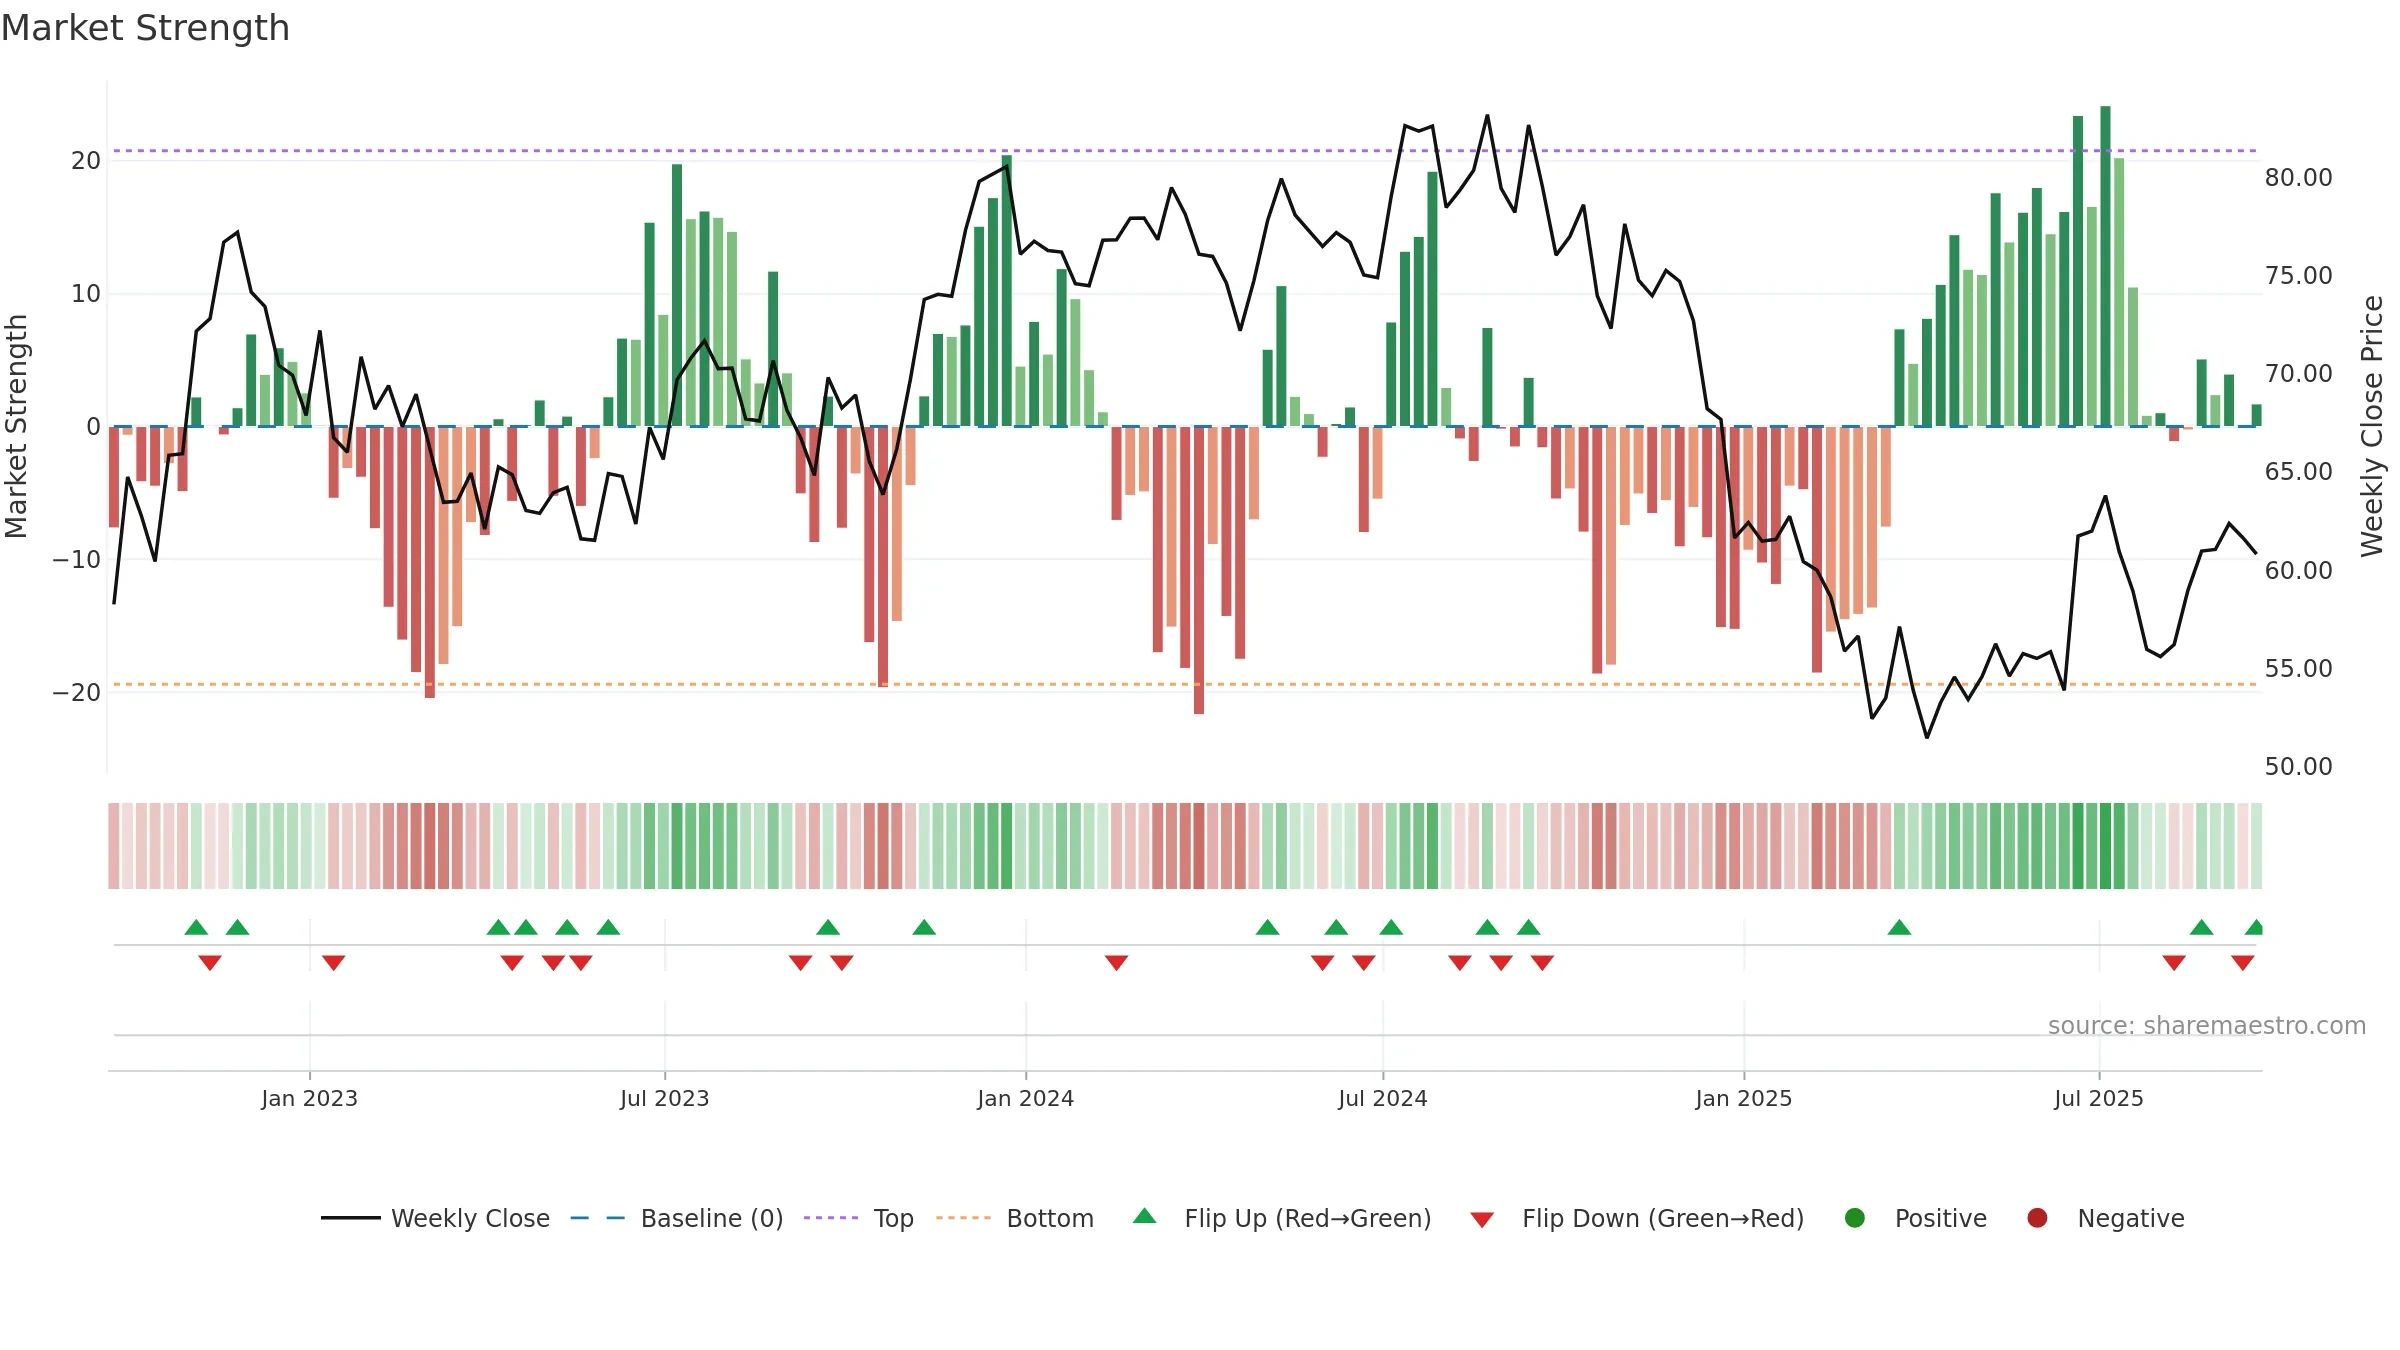
H.B. Fuller Company closed at 60.8100 (-1.41% WoW) . Data window ends Fri, 19 Sep 2025.
How to read this — Price slope is upward, indicating persistent buying over the window. Low weekly volatility favours steadier follow-through. Volume and price are moving in the same direction — a constructive confirmation. Returns are positively correlated with volume — strength tends to arrive on higher activity. Price holds above key averages, indicating constructive participation.
Up-slope supports buying interest; pullbacks may be contained if activity stays firm.
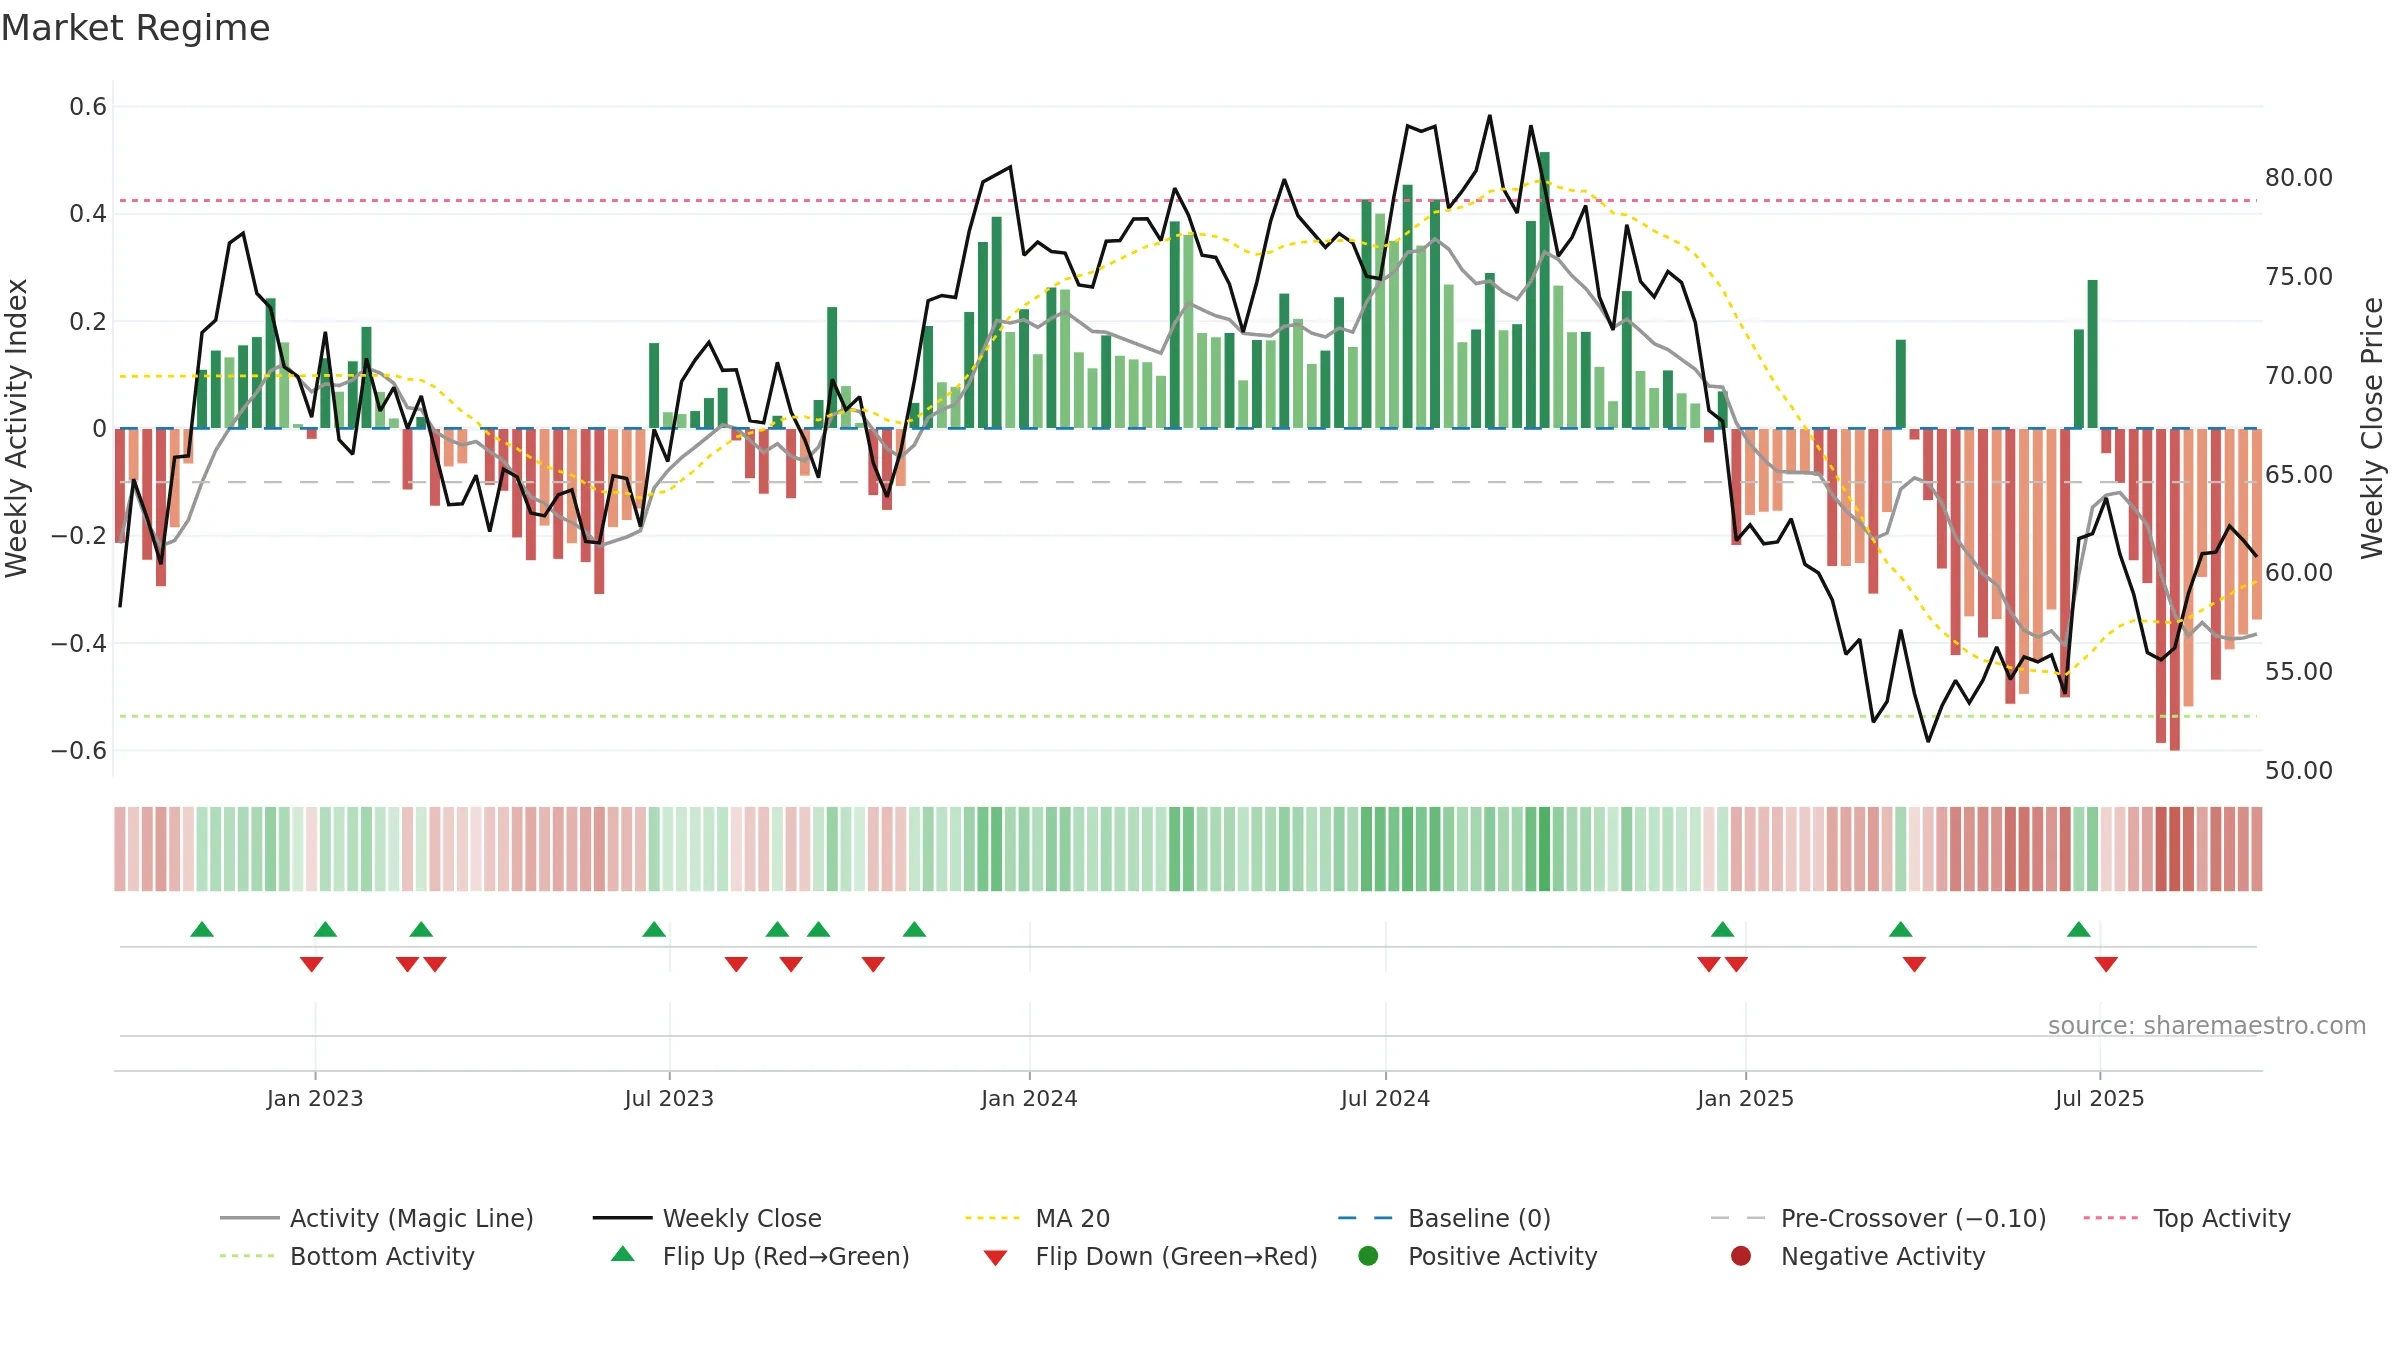
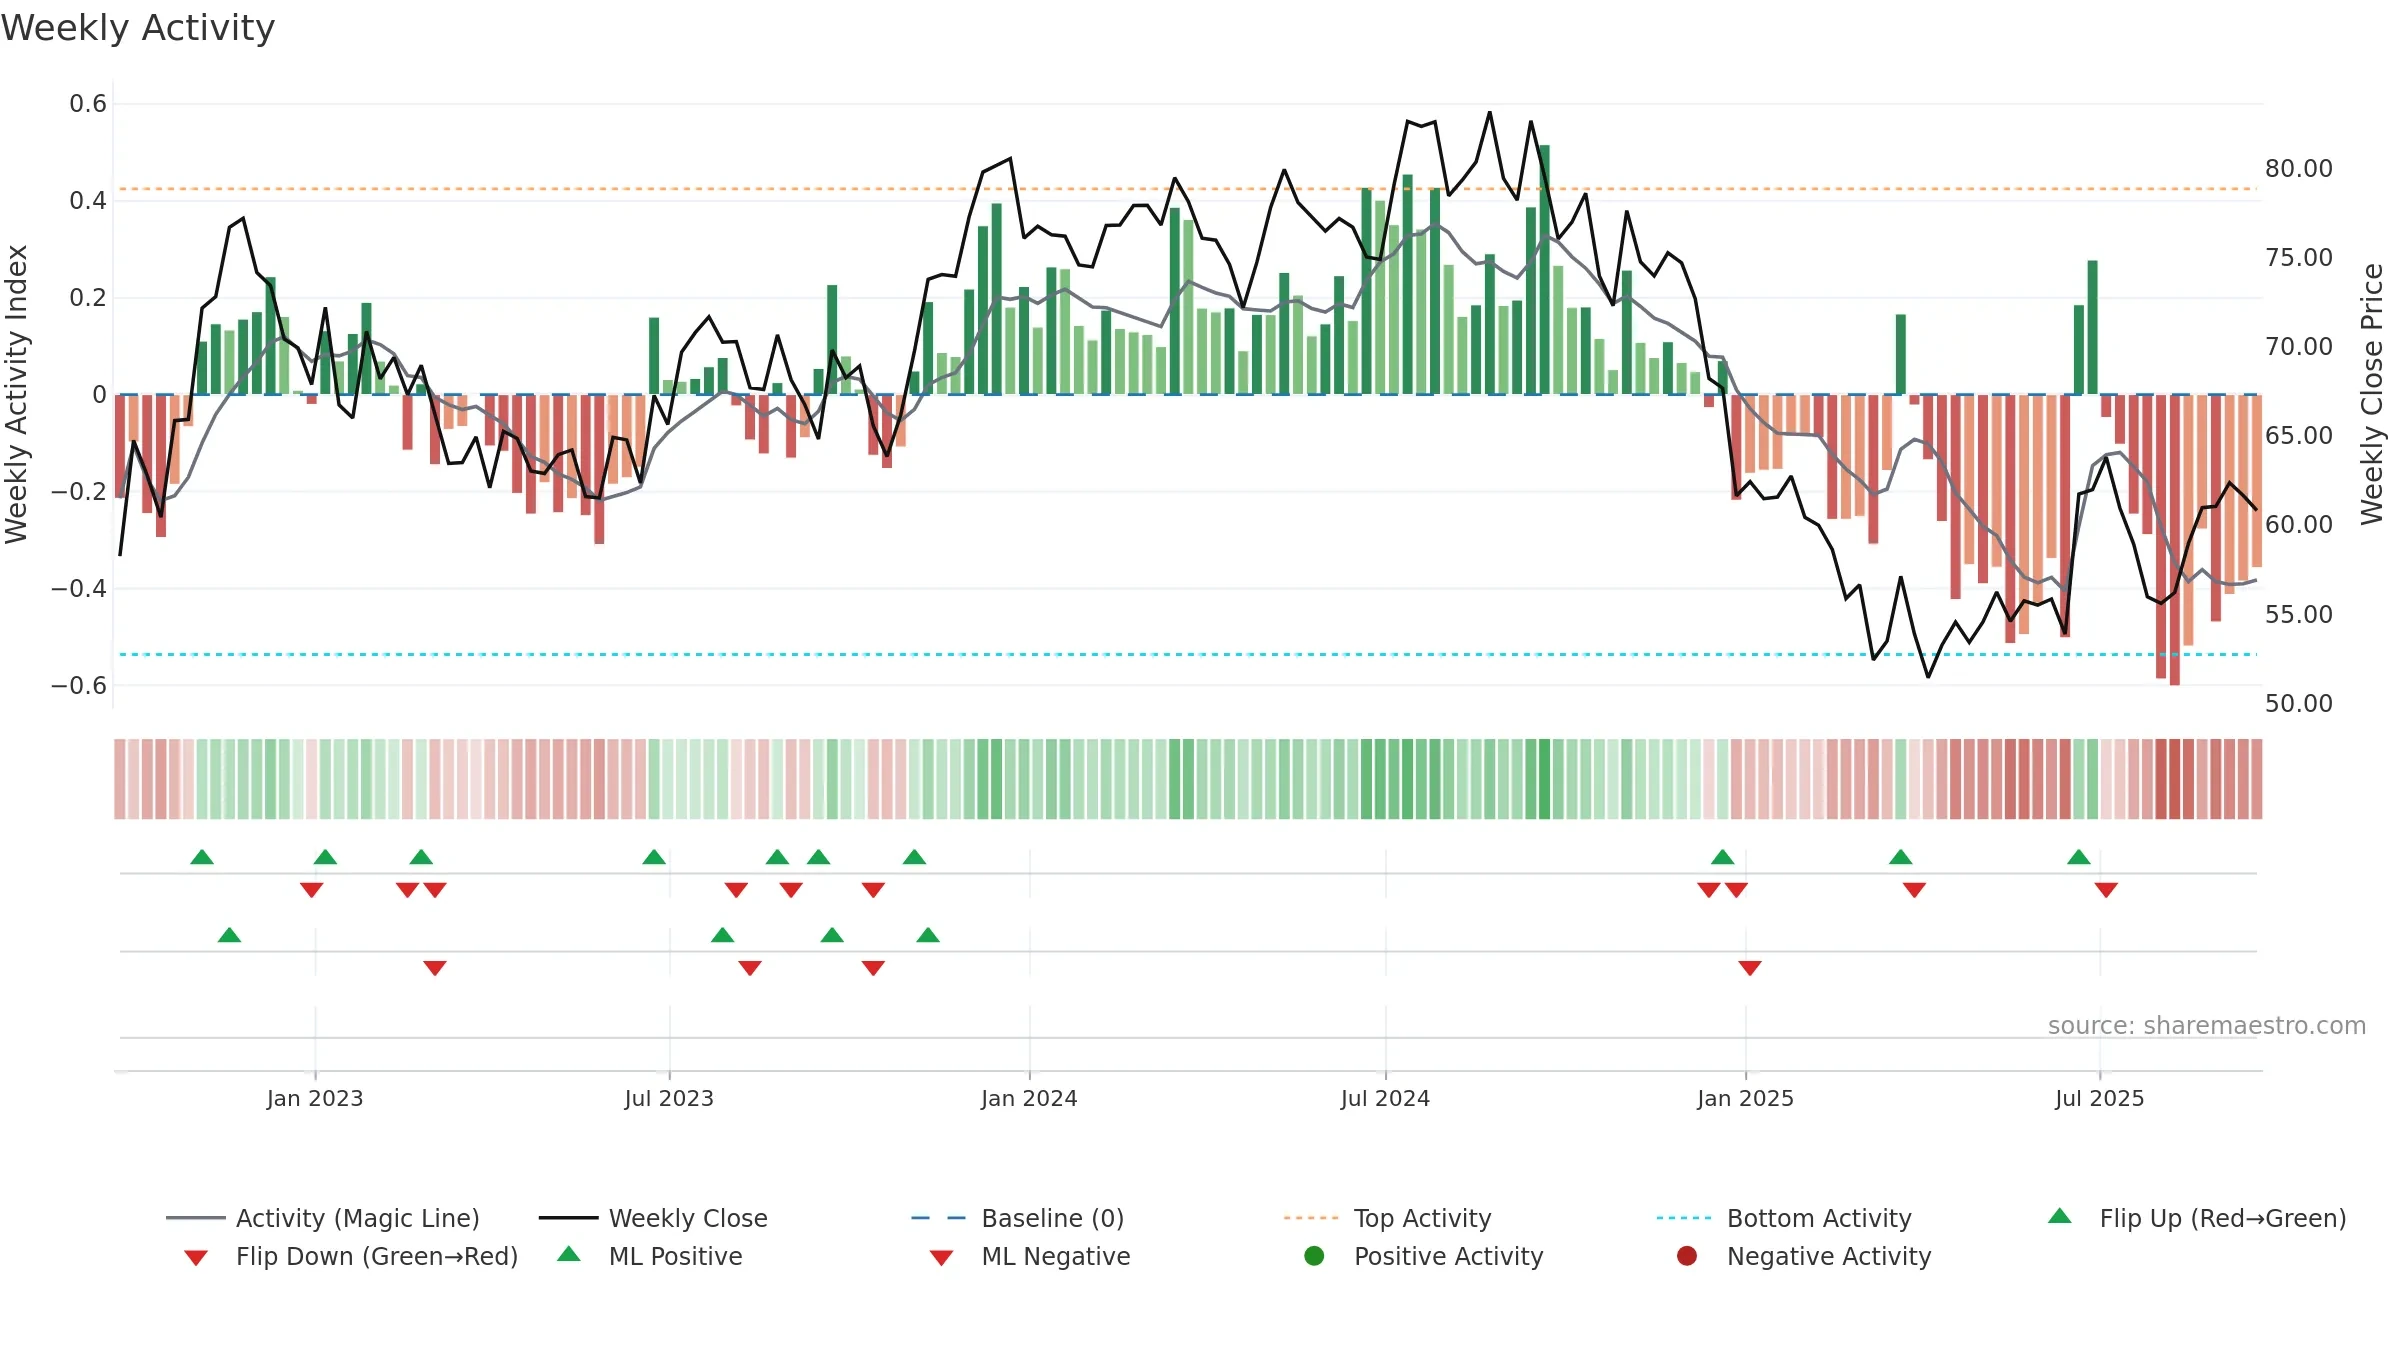
Gauge maps the trend signal to a 0–100 scale.
How to read this — Range-bound conditions; conviction is limited until a break or acceleration emerges.
Wait for a directional break or improving acceleration.
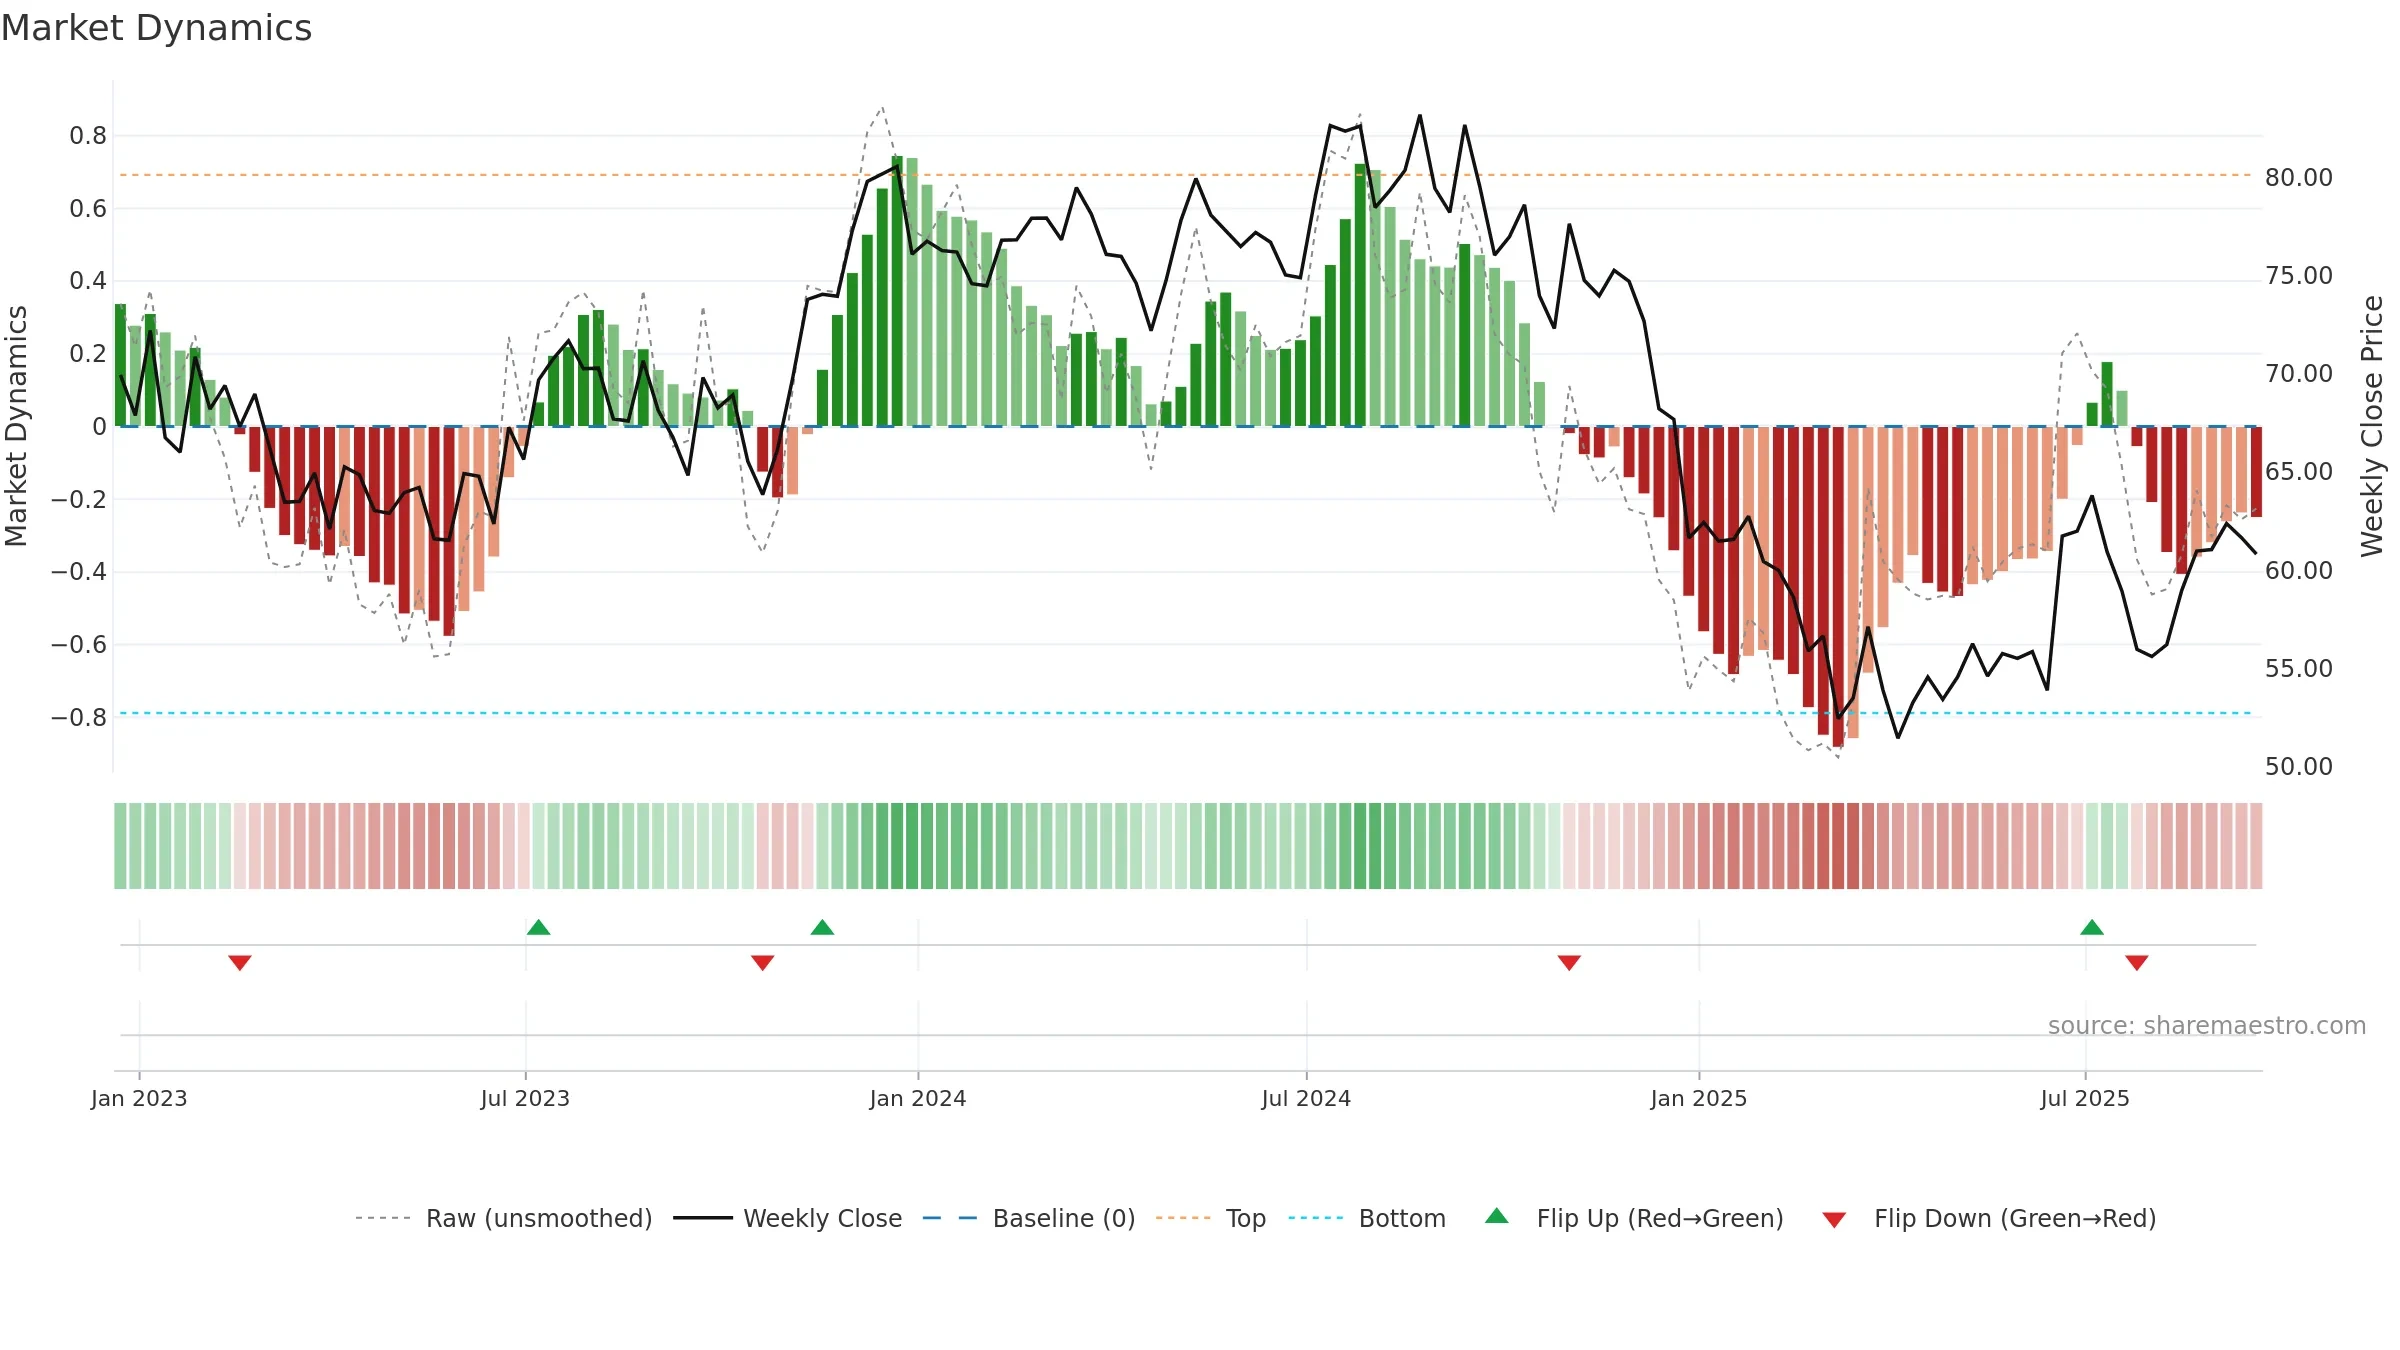
The flag is positive: favourable upside skew with supportive conditions.
Conclusion
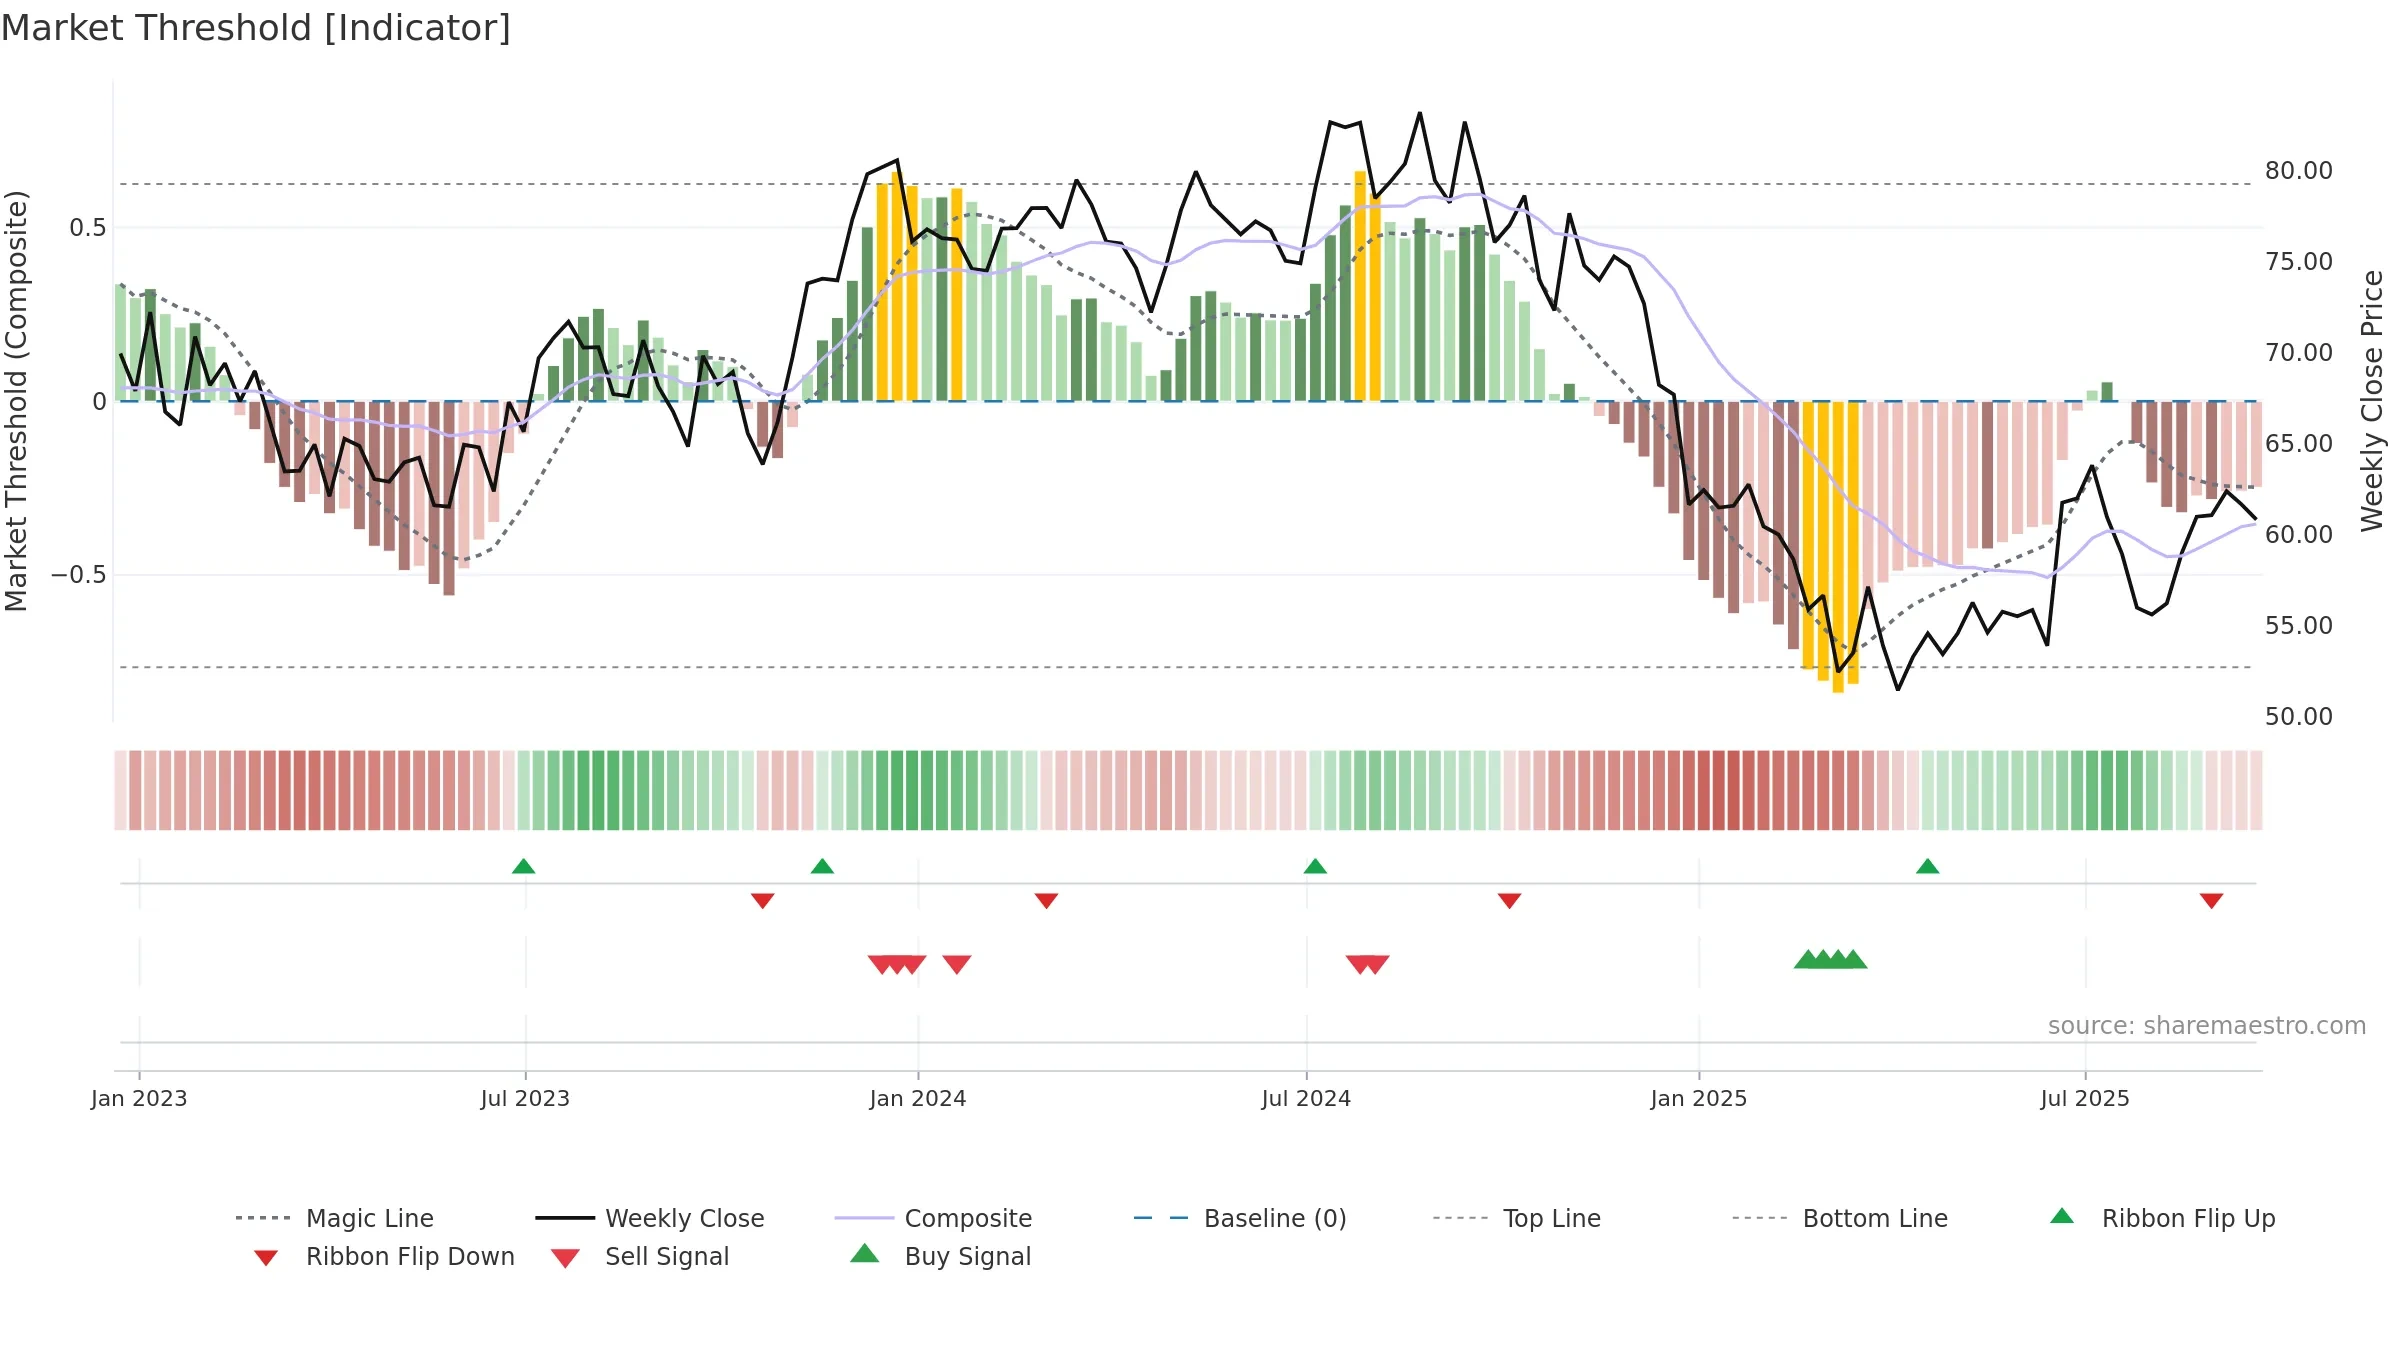
Positive setup. ★★★★★ confidence. Price window: 9. Trend: Range / Neutral; gauge 47. In combination, liquidity confirms the move.
- Price holds above 8w & 26w averages
- Liquidity confirms the price trend
- Low return volatility supports durability
Why: Price window 9.37% over 8w. Close is -2.50% below the prior-window high. Return volatility 1.30%. Volume trend rising. Liquidity convergence with price. Trend state range / neutral. Momentum neutral and rising. Valuation stance positive.
Tip: Most metrics include a hover tooltip where they appear in the report.