Horace Mann Educators Corporation
HMN NYSE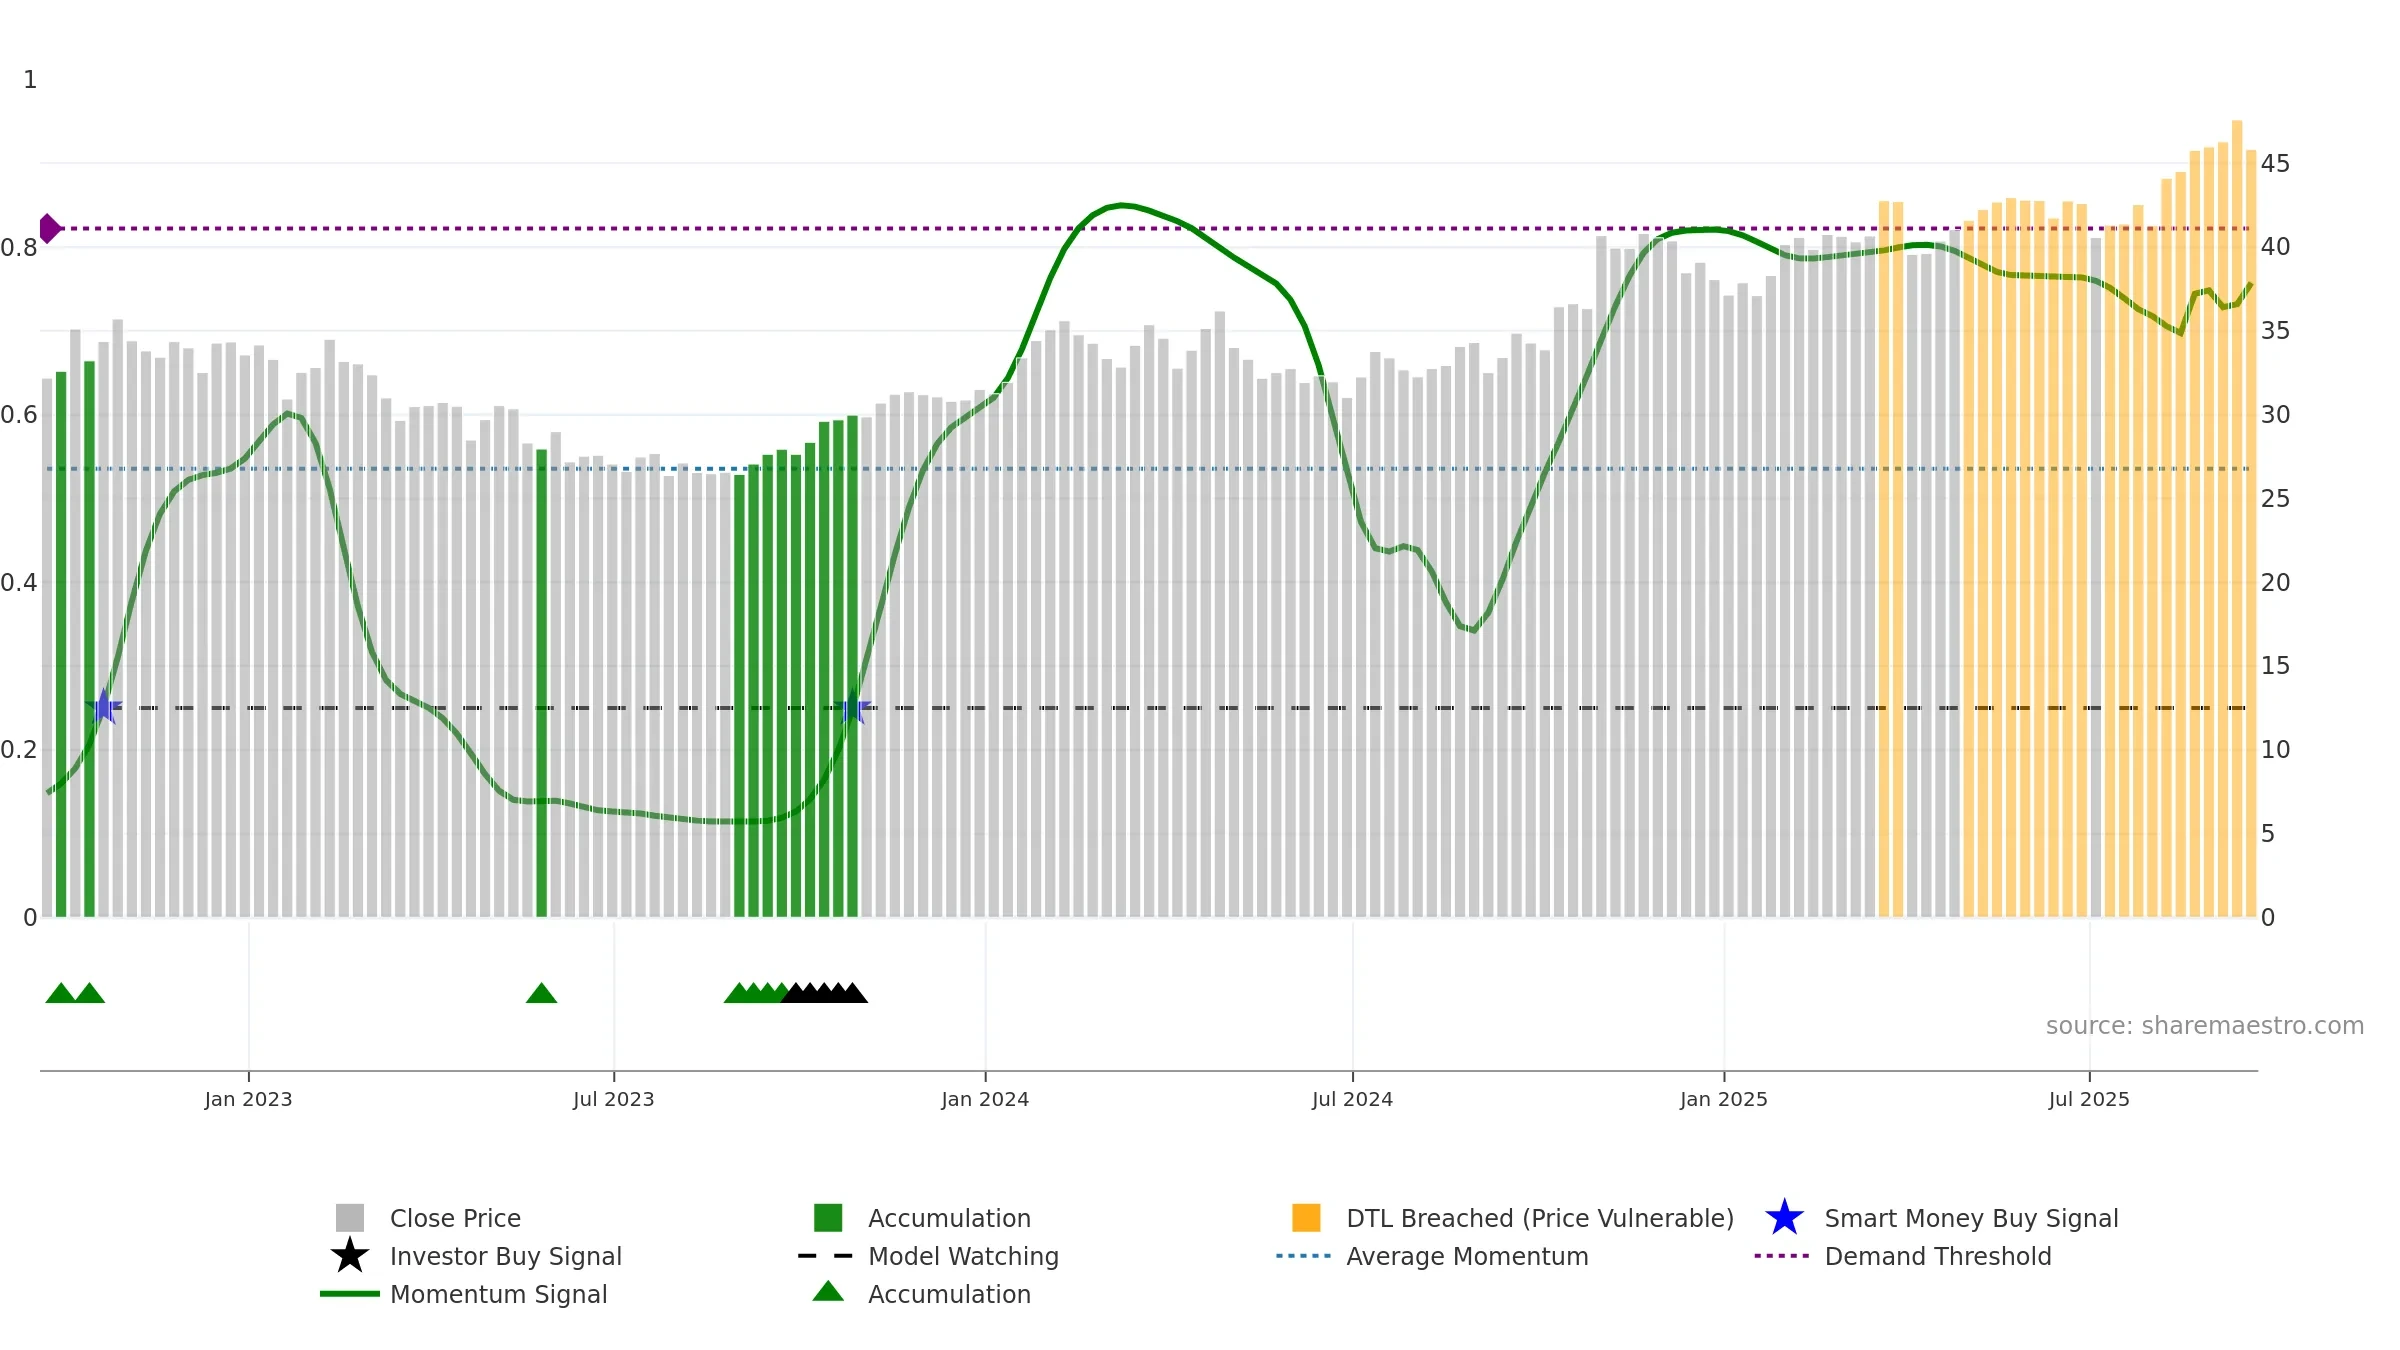
Weekly Report
Horace Mann Educators Corporation closed at 45.8400 (-0.82% WoW) . Data window ends Fri, 19 Sep 2025.
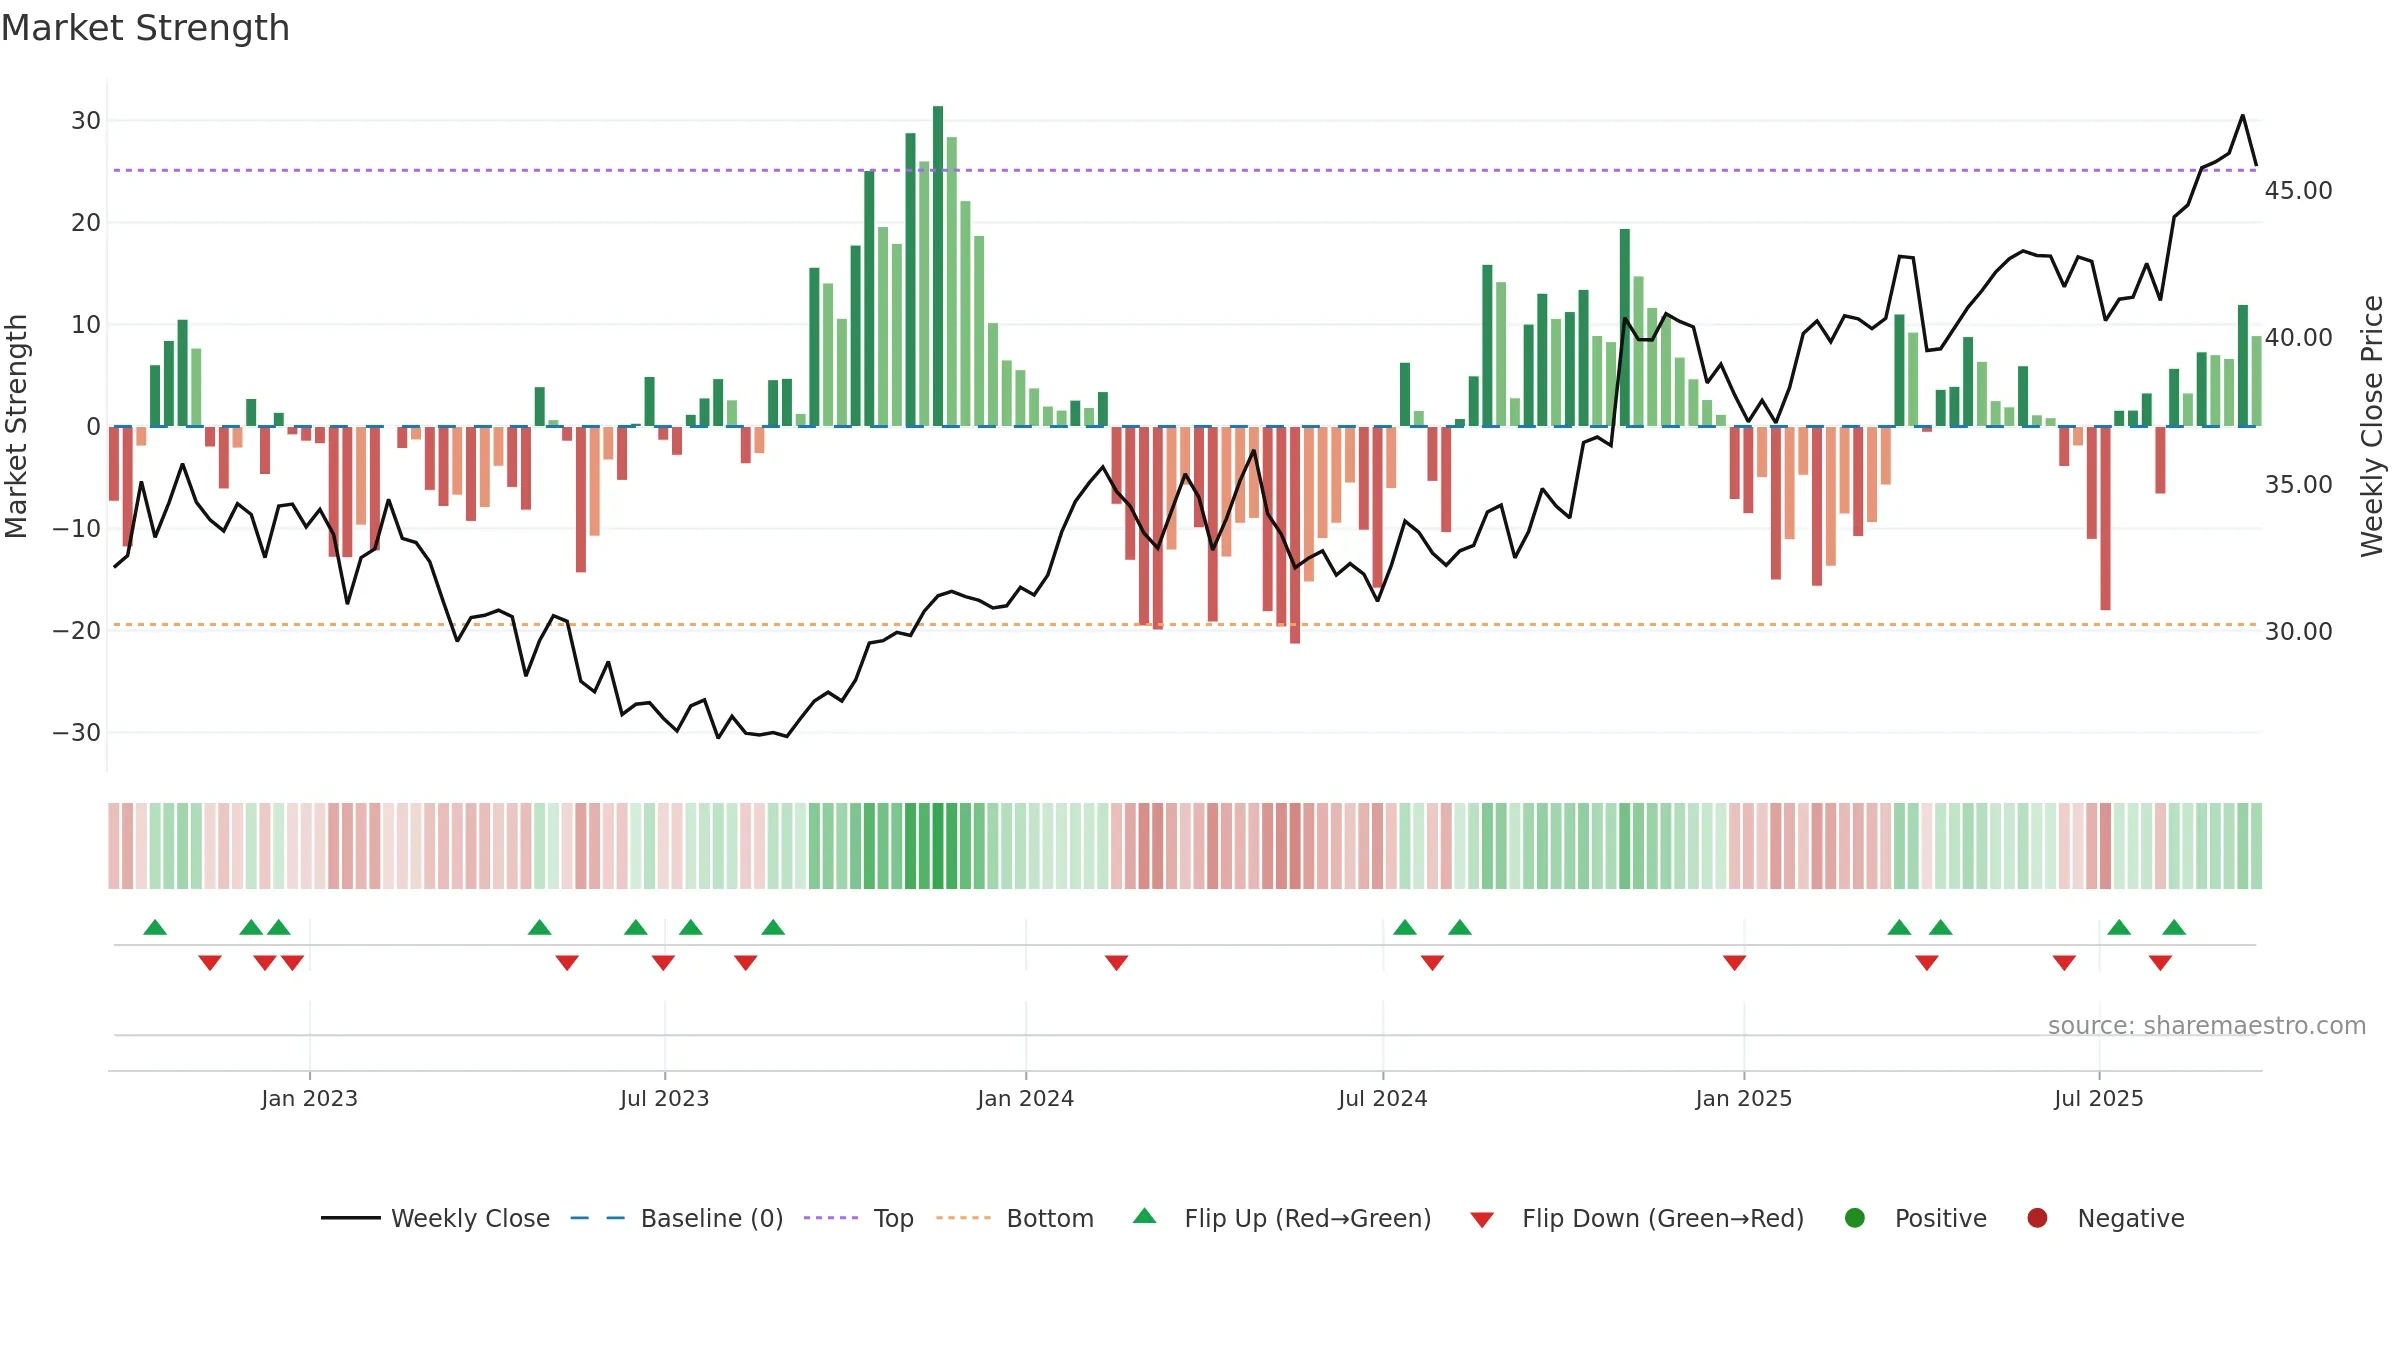
How to read this — Price slope is upward, indicating persistent buying over the window. Low weekly volatility favours steadier follow-through. Volume and price are moving in the same direction — a constructive confirmation. Constructive MA stack supports the up-drift; pullbacks may find support at the 8–13 week region. Price holds above key averages, indicating constructive participation.
Up-slope supports buying interest; pullbacks may be contained if activity stays firm.
Gauge maps the trend signal to a 0–100 scale.
How to read this — High gauge and rising momentum — buyers in control.
Bias remains higher; pullbacks could be buyable if participation holds.
Price is below fair value; potential upside if momentum constructive.
Conclusion
Positive setup. ★★★★★ confidence. Price window: 11. Trend: Strong Uptrend; gauge 75. In combination, liquidity confirms the move.
- High gauge with rising momentum (strong uptrend)
- Momentum is bullish and rising
- Price holds above 8w & 26w averages
- Constructive moving-average stack
Why: Price window 11.07% over 8w. Close is -3.68% below the prior-window high. Return volatility 1.51%. Volume trend rising. Liquidity convergence with price. Trend state strong uptrend. MA stack constructive. Momentum bullish and rising. Valuation supportive skew.
Tip: Most metrics include a hover tooltip where they appear in the report.