Weekly Report
iShares U.S. Broker-Dealers & Securities Exchanges ETF closed at 176.6400 (-0.07% WoW) . Data window ends Fri, 19 Sep 2025.
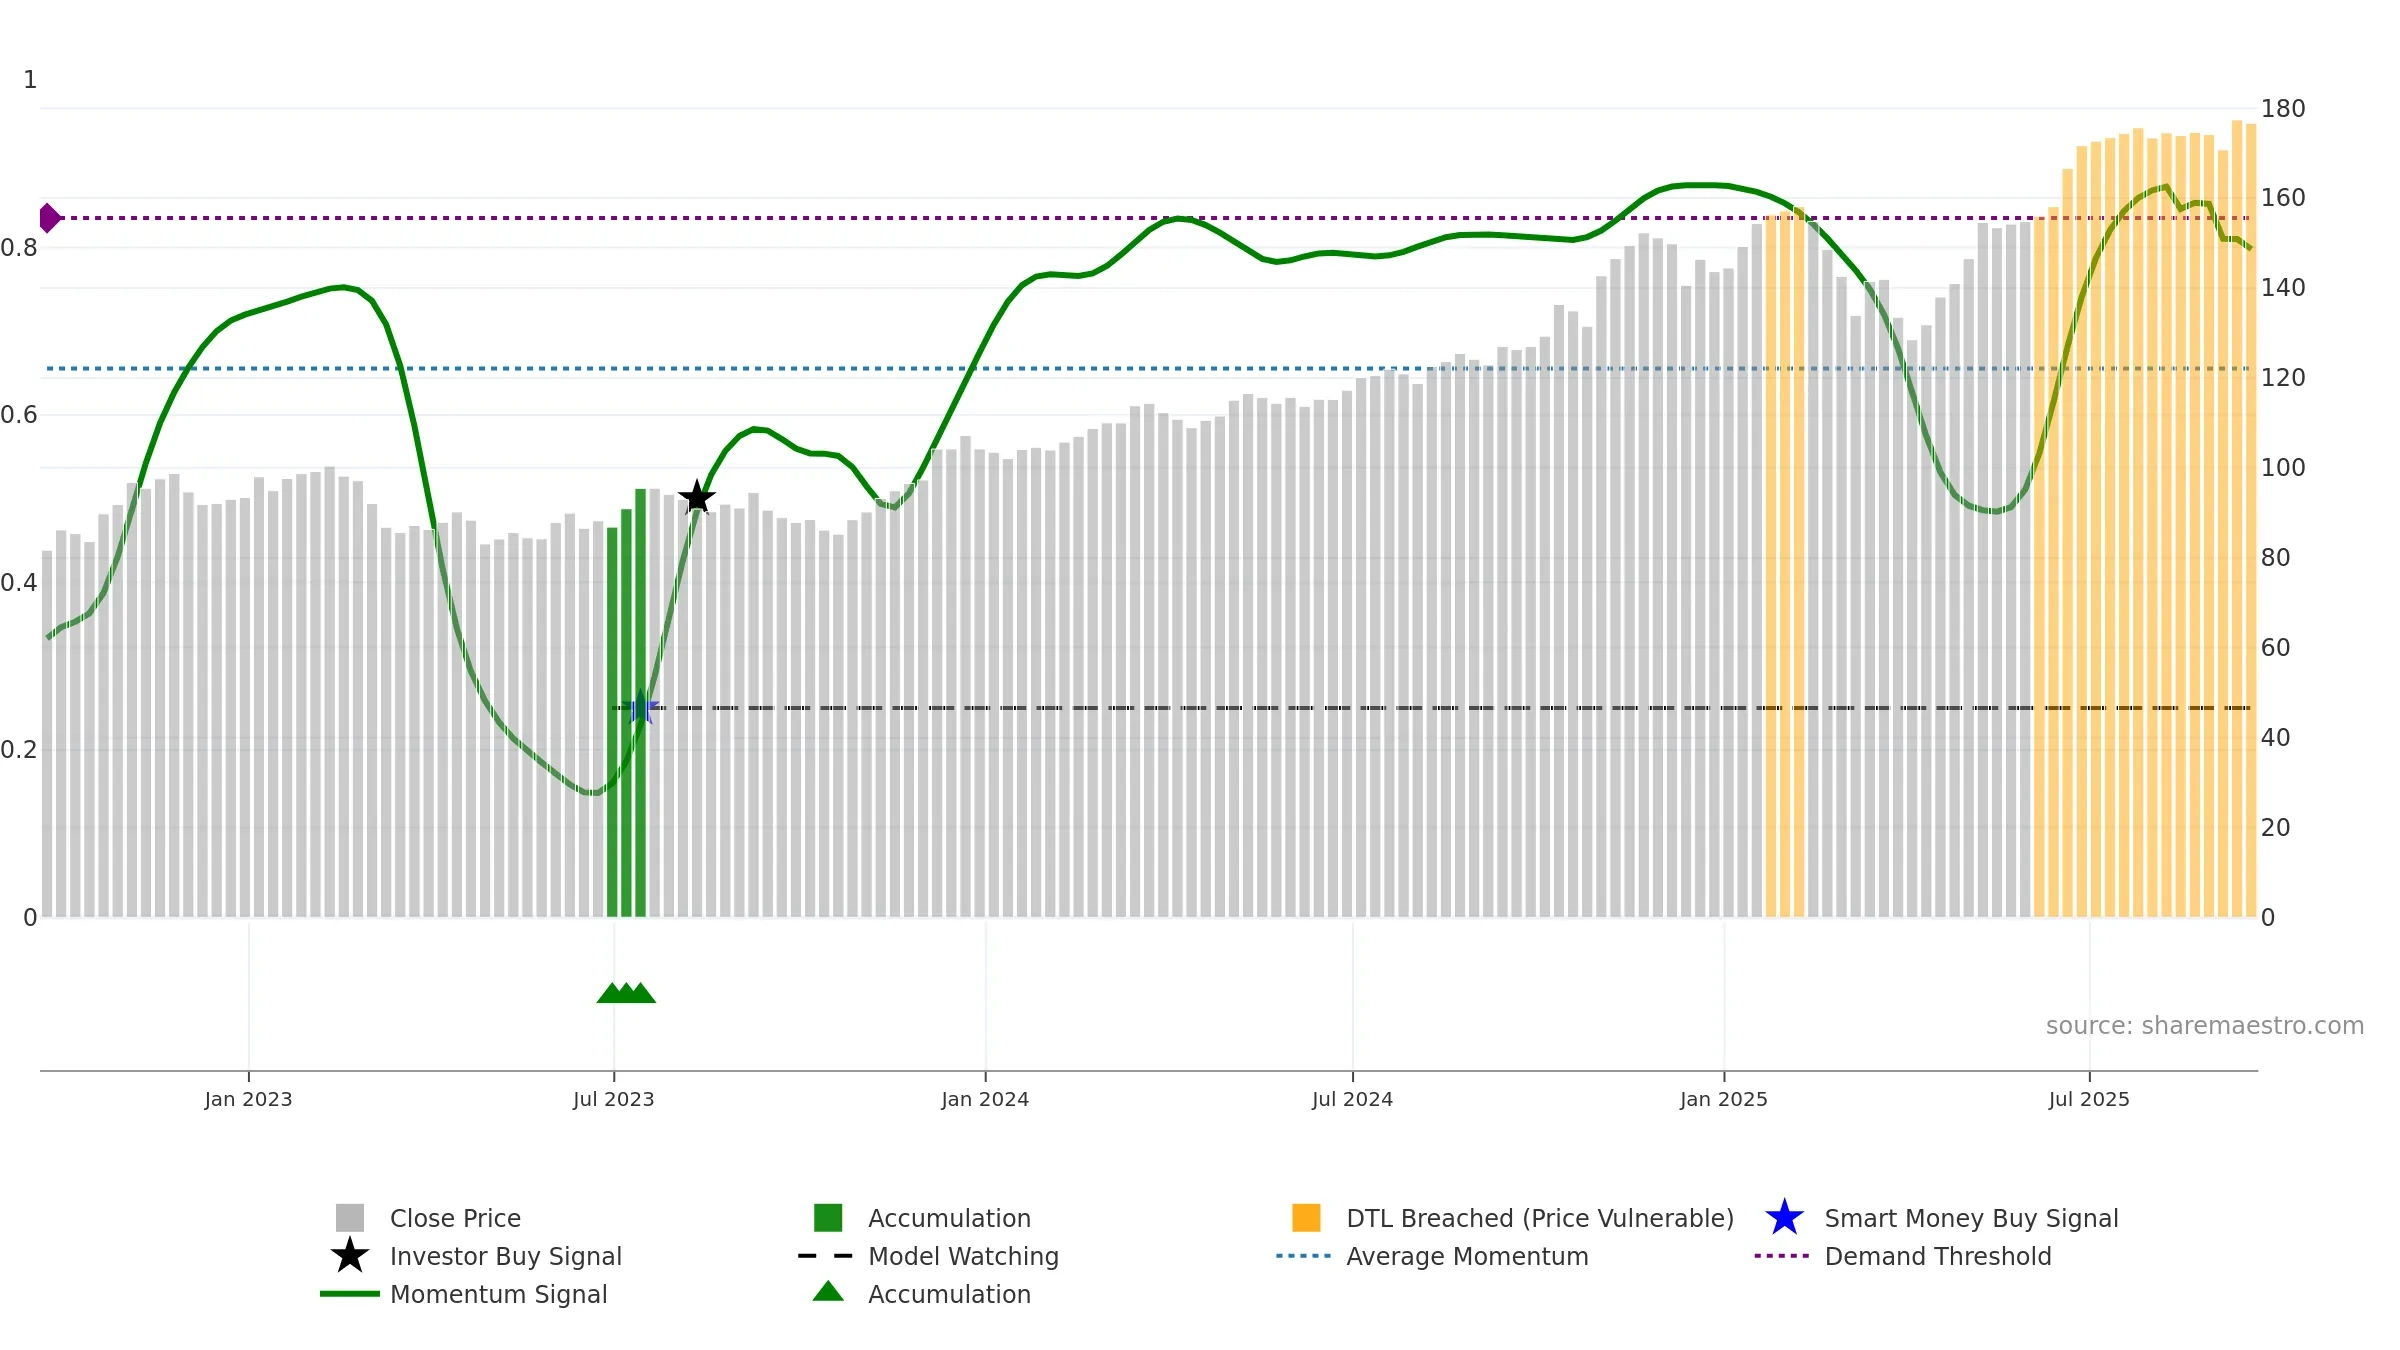
How to read this — Price slope is upward, indicating persistent buying over the window. Low weekly volatility favours steadier follow-through. Volume trend diverges from price — watch for fatigue or rotation. Returns are positively correlated with volume — strength tends to arrive on higher activity. Accumulation weeks: 1; distribution weeks: 3. Price-level slope and return-drift differ — moves have been uneven week to week. Distance to baseline is narrowing — reverting closer to its fair-value track. Constructive MA stack supports the up-drift; pullbacks may find support at the 8–13 week region. Fresh short-term crossover improves near-term tone. Price holds above key averages, indicating constructive participation.
Up-slope supports buying interest; pullbacks may be contained if activity stays firm. Because liquidity isn’t confirming, prefer evidence of fresh demand before chasing moves.
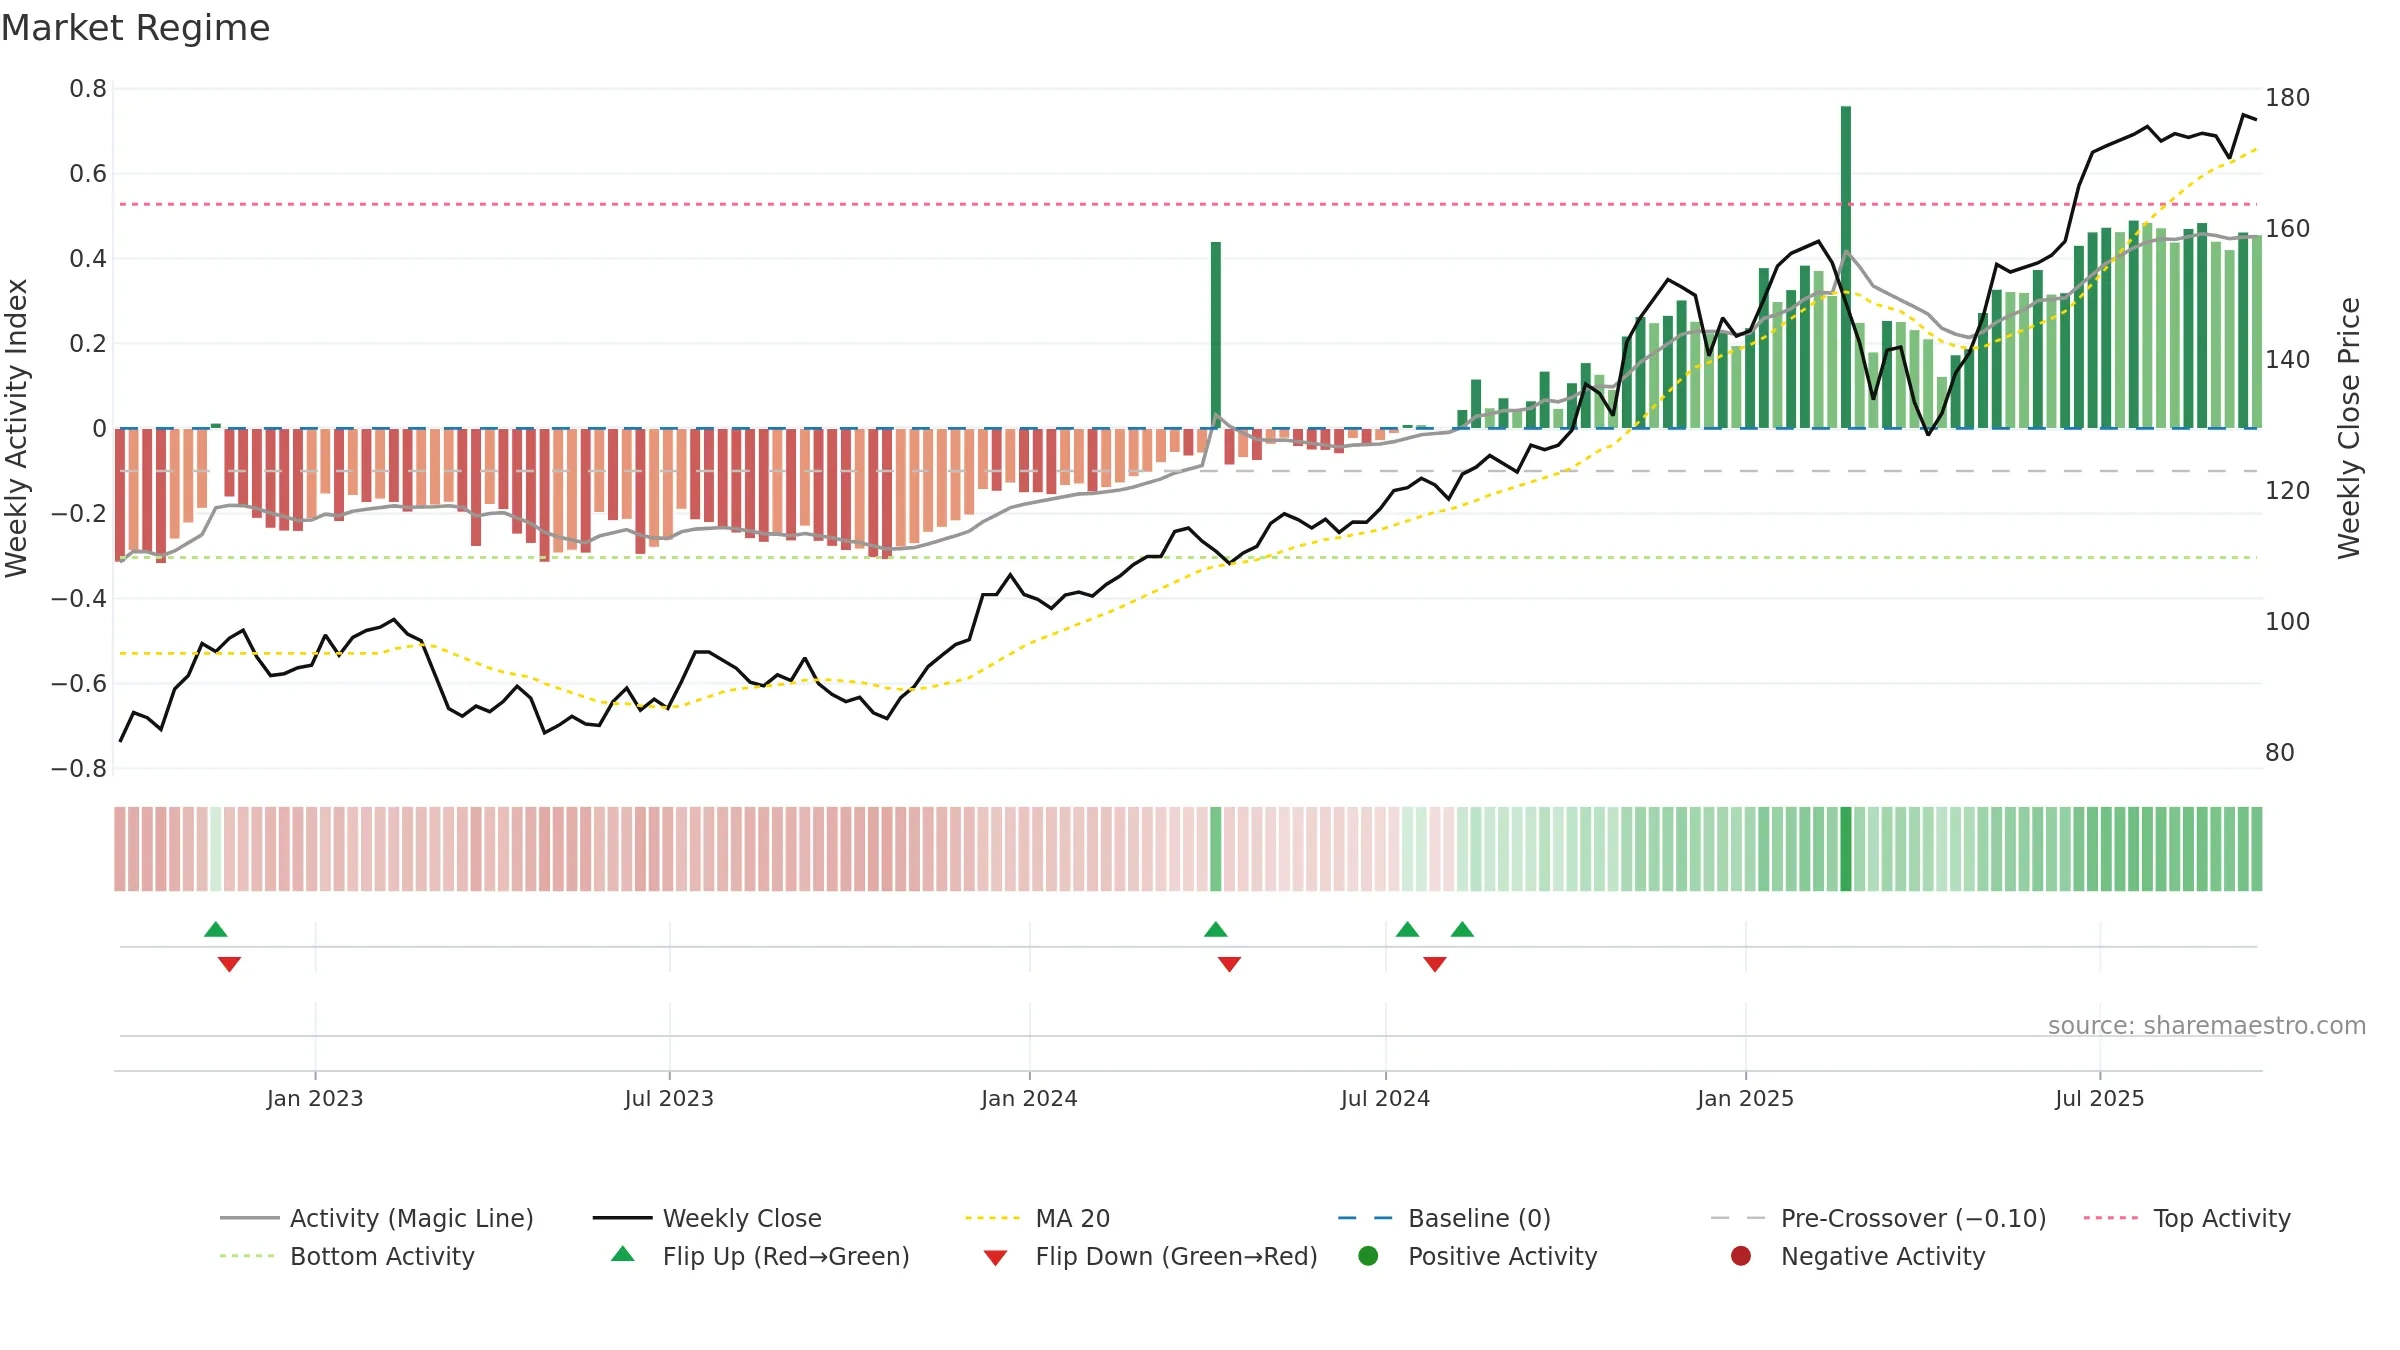
Gauge maps the trend signal to a 0–100 scale.
How to read this — Neutral levels indicate a balance between buyers and sellers. A falling gauge warns of momentum fatigue. Deceleration reduces the odds of persistence.
Mixed backdrop; confirmation from price action is helpful.
Conclusion
Neutral setup. ★★★☆☆ confidence. Price window: 1. Trend: Neutral @ 79. In combination, liquidity diverges from price.
Why: Price window 1.87% over 8w. Close is -0.43% below the window high. Return volatility 1.04%. Volume trend falling. Liquidity divergence with price. Accumulation 1; distribution 3. MA stack constructive. 4–8w crossover bullish. Baseline deviation 0.50% (narrowing). Momentum neutral and falling. Acceleration decelerating. Gauge volatility normal.
Tip: Most metrics also include a hover tooltip where they appear in the report.