Kromek Group plc
KMK LSE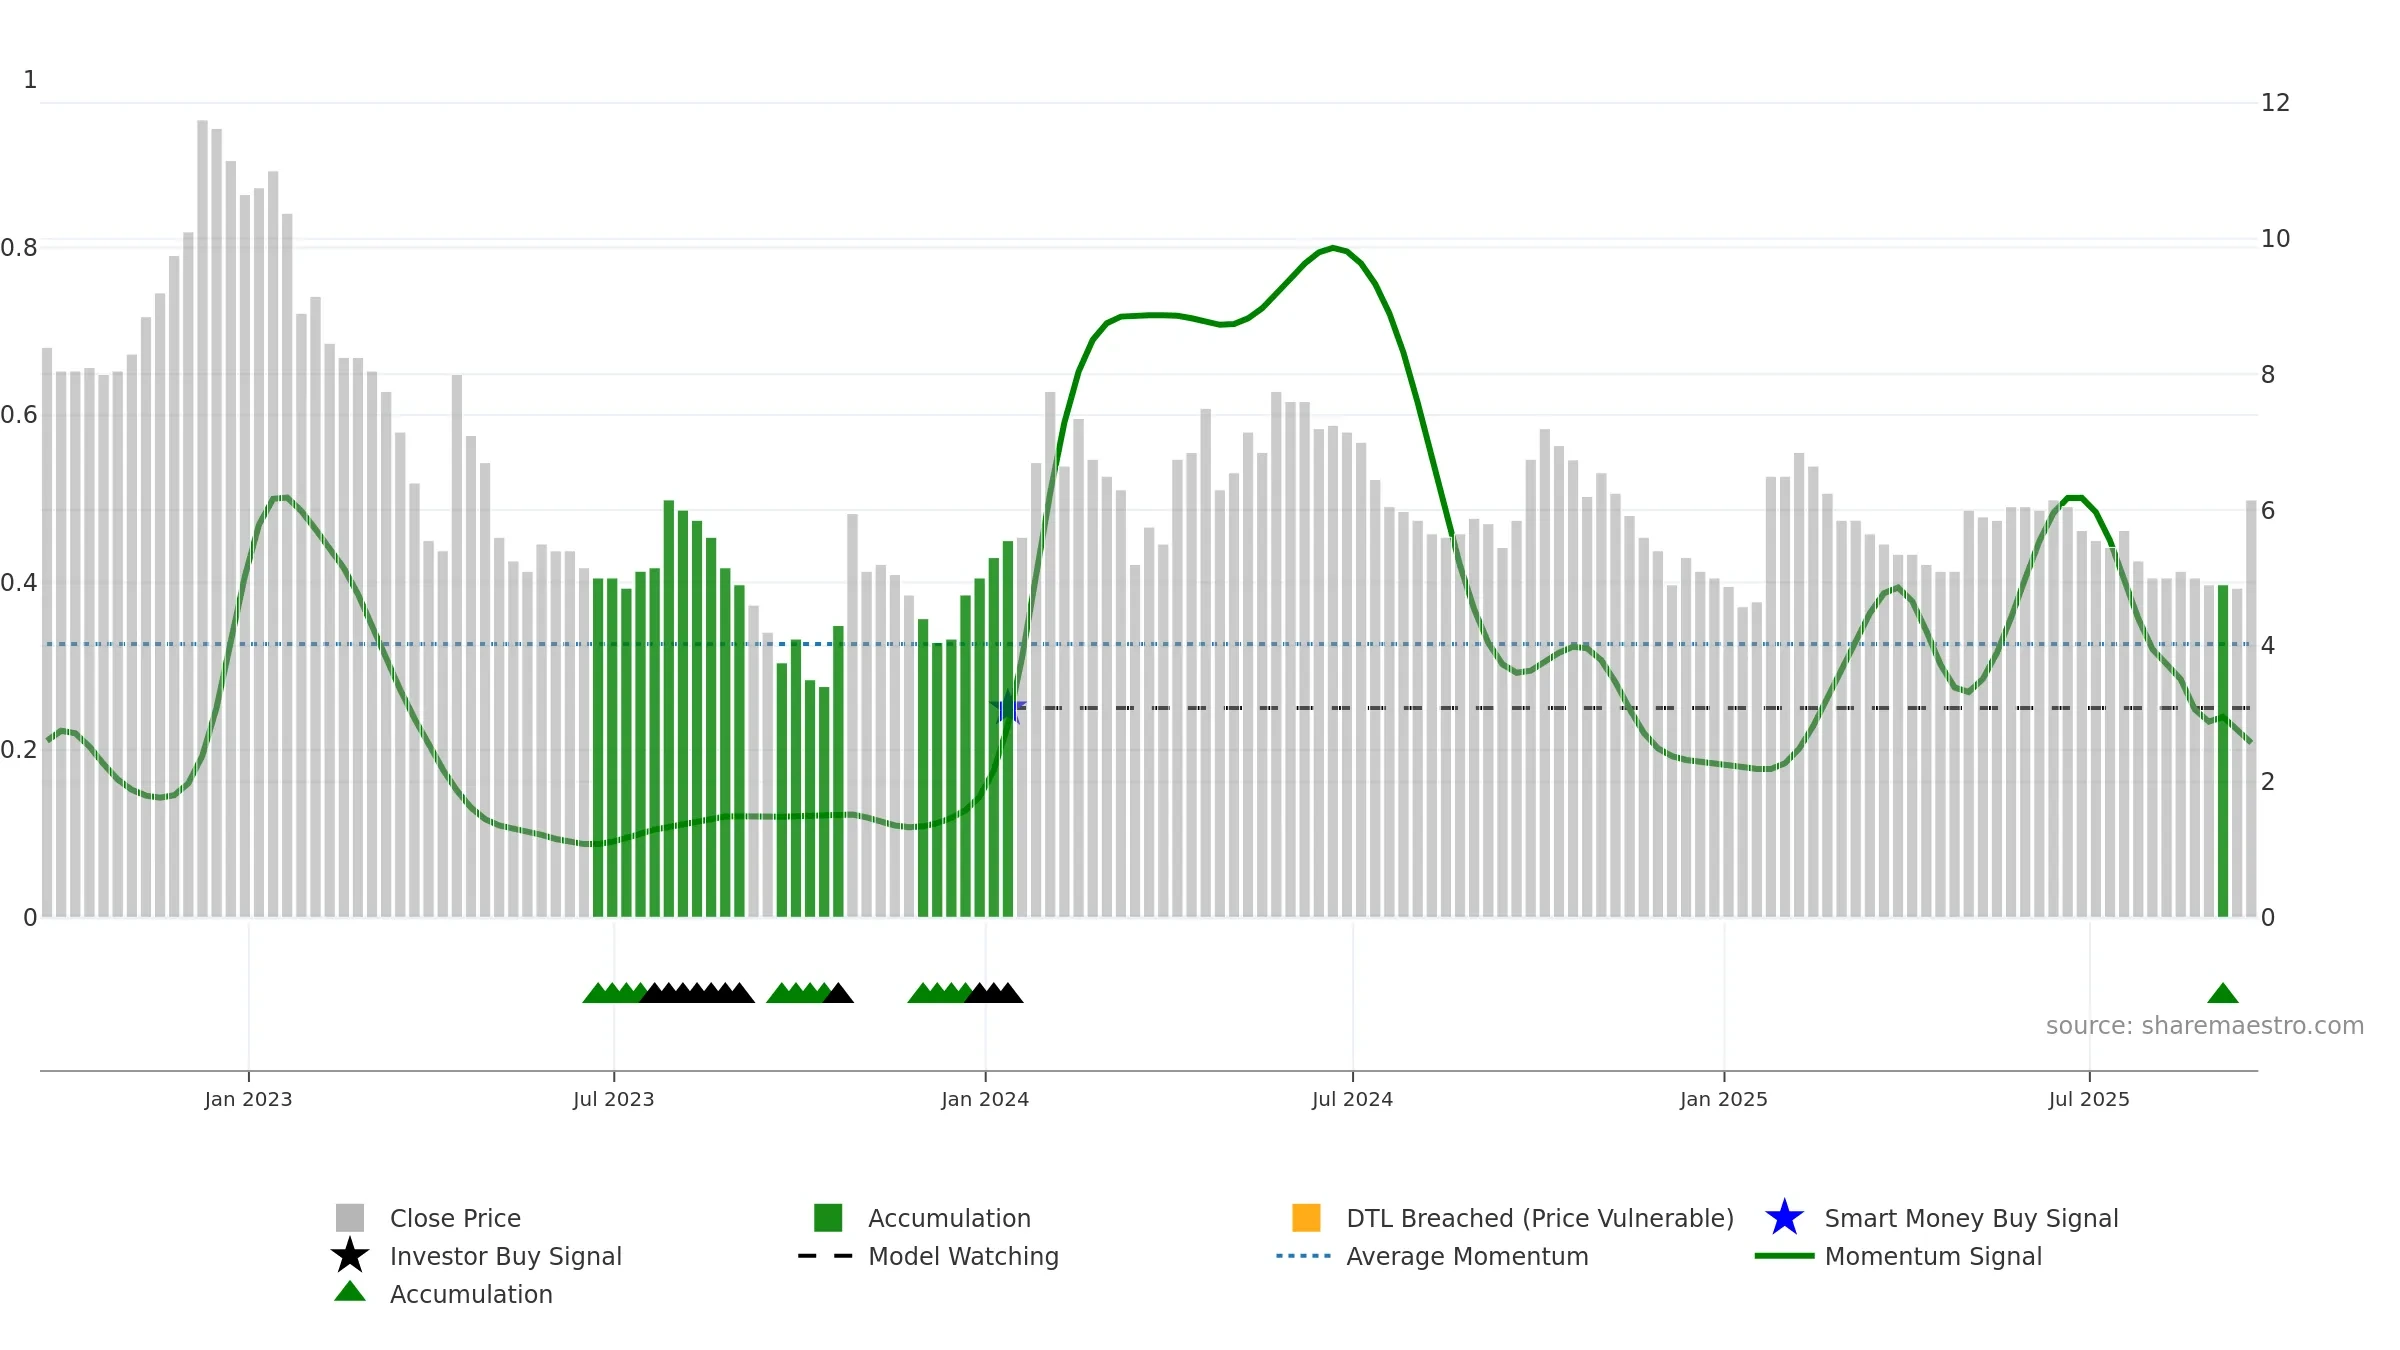
Weekly Report
Kromek Group plc closed at 6.1500 (3.36% WoW) . Data window ends Fri, 19 Sep 2025.
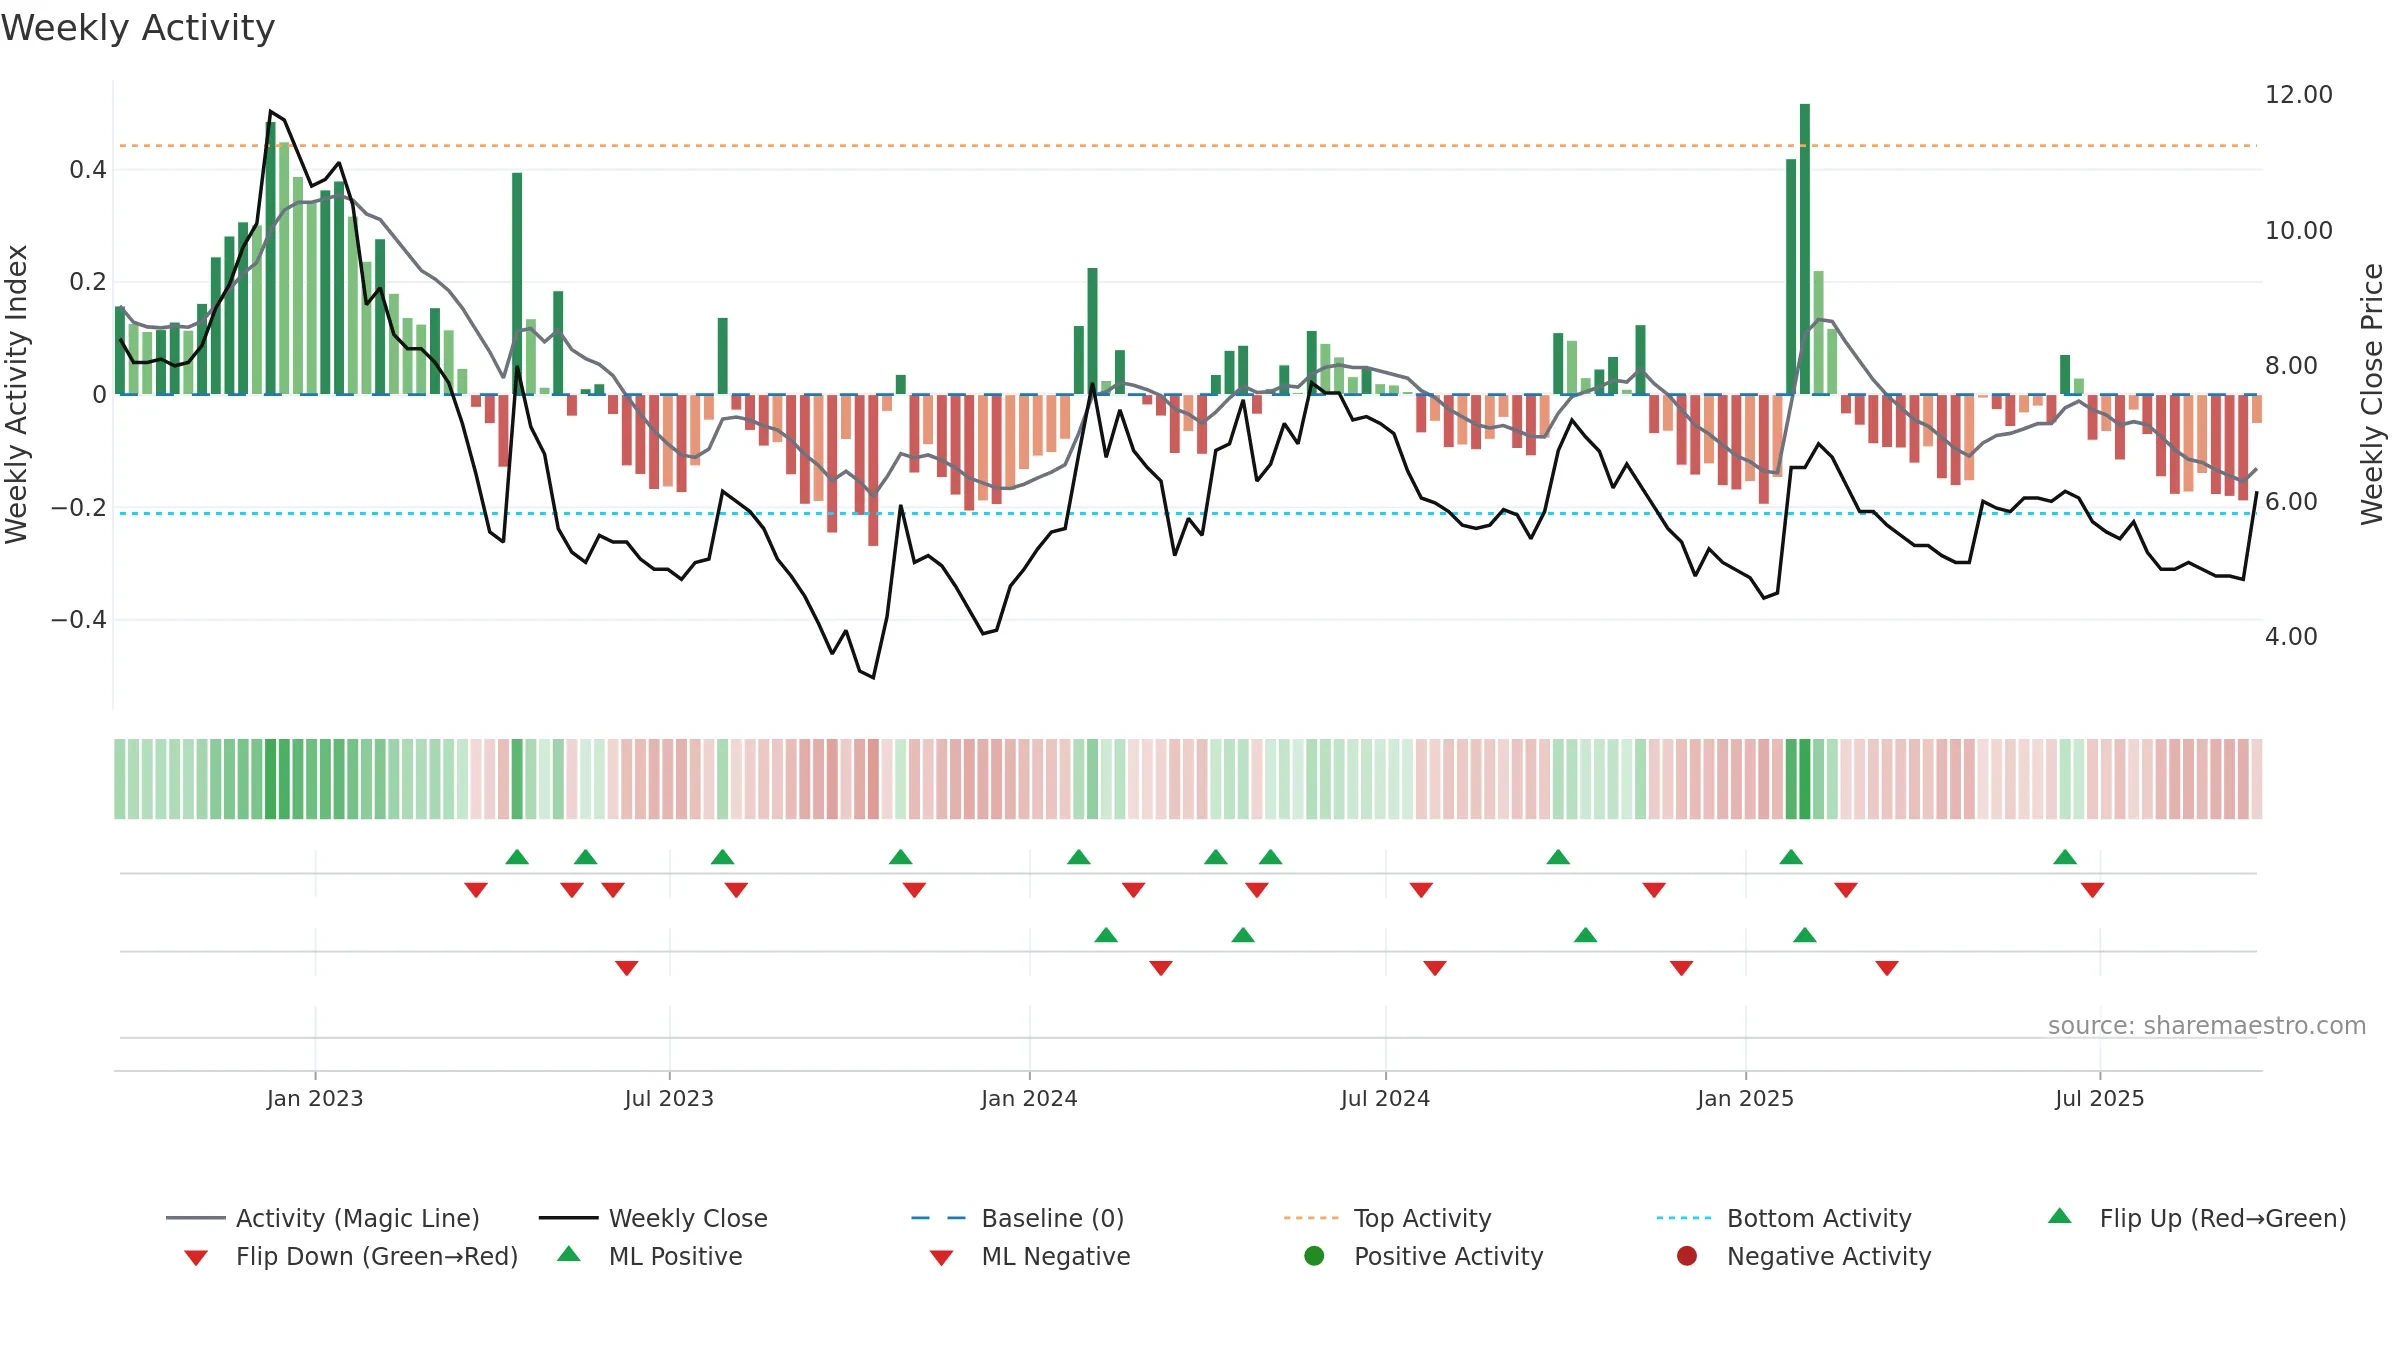
How to read this — Price slope is upward, indicating persistent buying over the window. Volume trend diverges from price — watch for fatigue or rotation. Fresh short-term crossover improves near-term tone. Price holds above key averages, indicating constructive participation.
Up-slope supports buying interest; pullbacks may be contained if activity stays firm. Because liquidity isn’t confirming, prefer evidence of fresh demand before chasing moves.
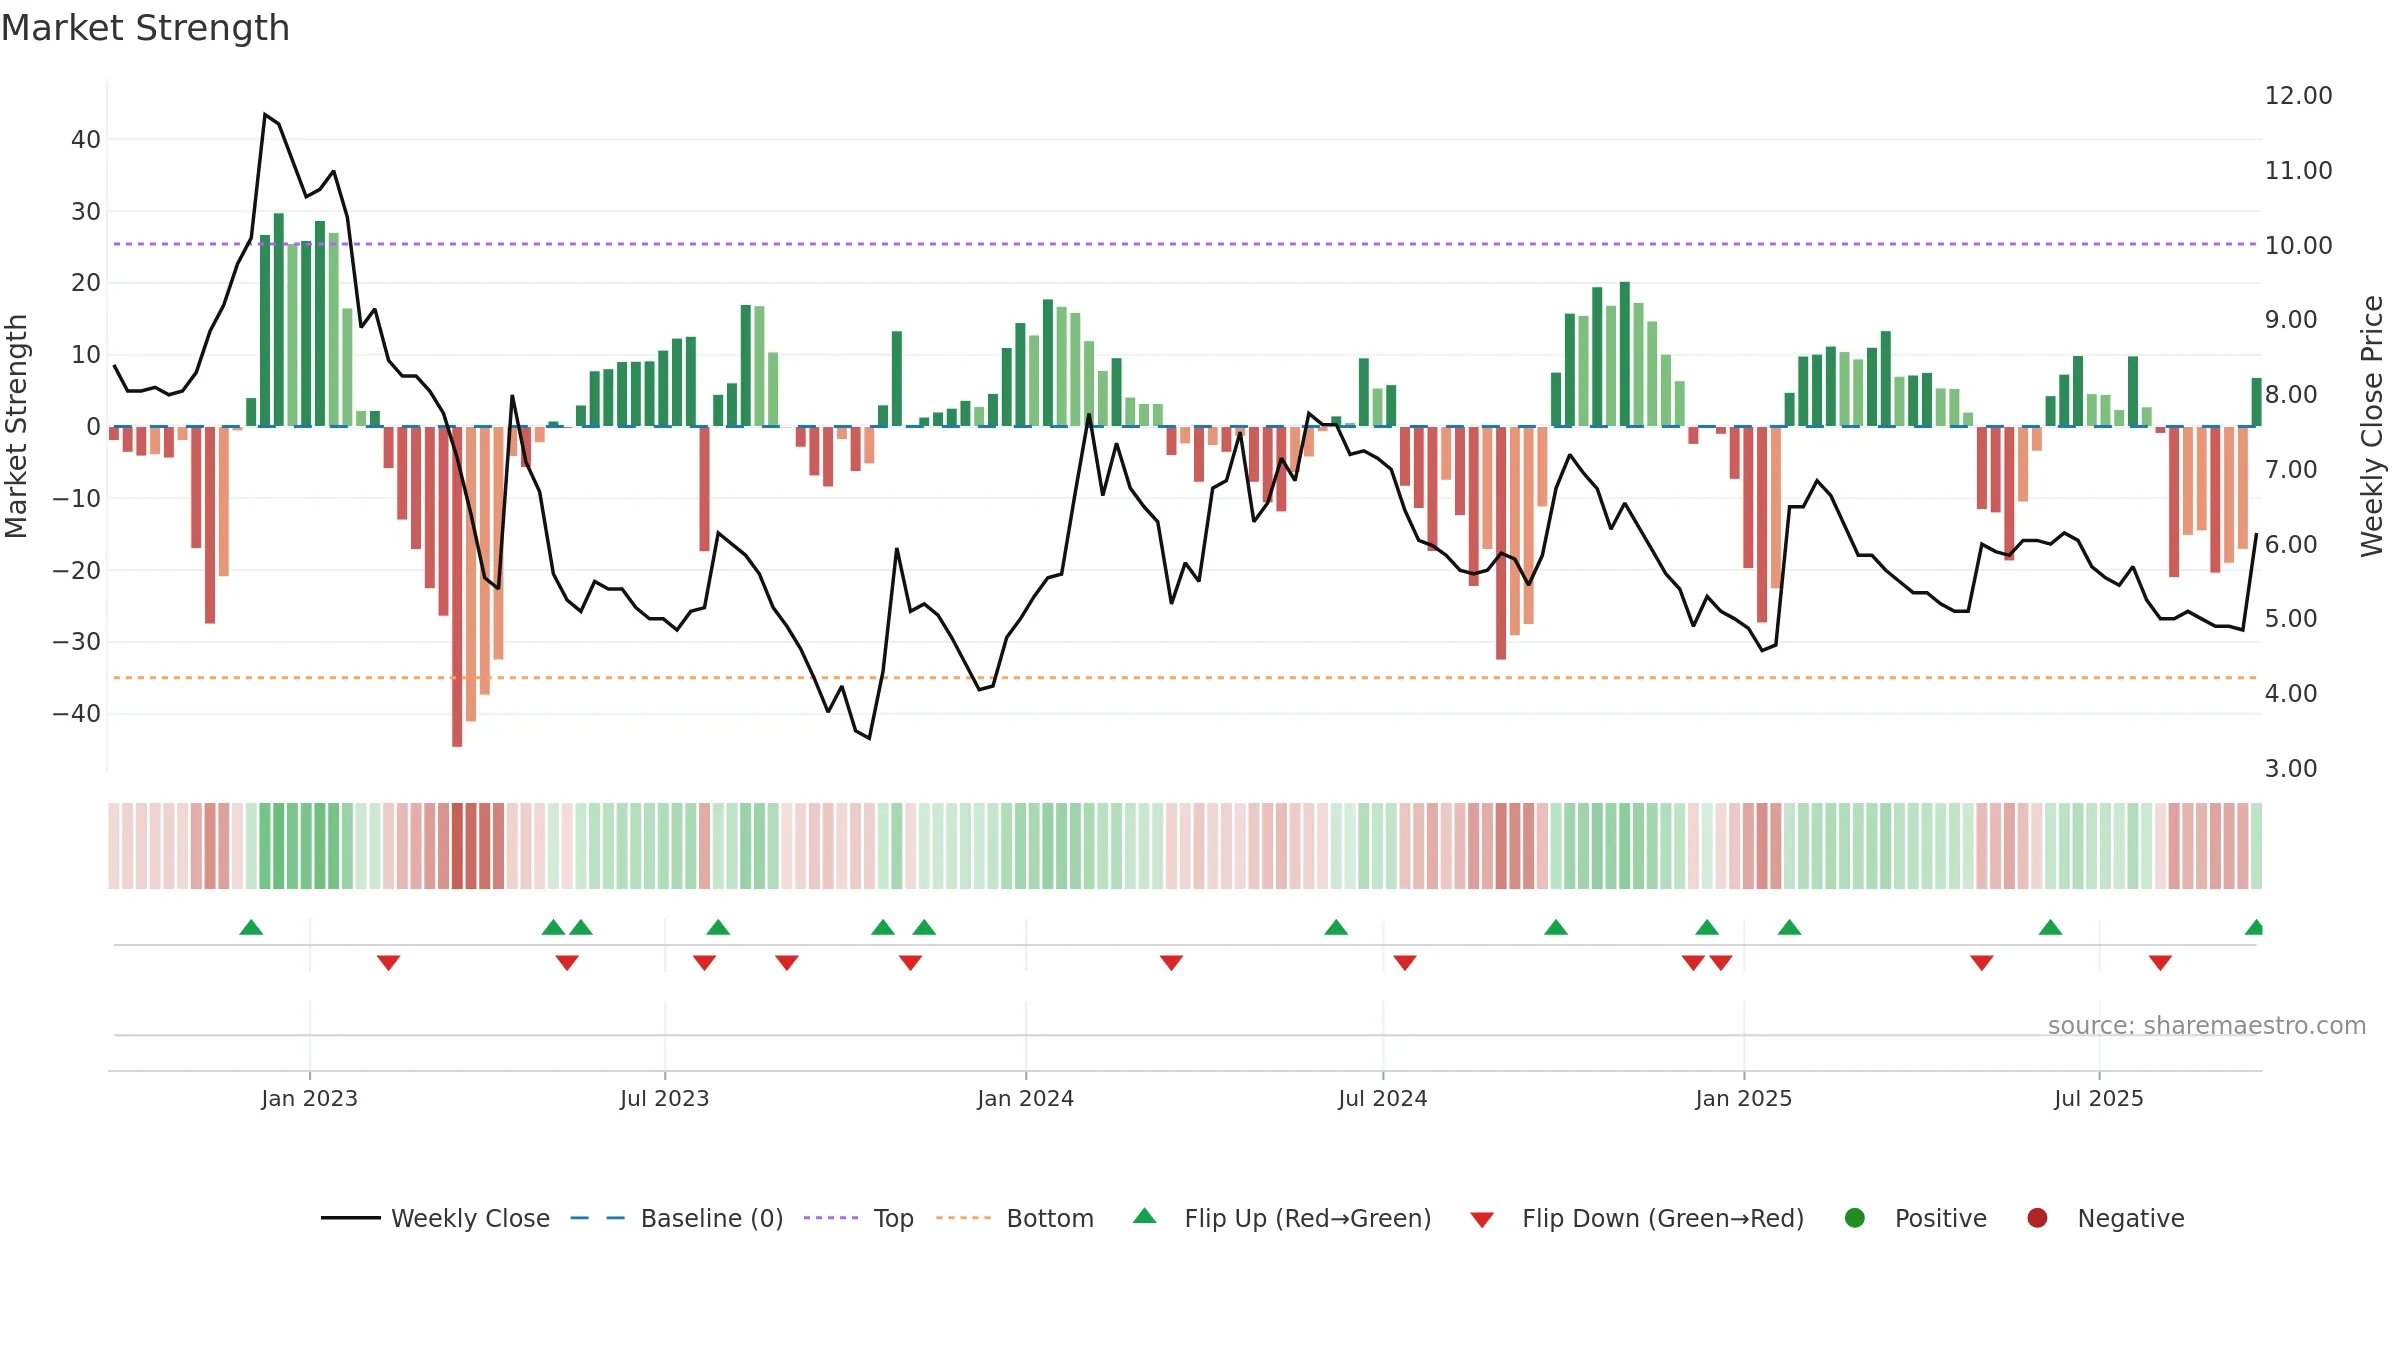
Gauge maps the trend signal to a 0–100 scale.
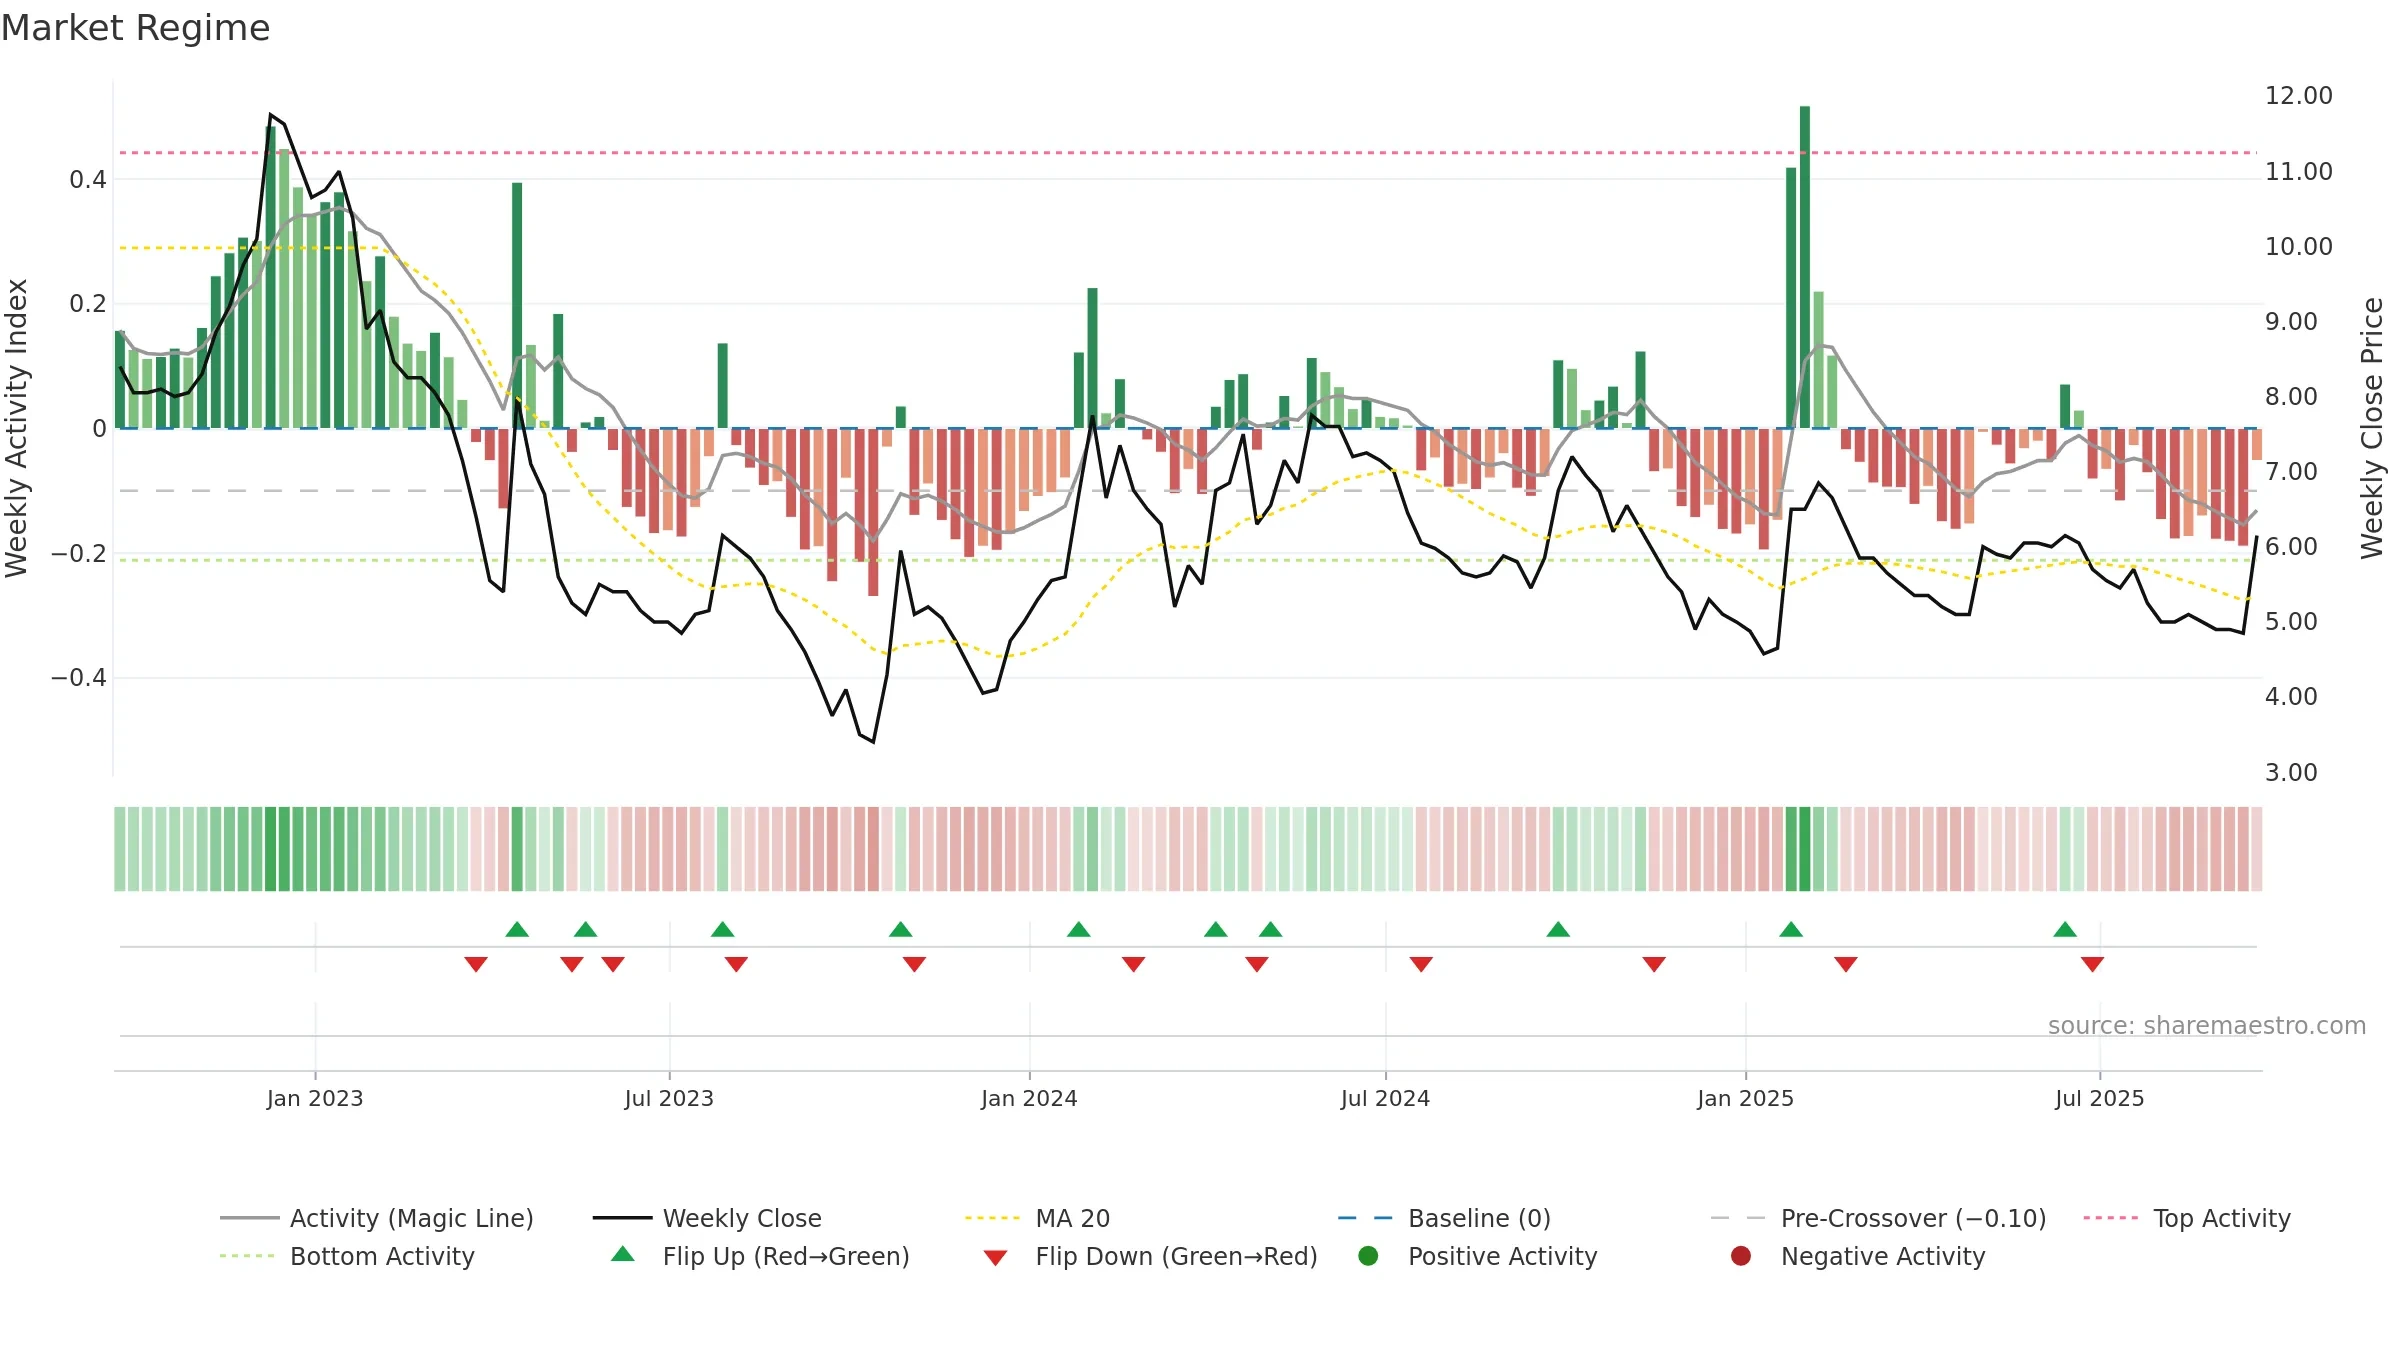
How to read this — Bearish zone with falling momentum — sellers in control.
Bias remains lower; rallies are suspect unless gauge reclaims 0.50/0.60.
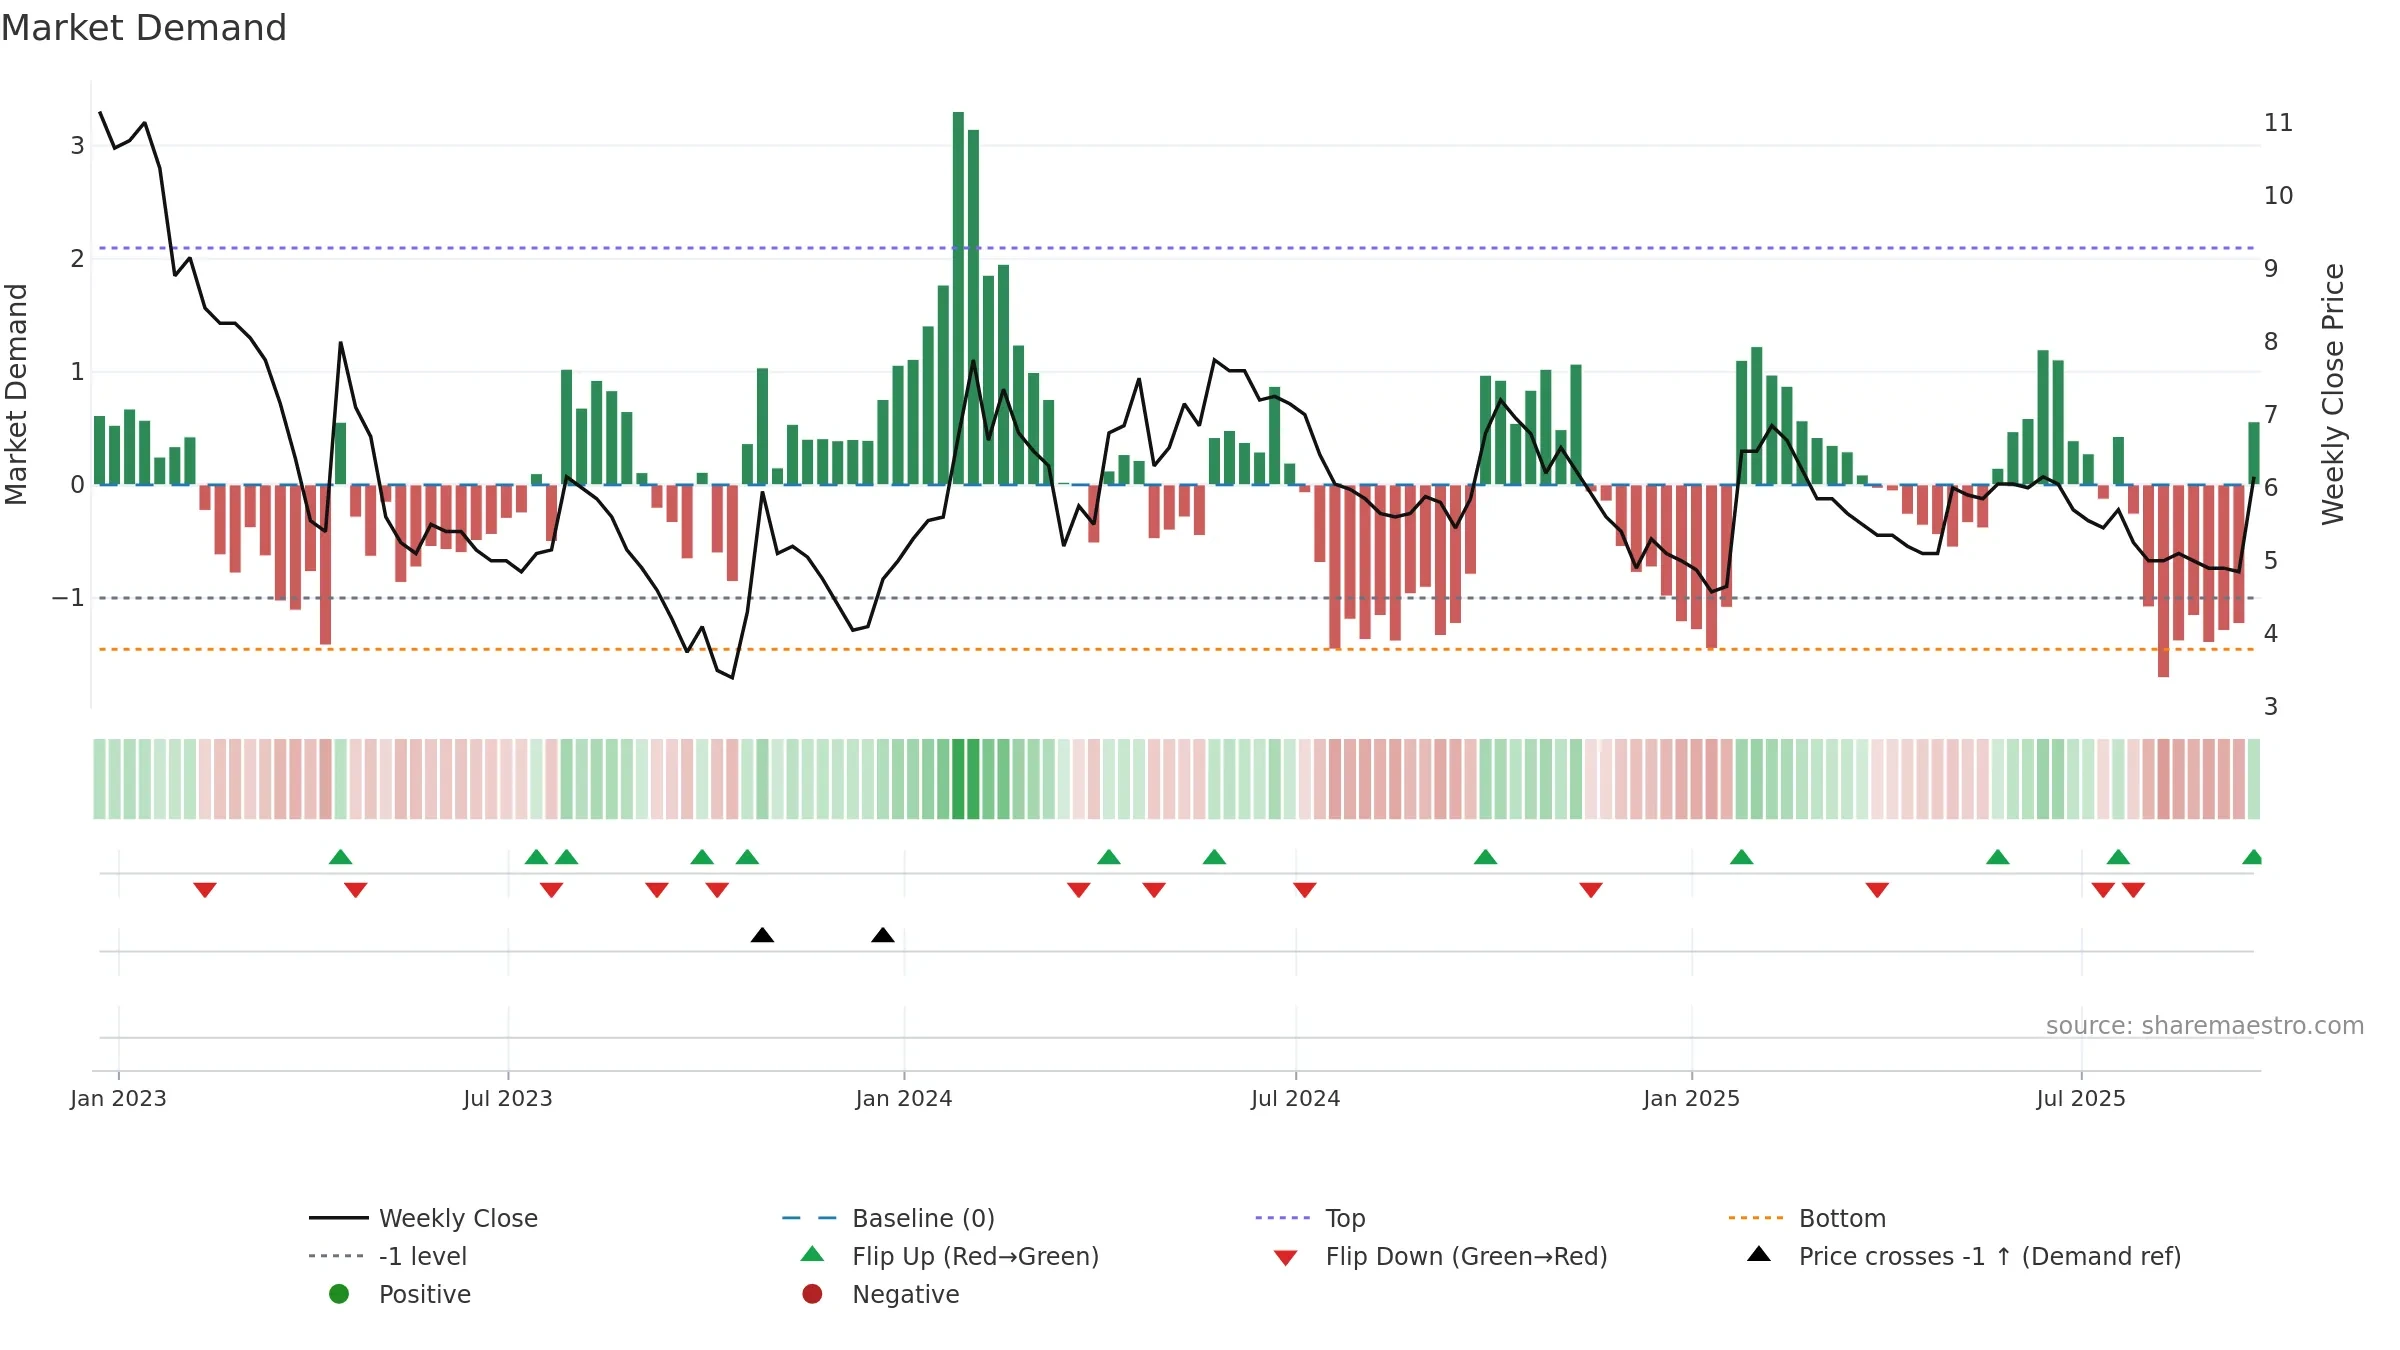
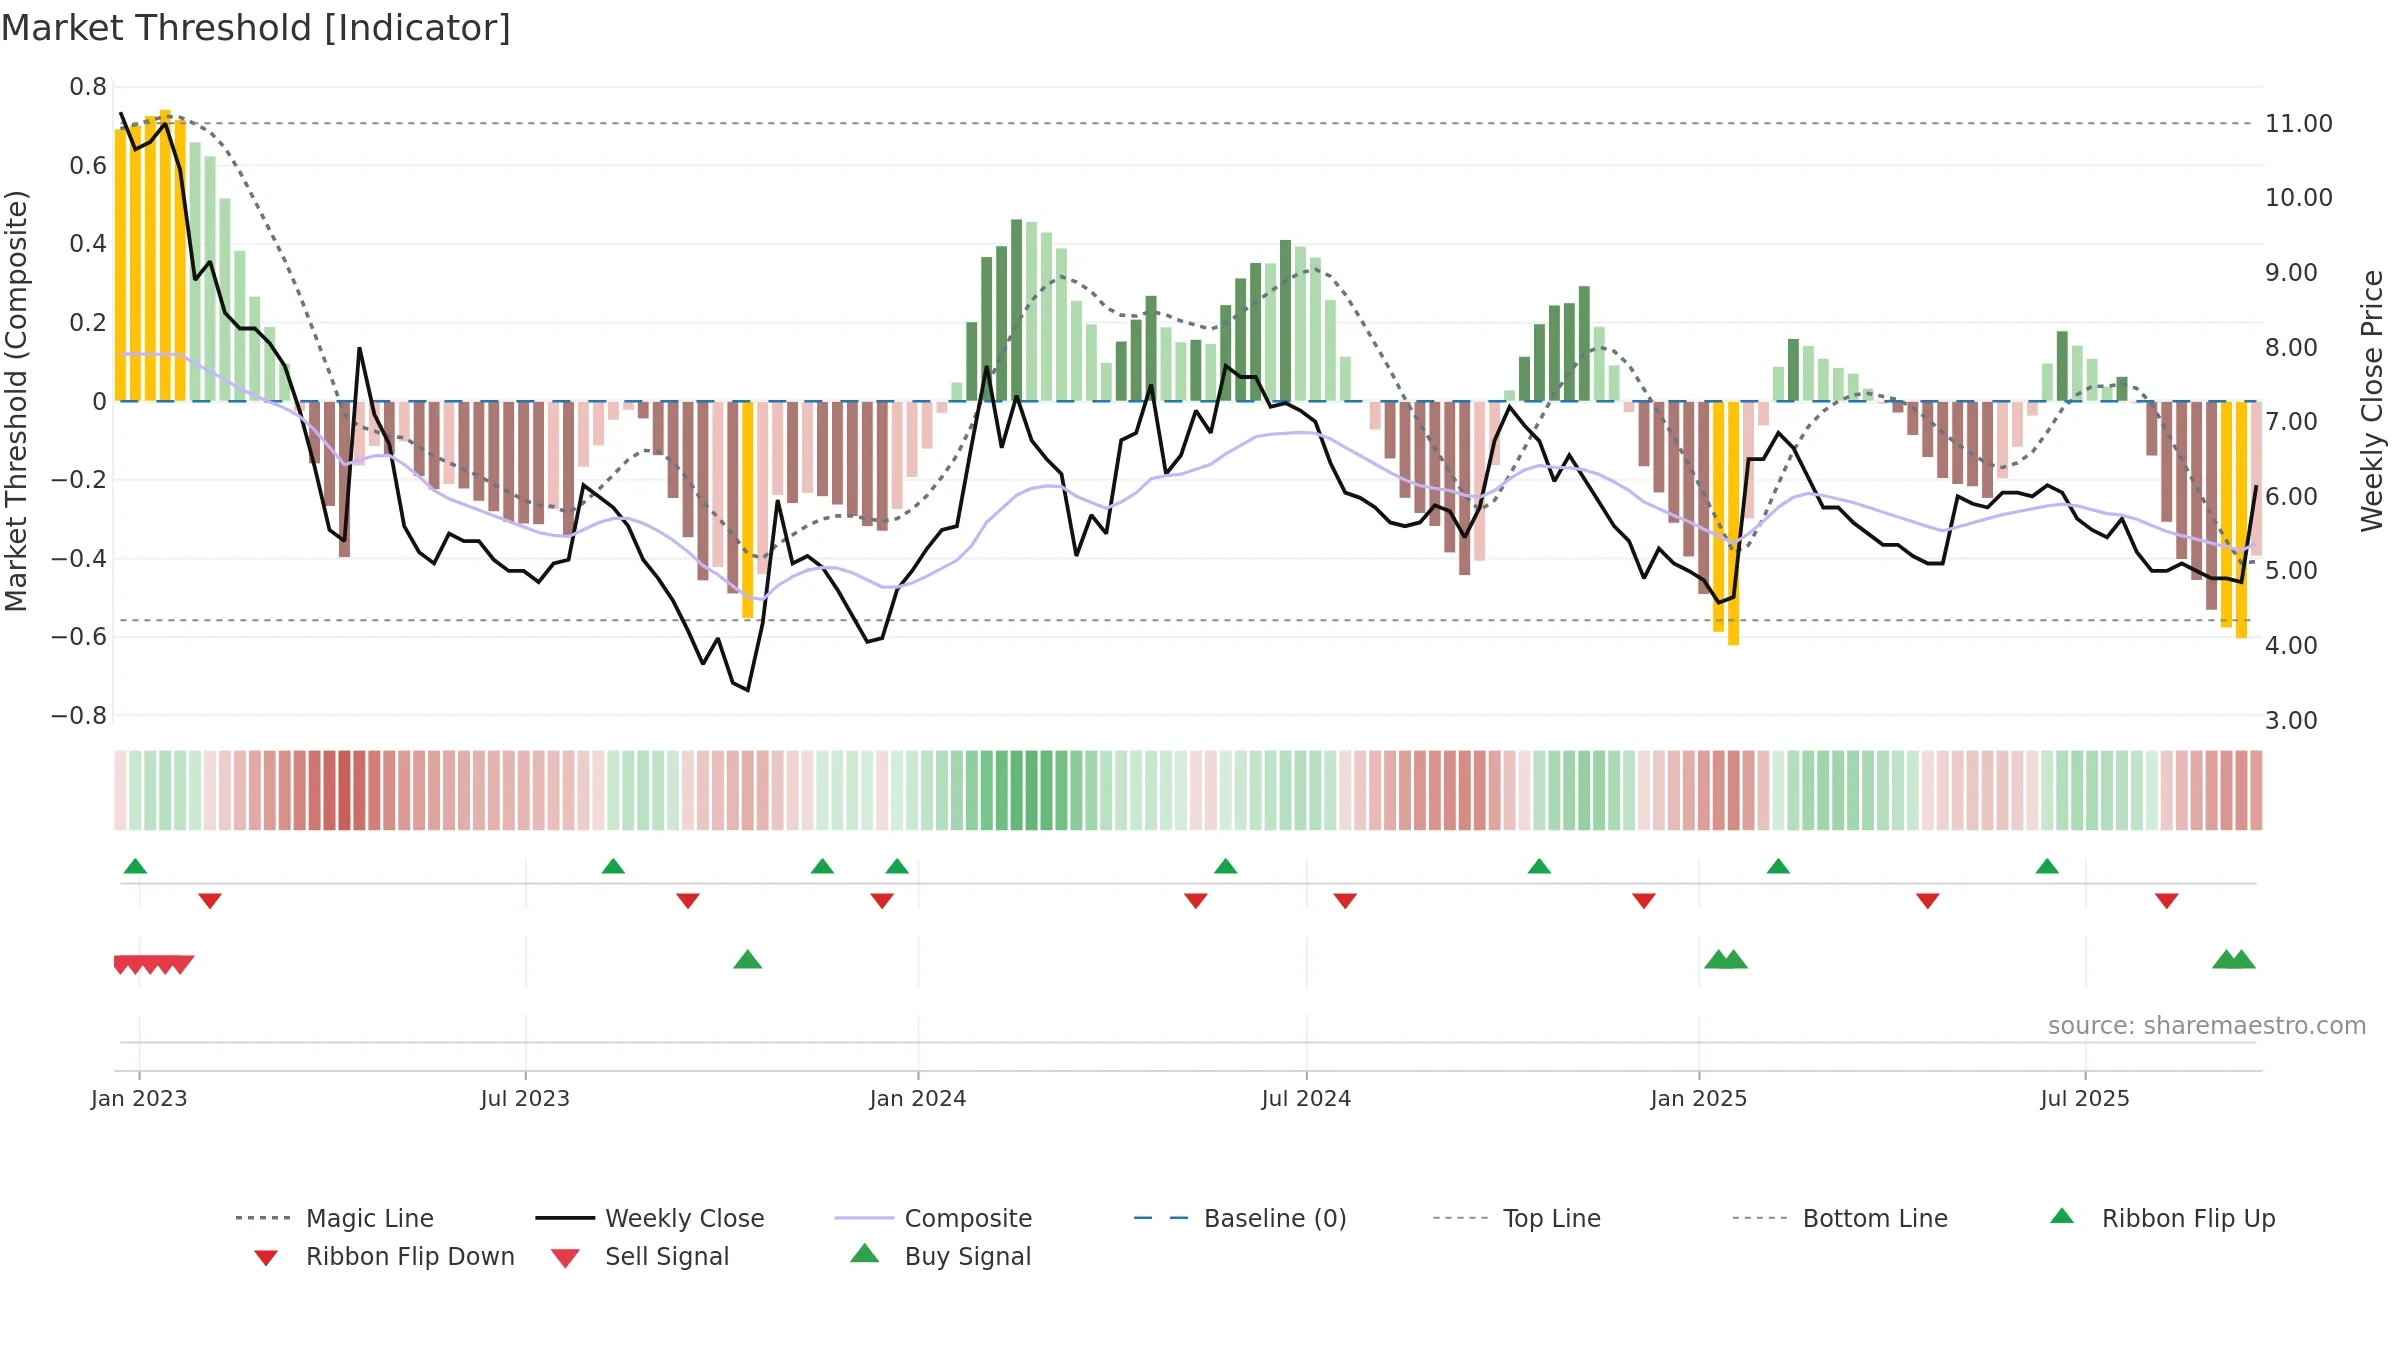
The flag is positive: favourable upside skew with supportive conditions.
Conclusion
Negative setup. ★★☆☆☆ confidence. Price window: 23. Trend: Downtrend Confirmed; gauge 20. In combination, liquidity diverges from price.
- Price holds above 8w & 26w averages
- Solid multi-week performance
- Bearish control with falling momentum
- Momentum is weak/falling
- Liquidity diverges from price
Why: Price window 23.00% over 8w. Close is 20.59% above the prior-window high. Return volatility 2.23%. Volume trend falling. Liquidity divergence with price. Trend state downtrend confirmed. Low-regime (≤0.25) upticks 1/4 (25.0%) • Distributing. 4–8w crossover bullish. Momentum bearish and falling. Valuation stance positive.
Tip: Most metrics include a hover tooltip where they appear in the report.