C3.ai, Inc.
AI NYSE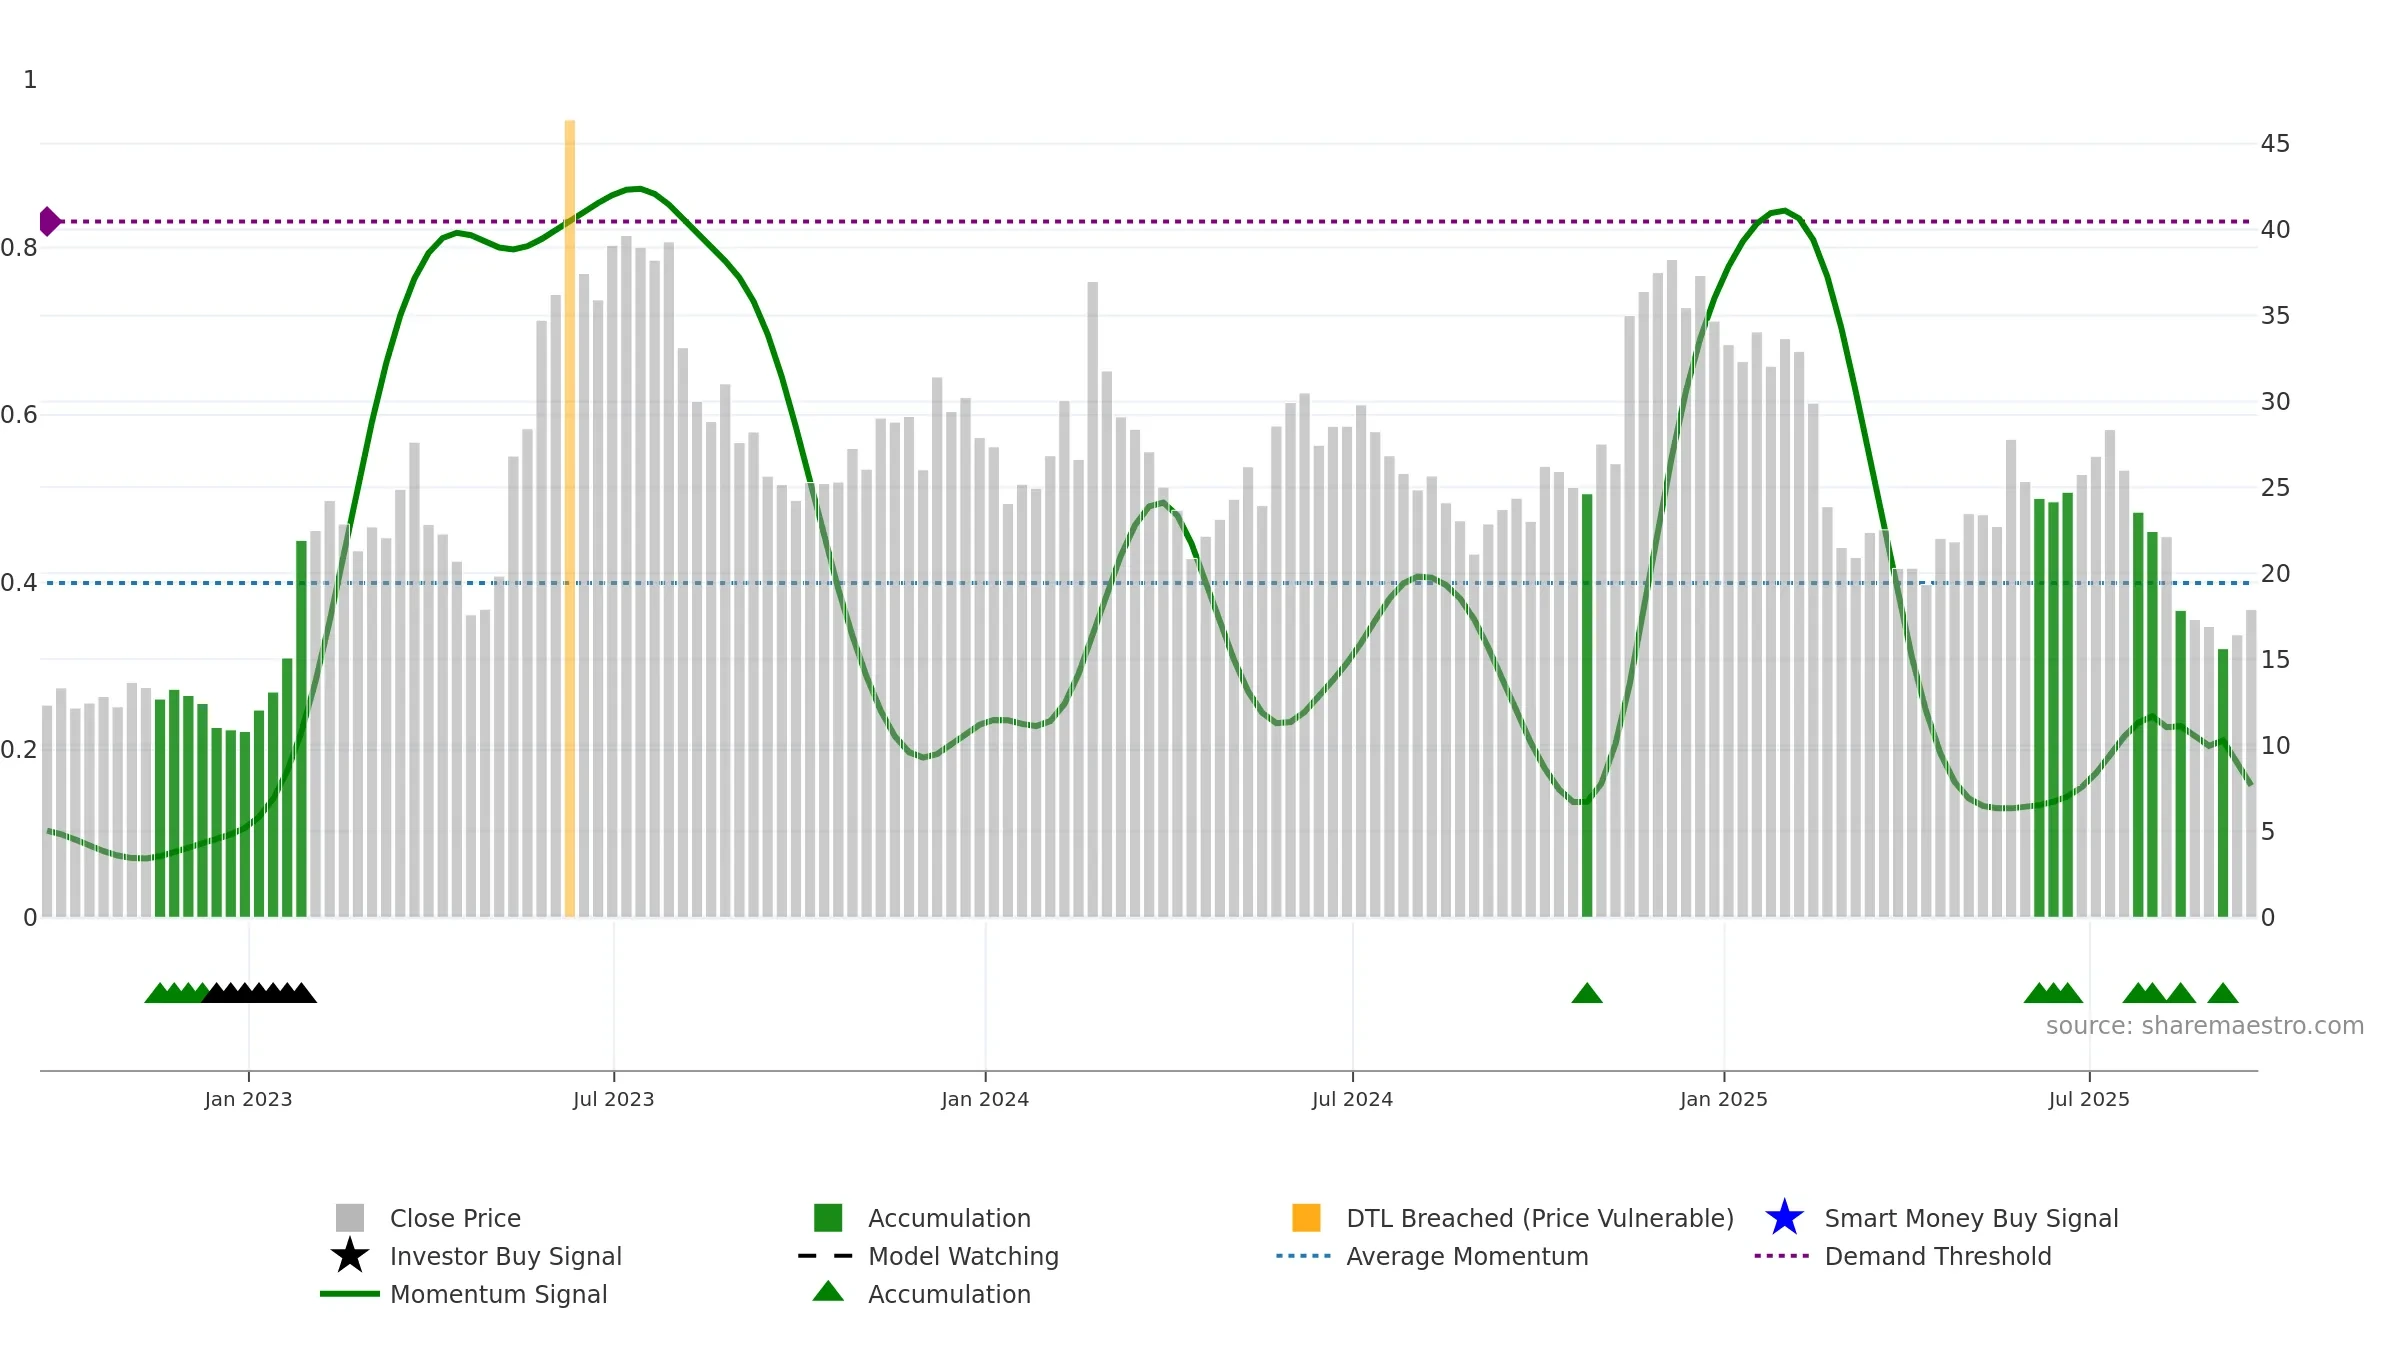
Weekly Report
C3.ai, Inc. closed at 17.9000 (-0.69% WoW) . Data window ends Fri, 19 Sep 2025.
How to read this — Price slope is downward, indicating persistent supply pressure. Low weekly volatility favours steadier follow-through. Volume trend diverges from price — watch for fatigue or rotation. Returns are positively correlated with volume — strength tends to arrive on higher activity. Weak MA stack argues for caution; rallies can fail near the 8–13 week region. Price sits below key averages, keeping pressure on the tape.
Down-slope argues for patience; rallies can fade sooner unless participation improves. Because liquidity isn’t confirming, prefer evidence of fresh demand before chasing moves.
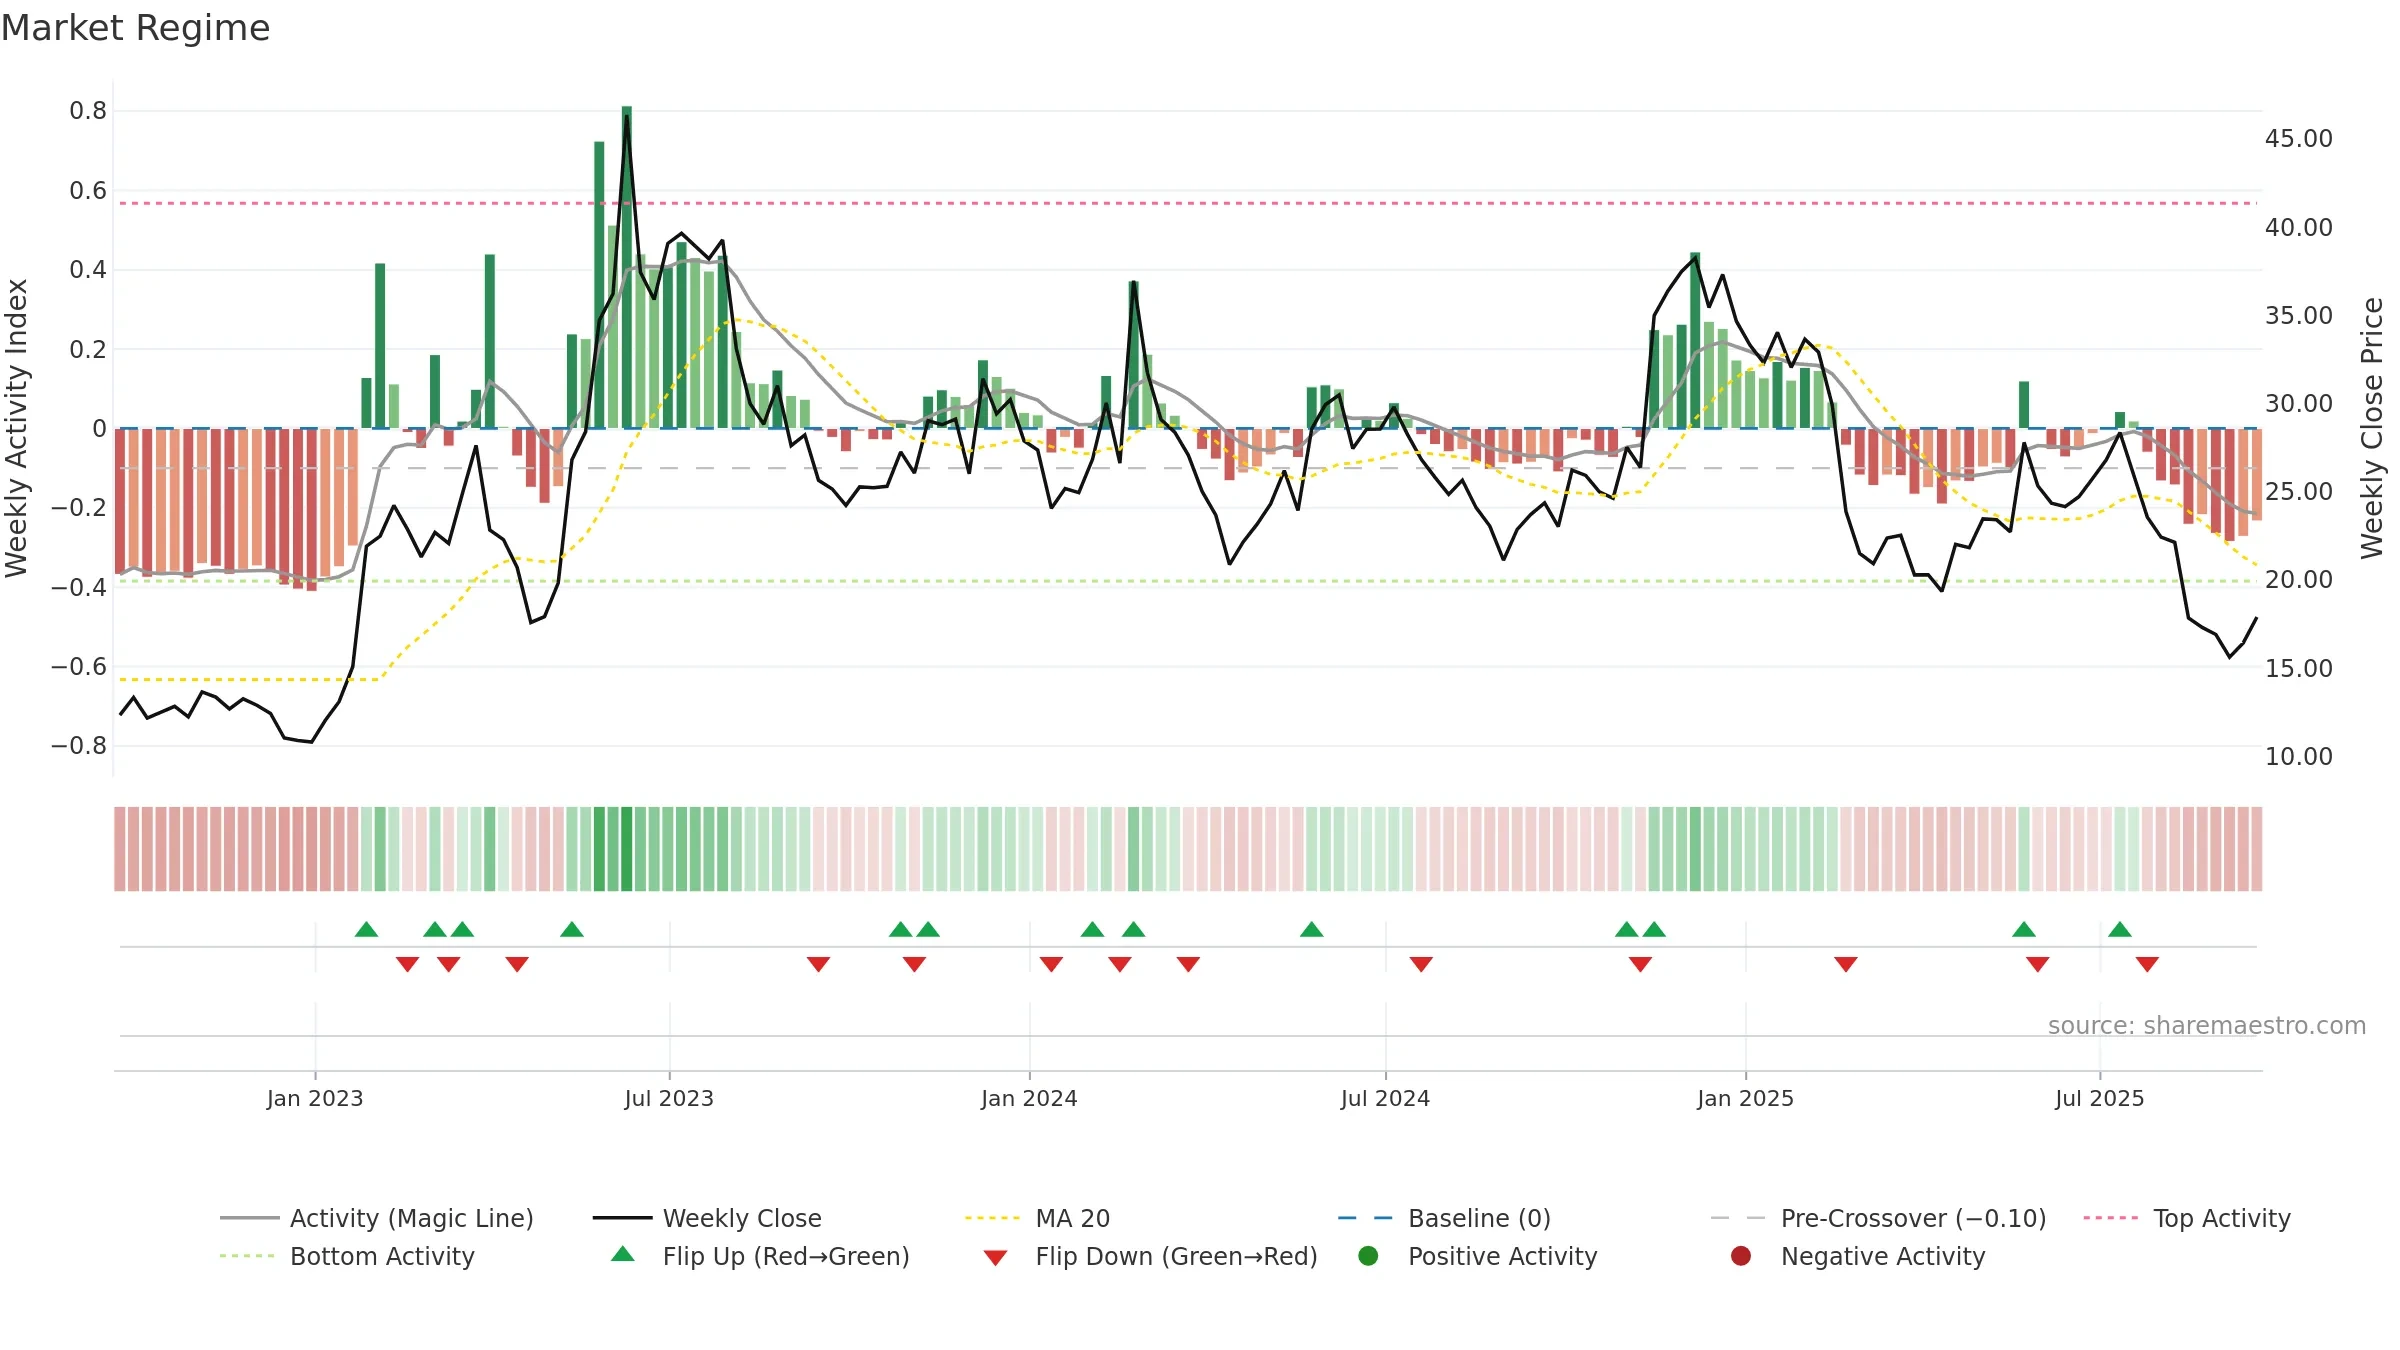
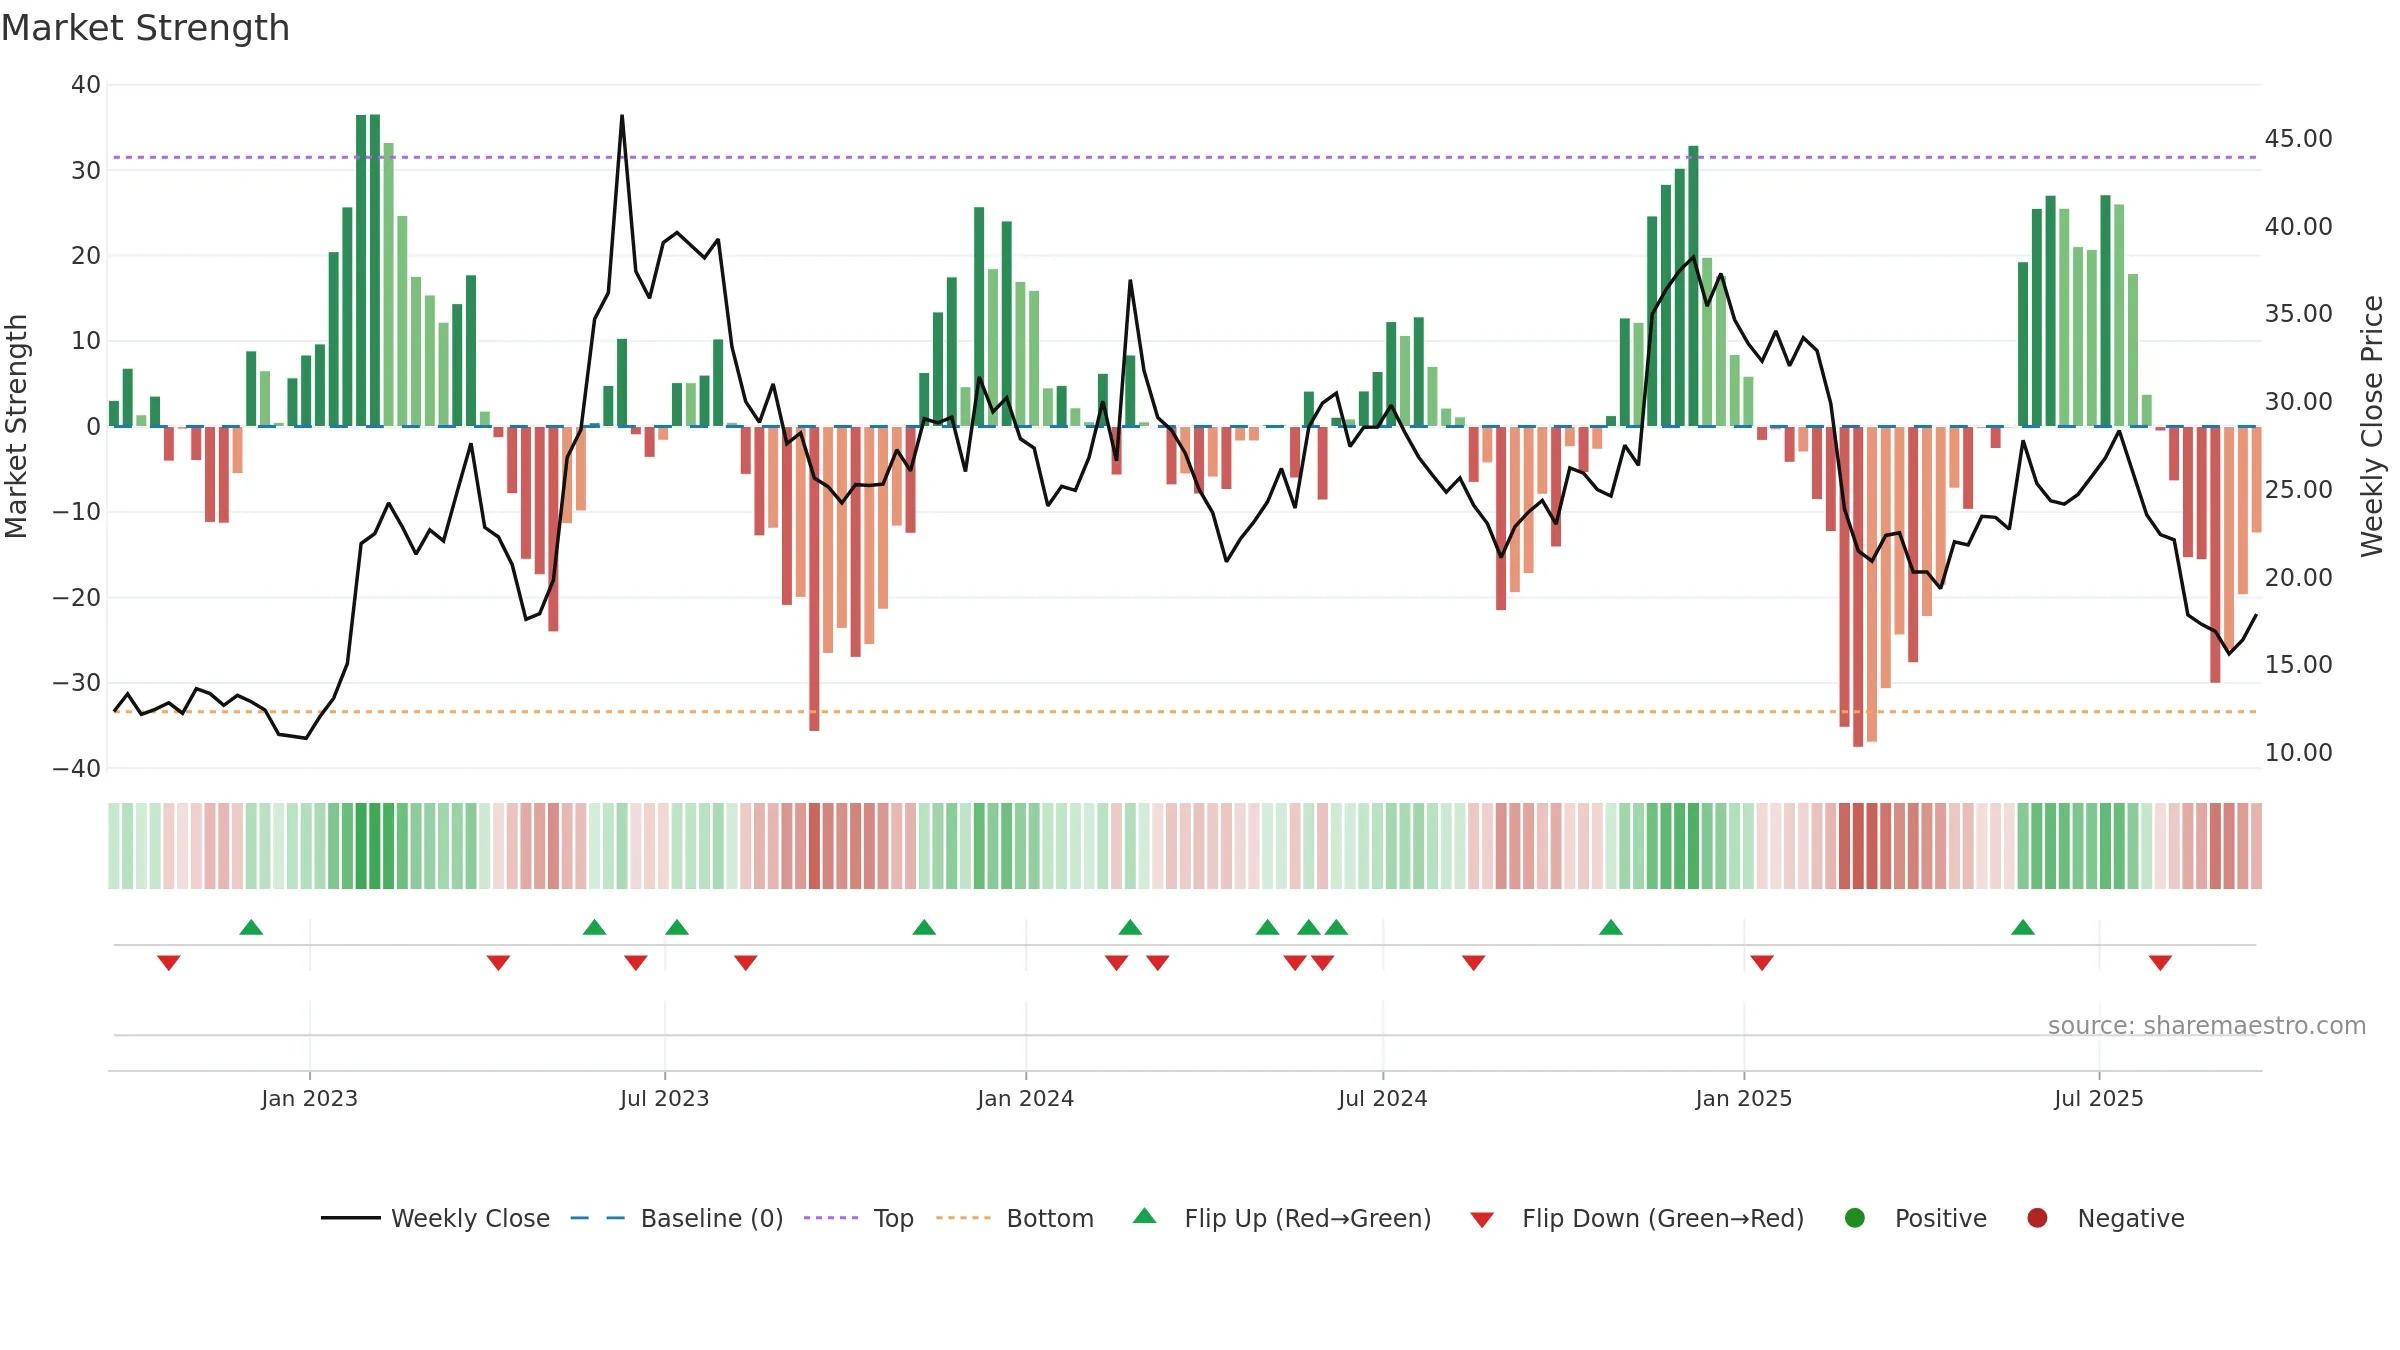
Gauge maps the trend signal to a 0–100 scale.
How to read this — Bearish zone with falling momentum — sellers in control.
Bias remains lower; rallies are suspect unless gauge reclaims 0.50/0.60.
Conclusion
Negative setup. ★☆☆☆☆ confidence. Price window: -20. Trend: Downtrend Confirmed; gauge 15. In combination, liquidity diverges from price.
- Low return volatility supports durability
- Bearish control with falling momentum
- Momentum is weak/falling
- Price is not above key averages
- Weak moving-average stack
Why: Price window -20.20% over 8w. Close is -20.20% below the prior-window high. Return volatility 1.34%. Volume trend rising. Liquidity divergence with price. Trend state downtrend confirmed. Low-regime (≤0.25) upticks 2/7 (29.0%) • Distributing. MA stack weak. Momentum bearish and falling.
Tip: Most metrics include a hover tooltip where they appear in the report.