Rush Street Interactive, Inc.
RSI NYSE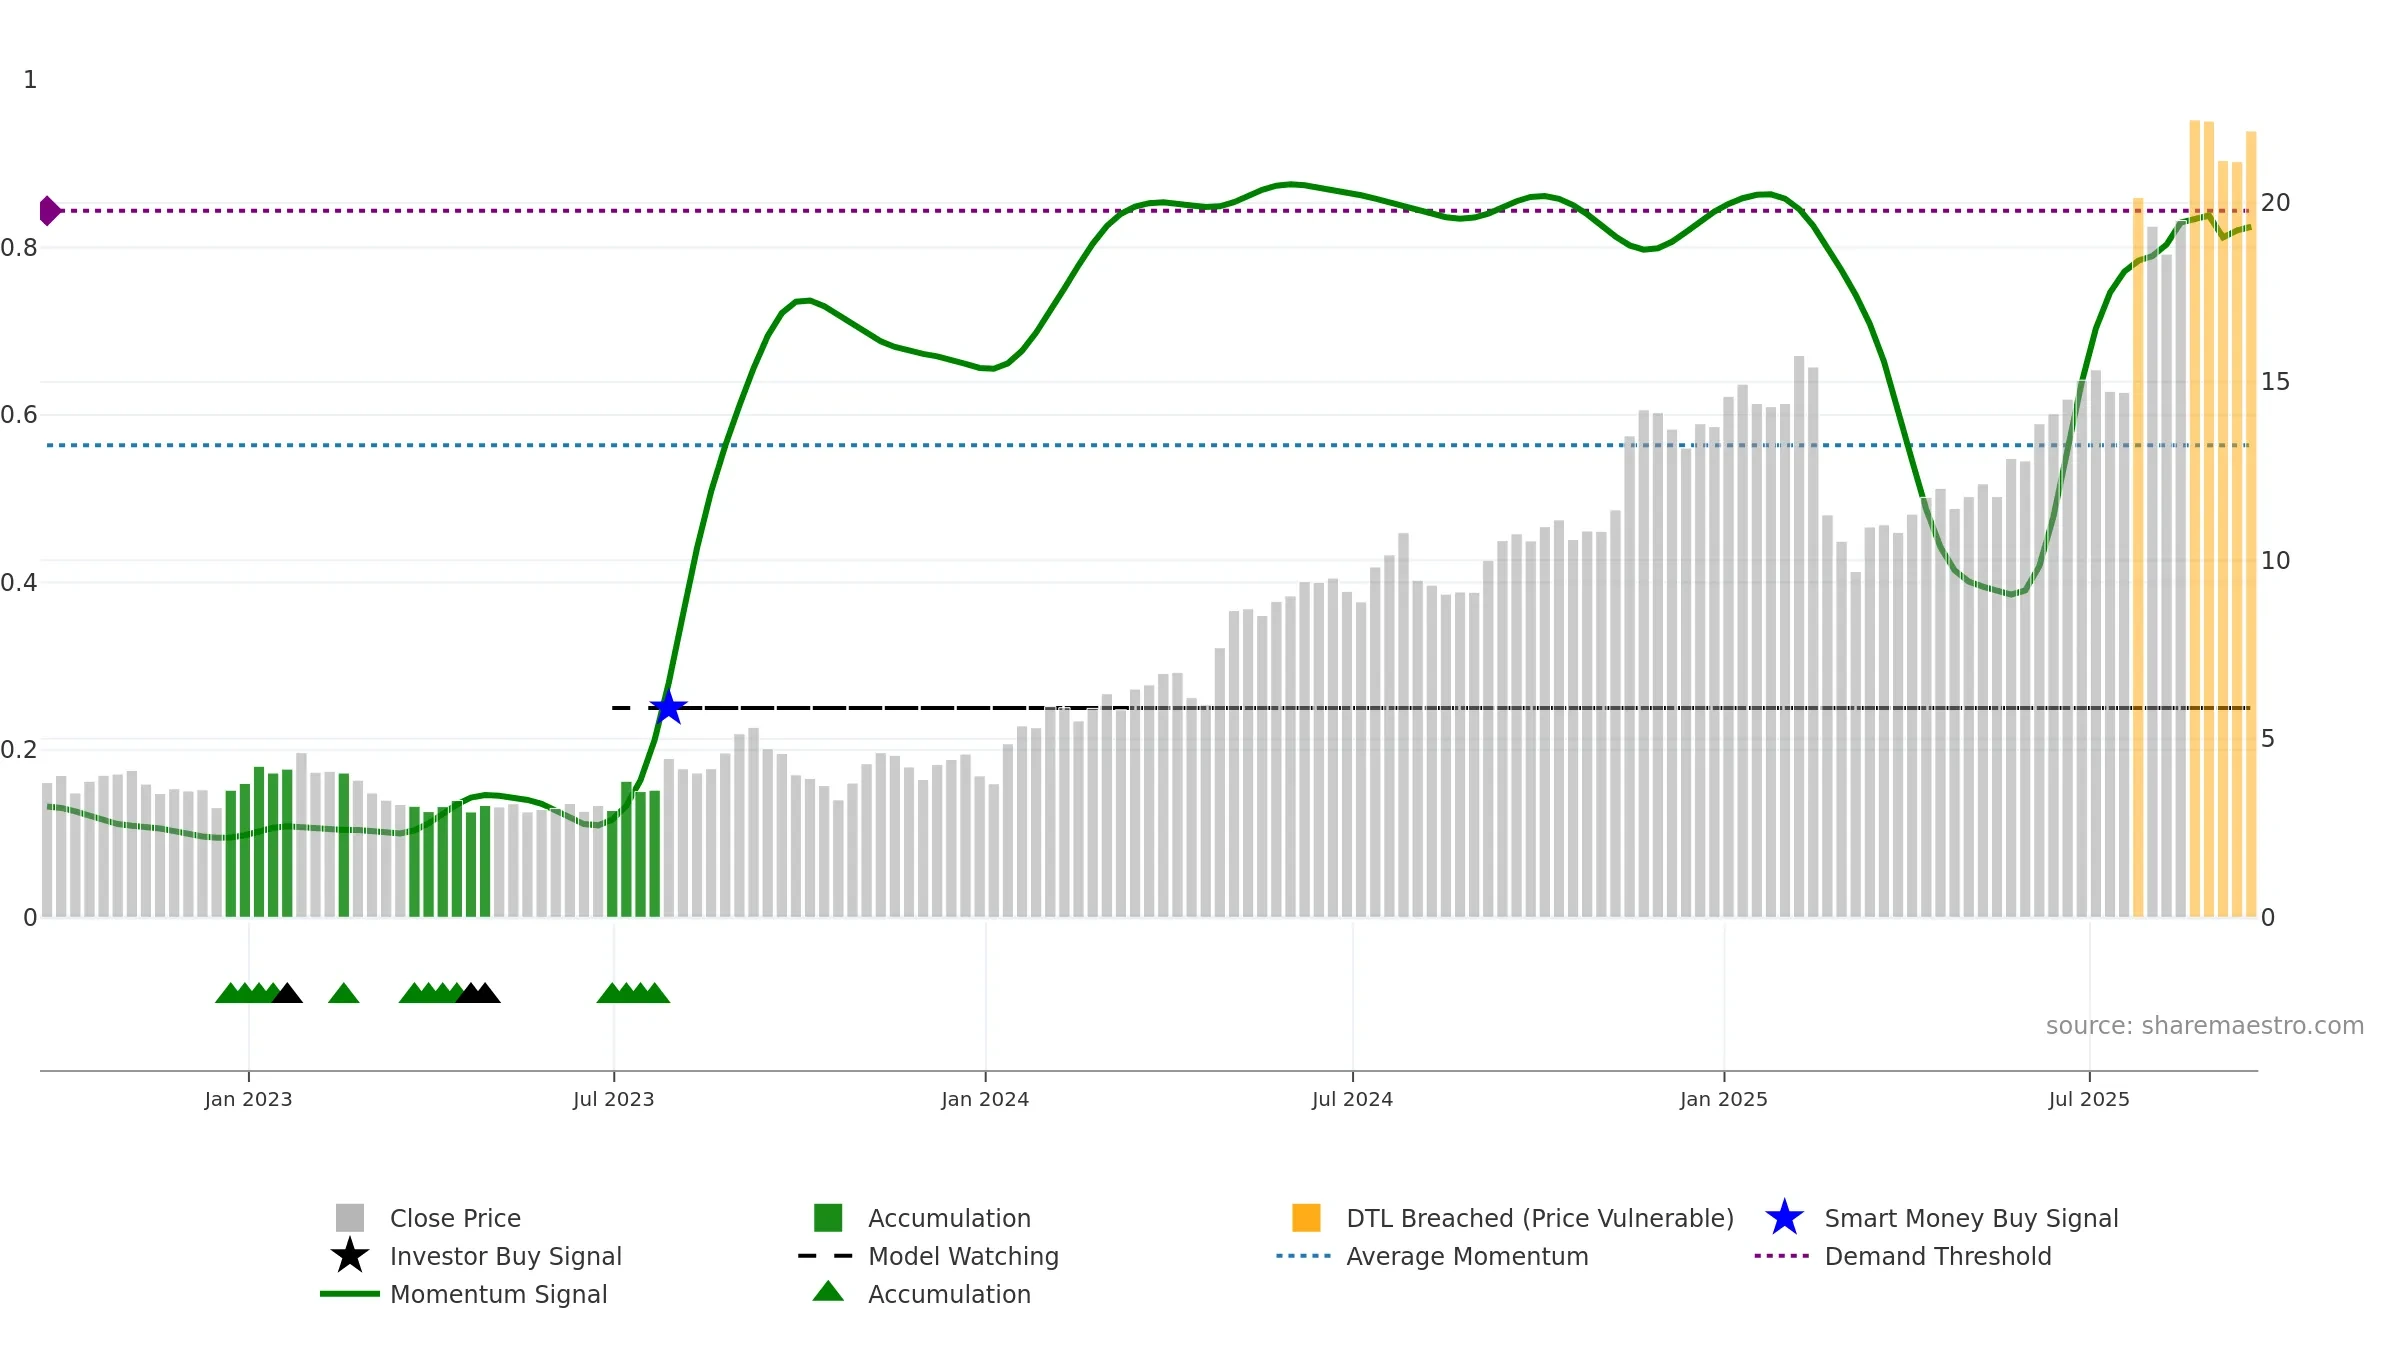
Weekly Report
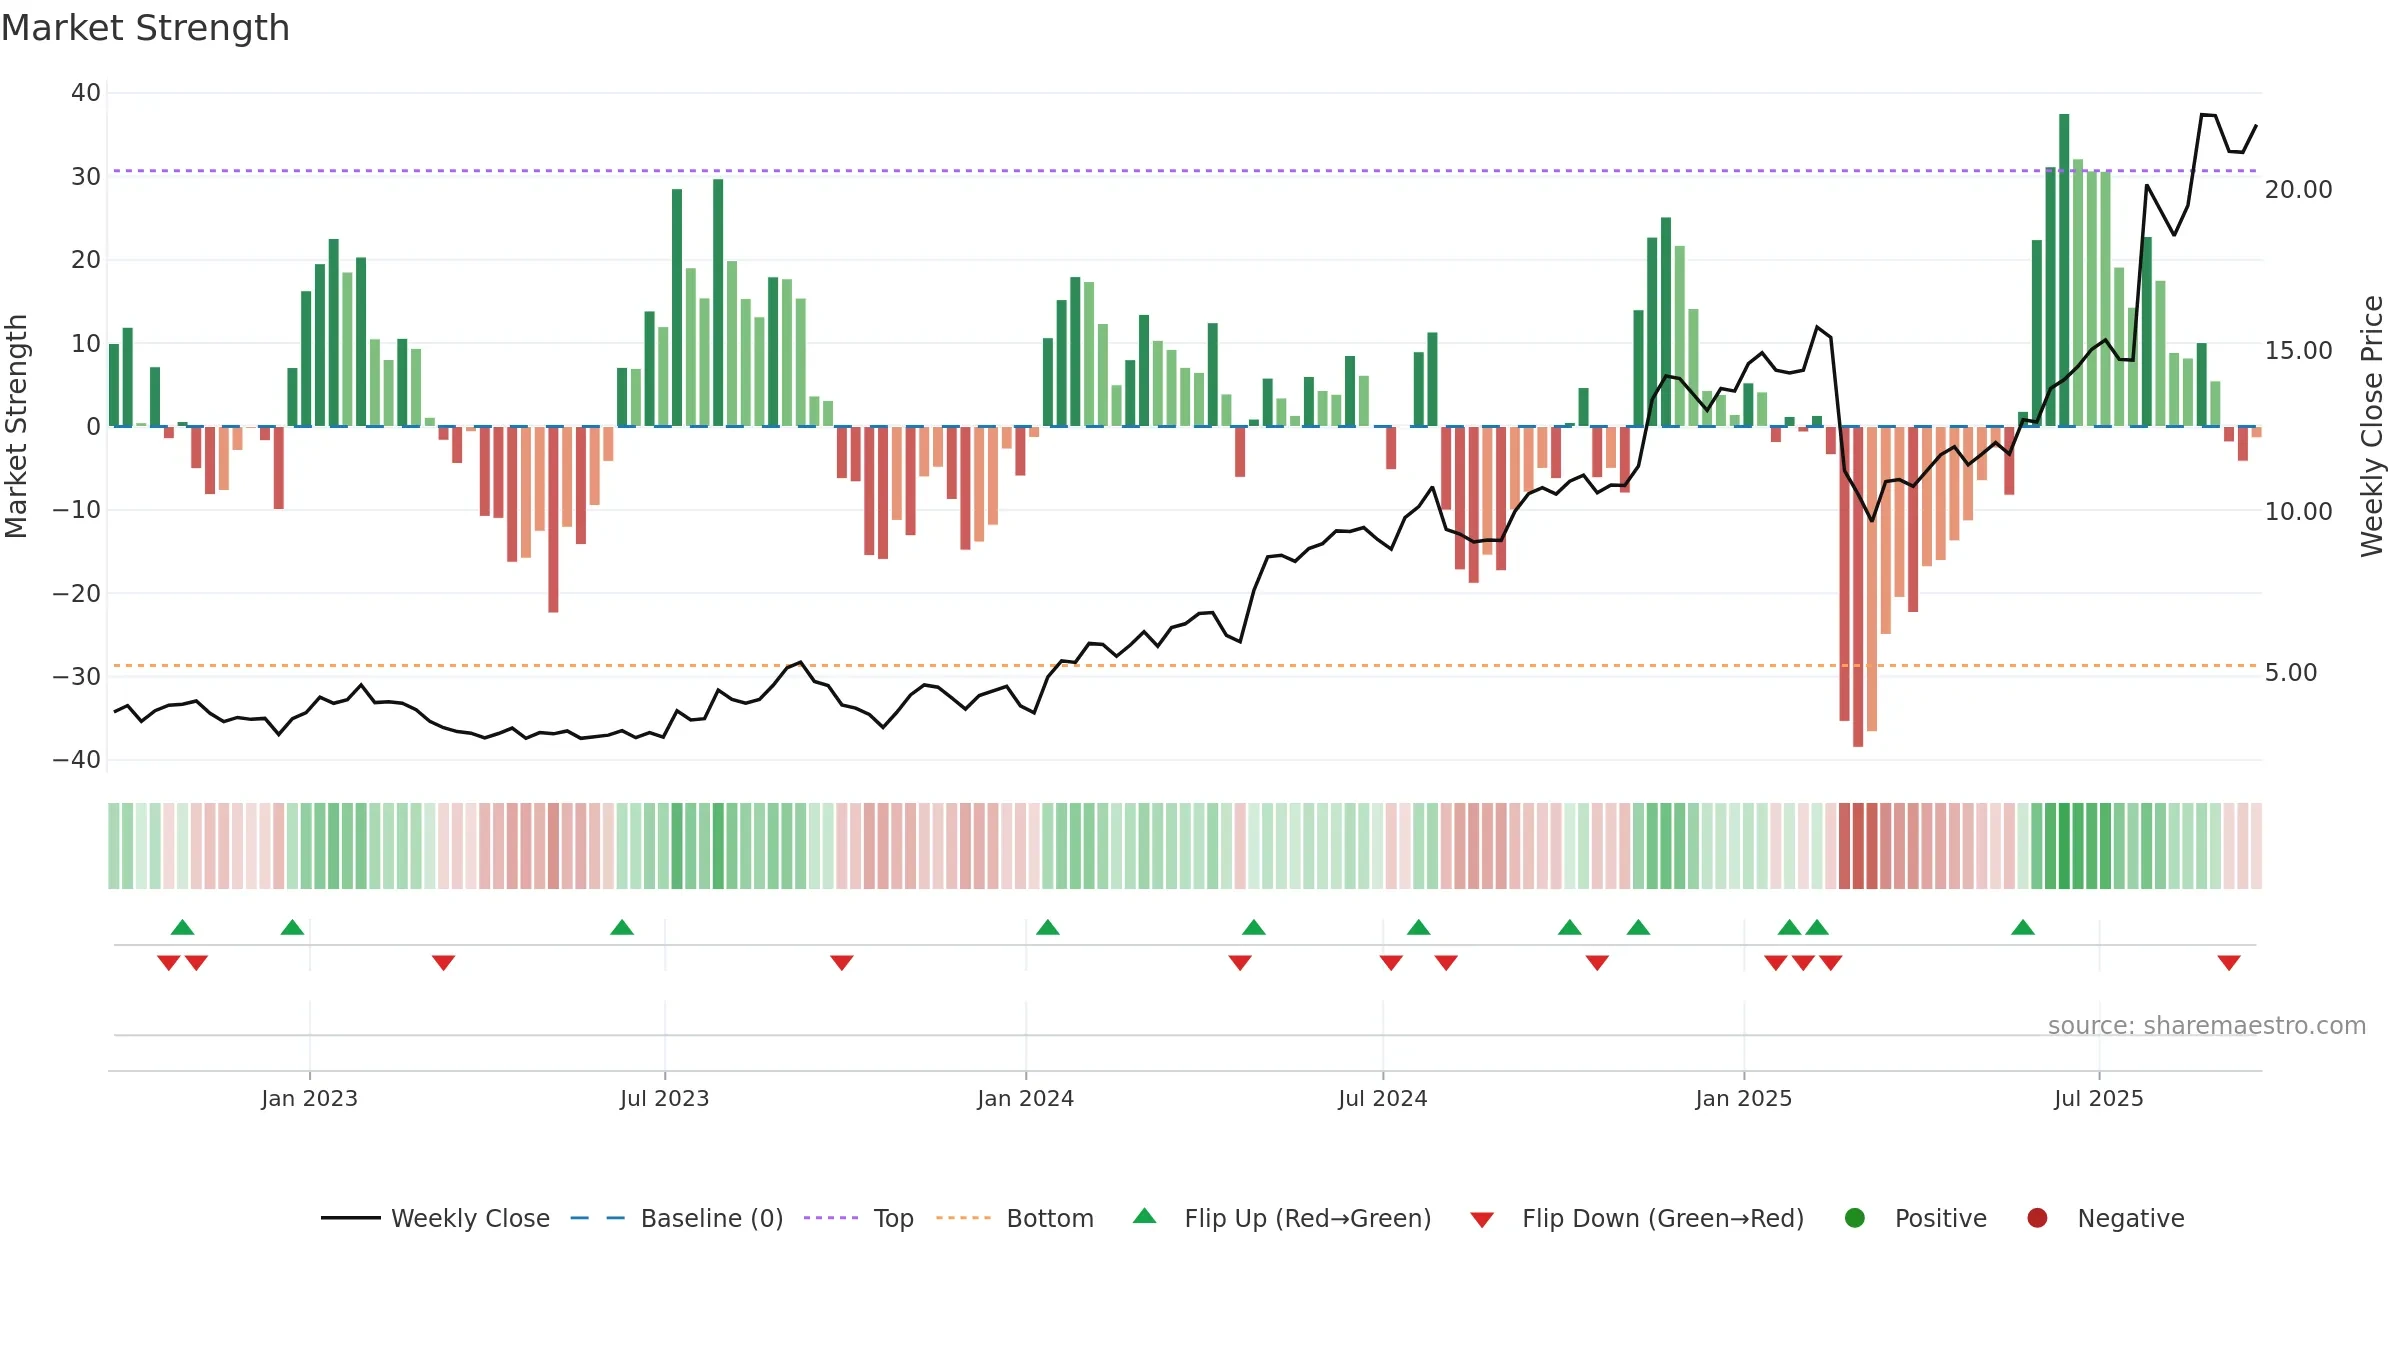
Rush Street Interactive, Inc. closed at 22.0200 (1.24% WoW) . Data window ends Fri, 19 Sep 2025.
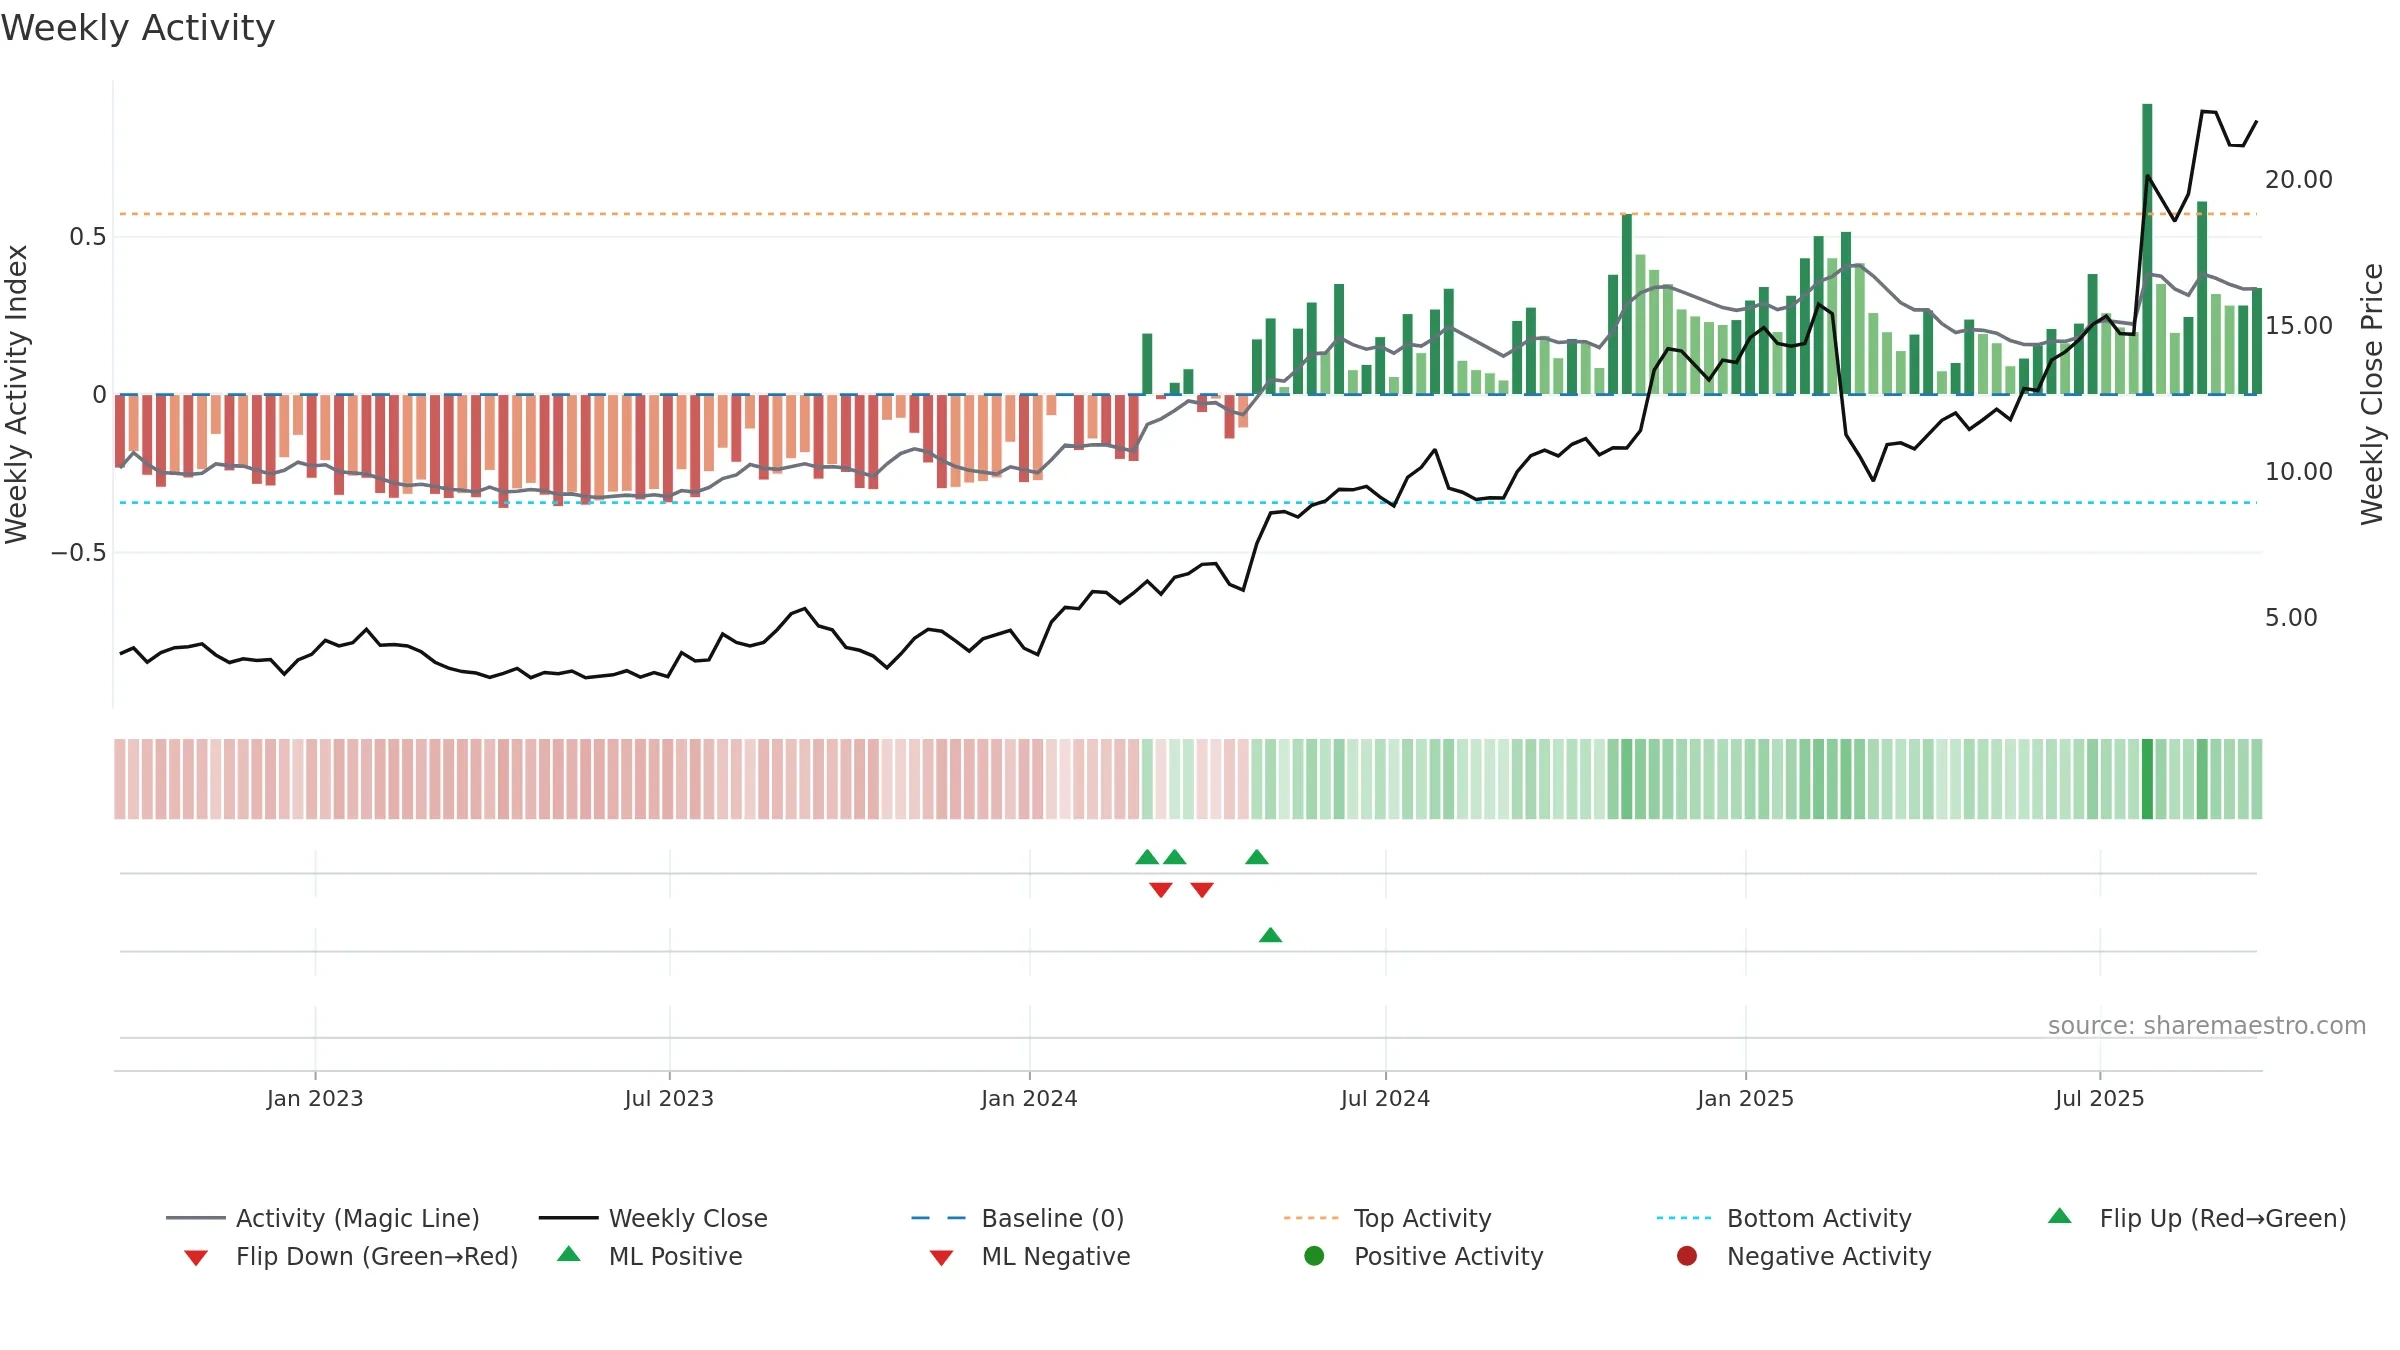
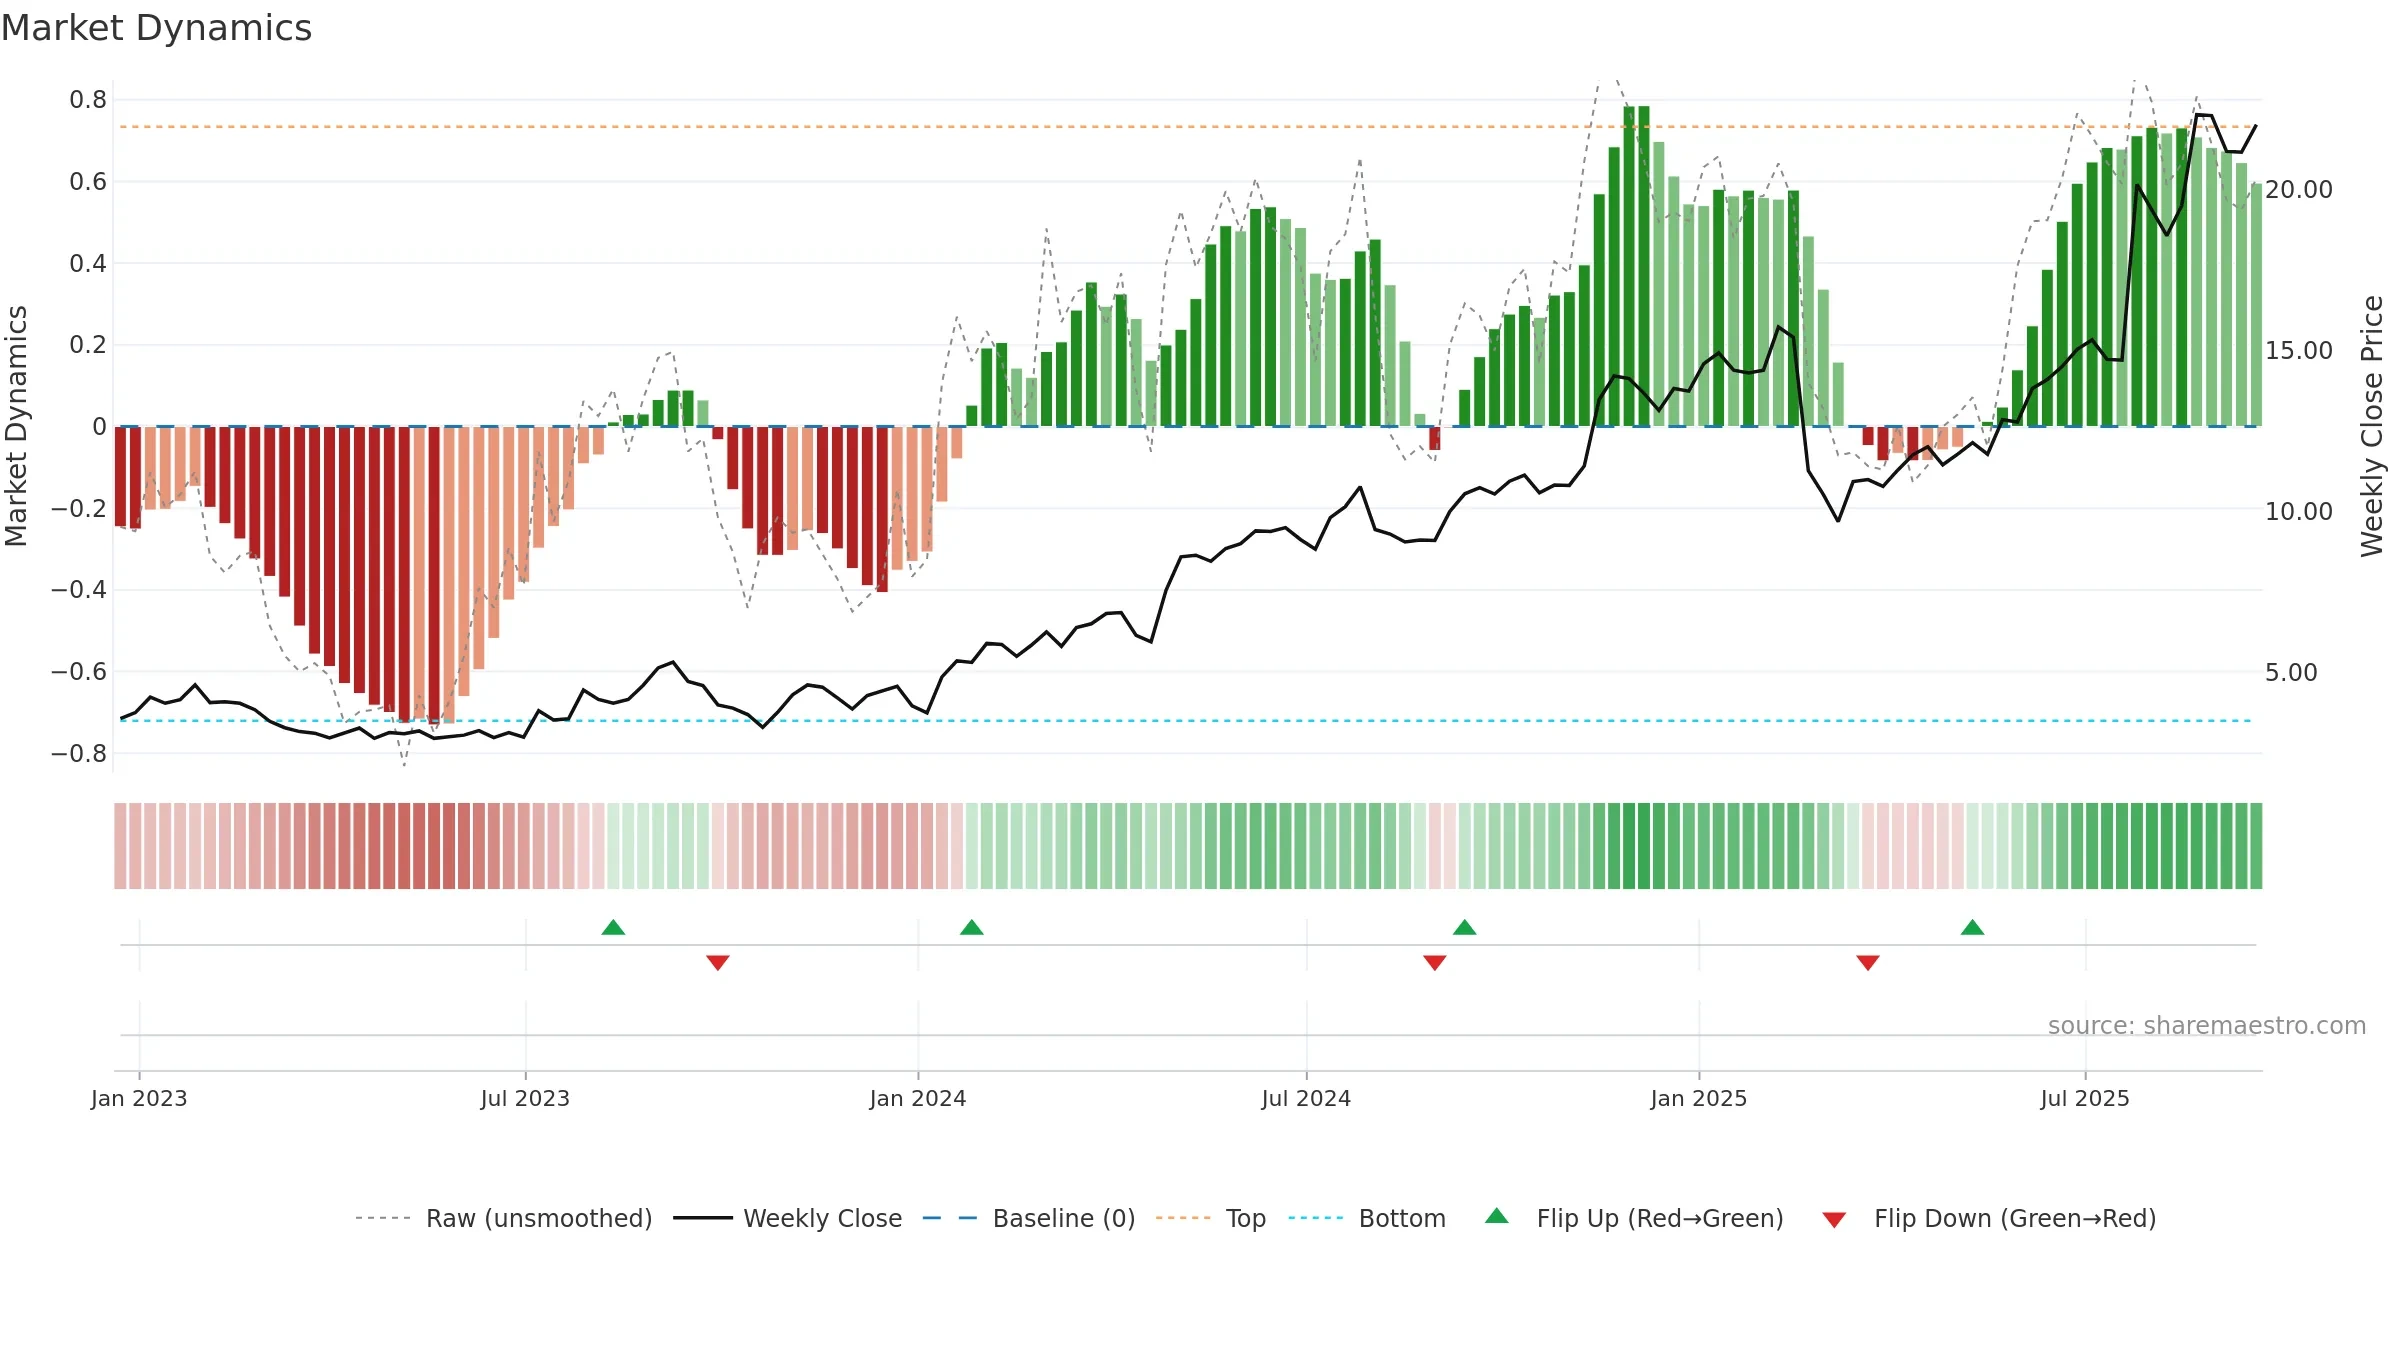
How to read this — Price slope is upward, indicating persistent buying over the window. Elevated weekly volatility increases whipsaw risk. Volume trend diverges from price — watch for fatigue or rotation. Returns are positively correlated with volume — strength tends to arrive on higher activity. Constructive MA stack supports the up-drift; pullbacks may find support at the 8–13 week region. Price holds above key averages, indicating constructive participation.
Up-slope supports buying interest; pullbacks may be contained if activity stays firm. Because liquidity isn’t confirming, prefer evidence of fresh demand before chasing moves.
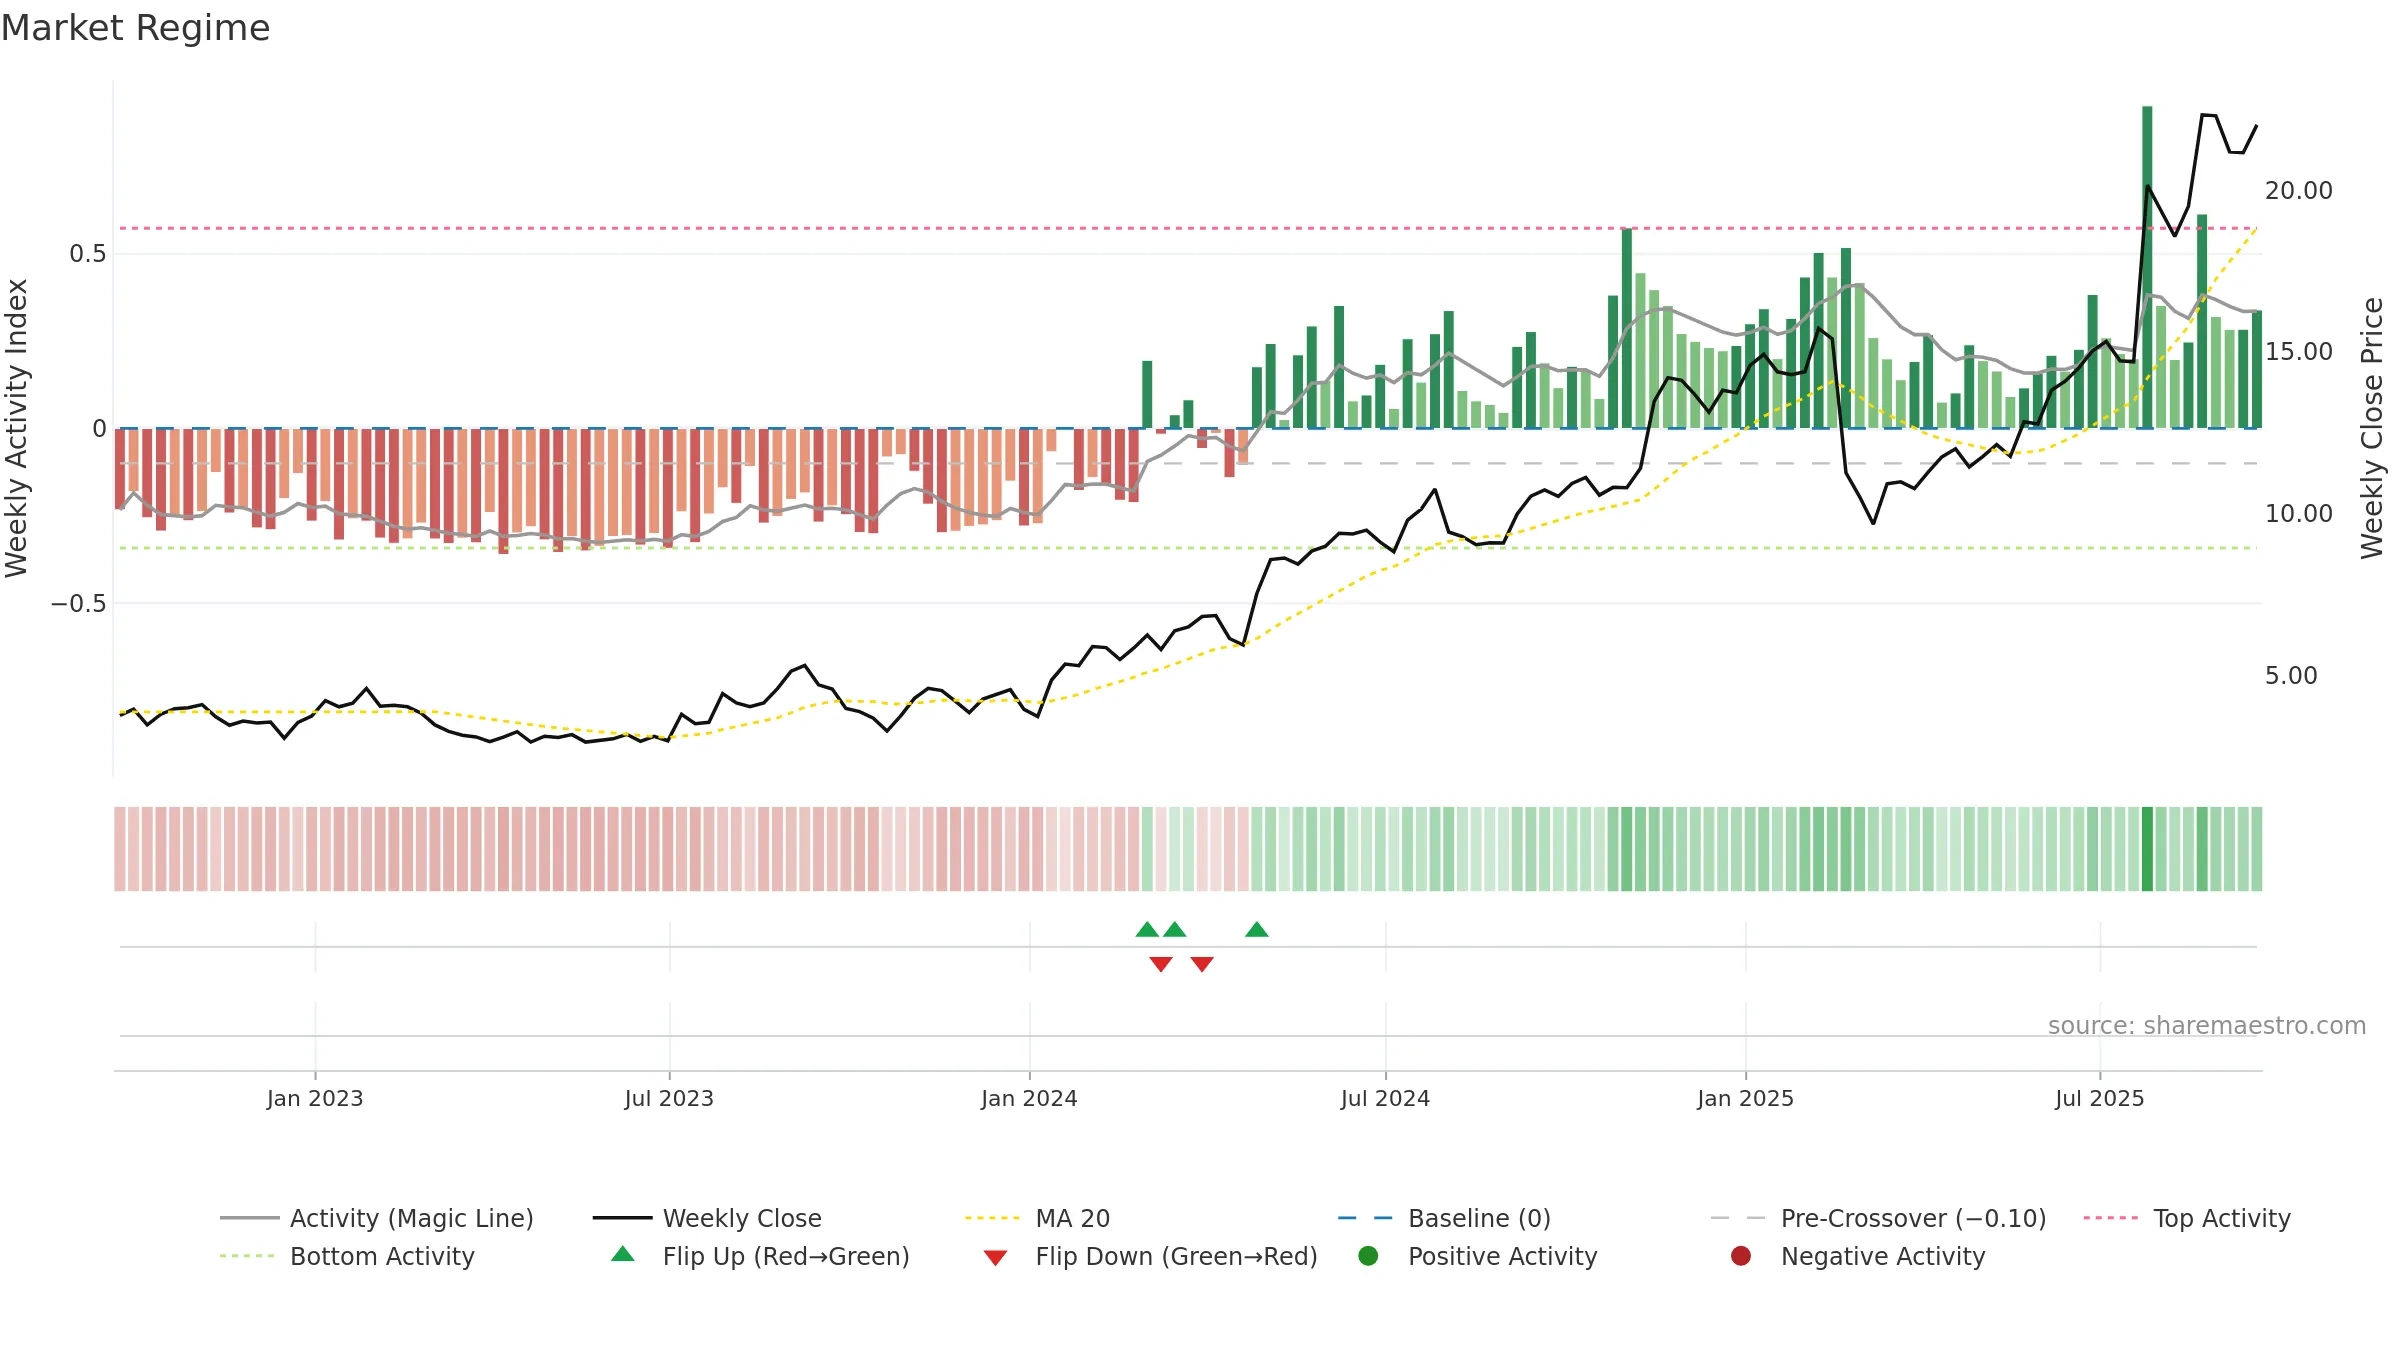
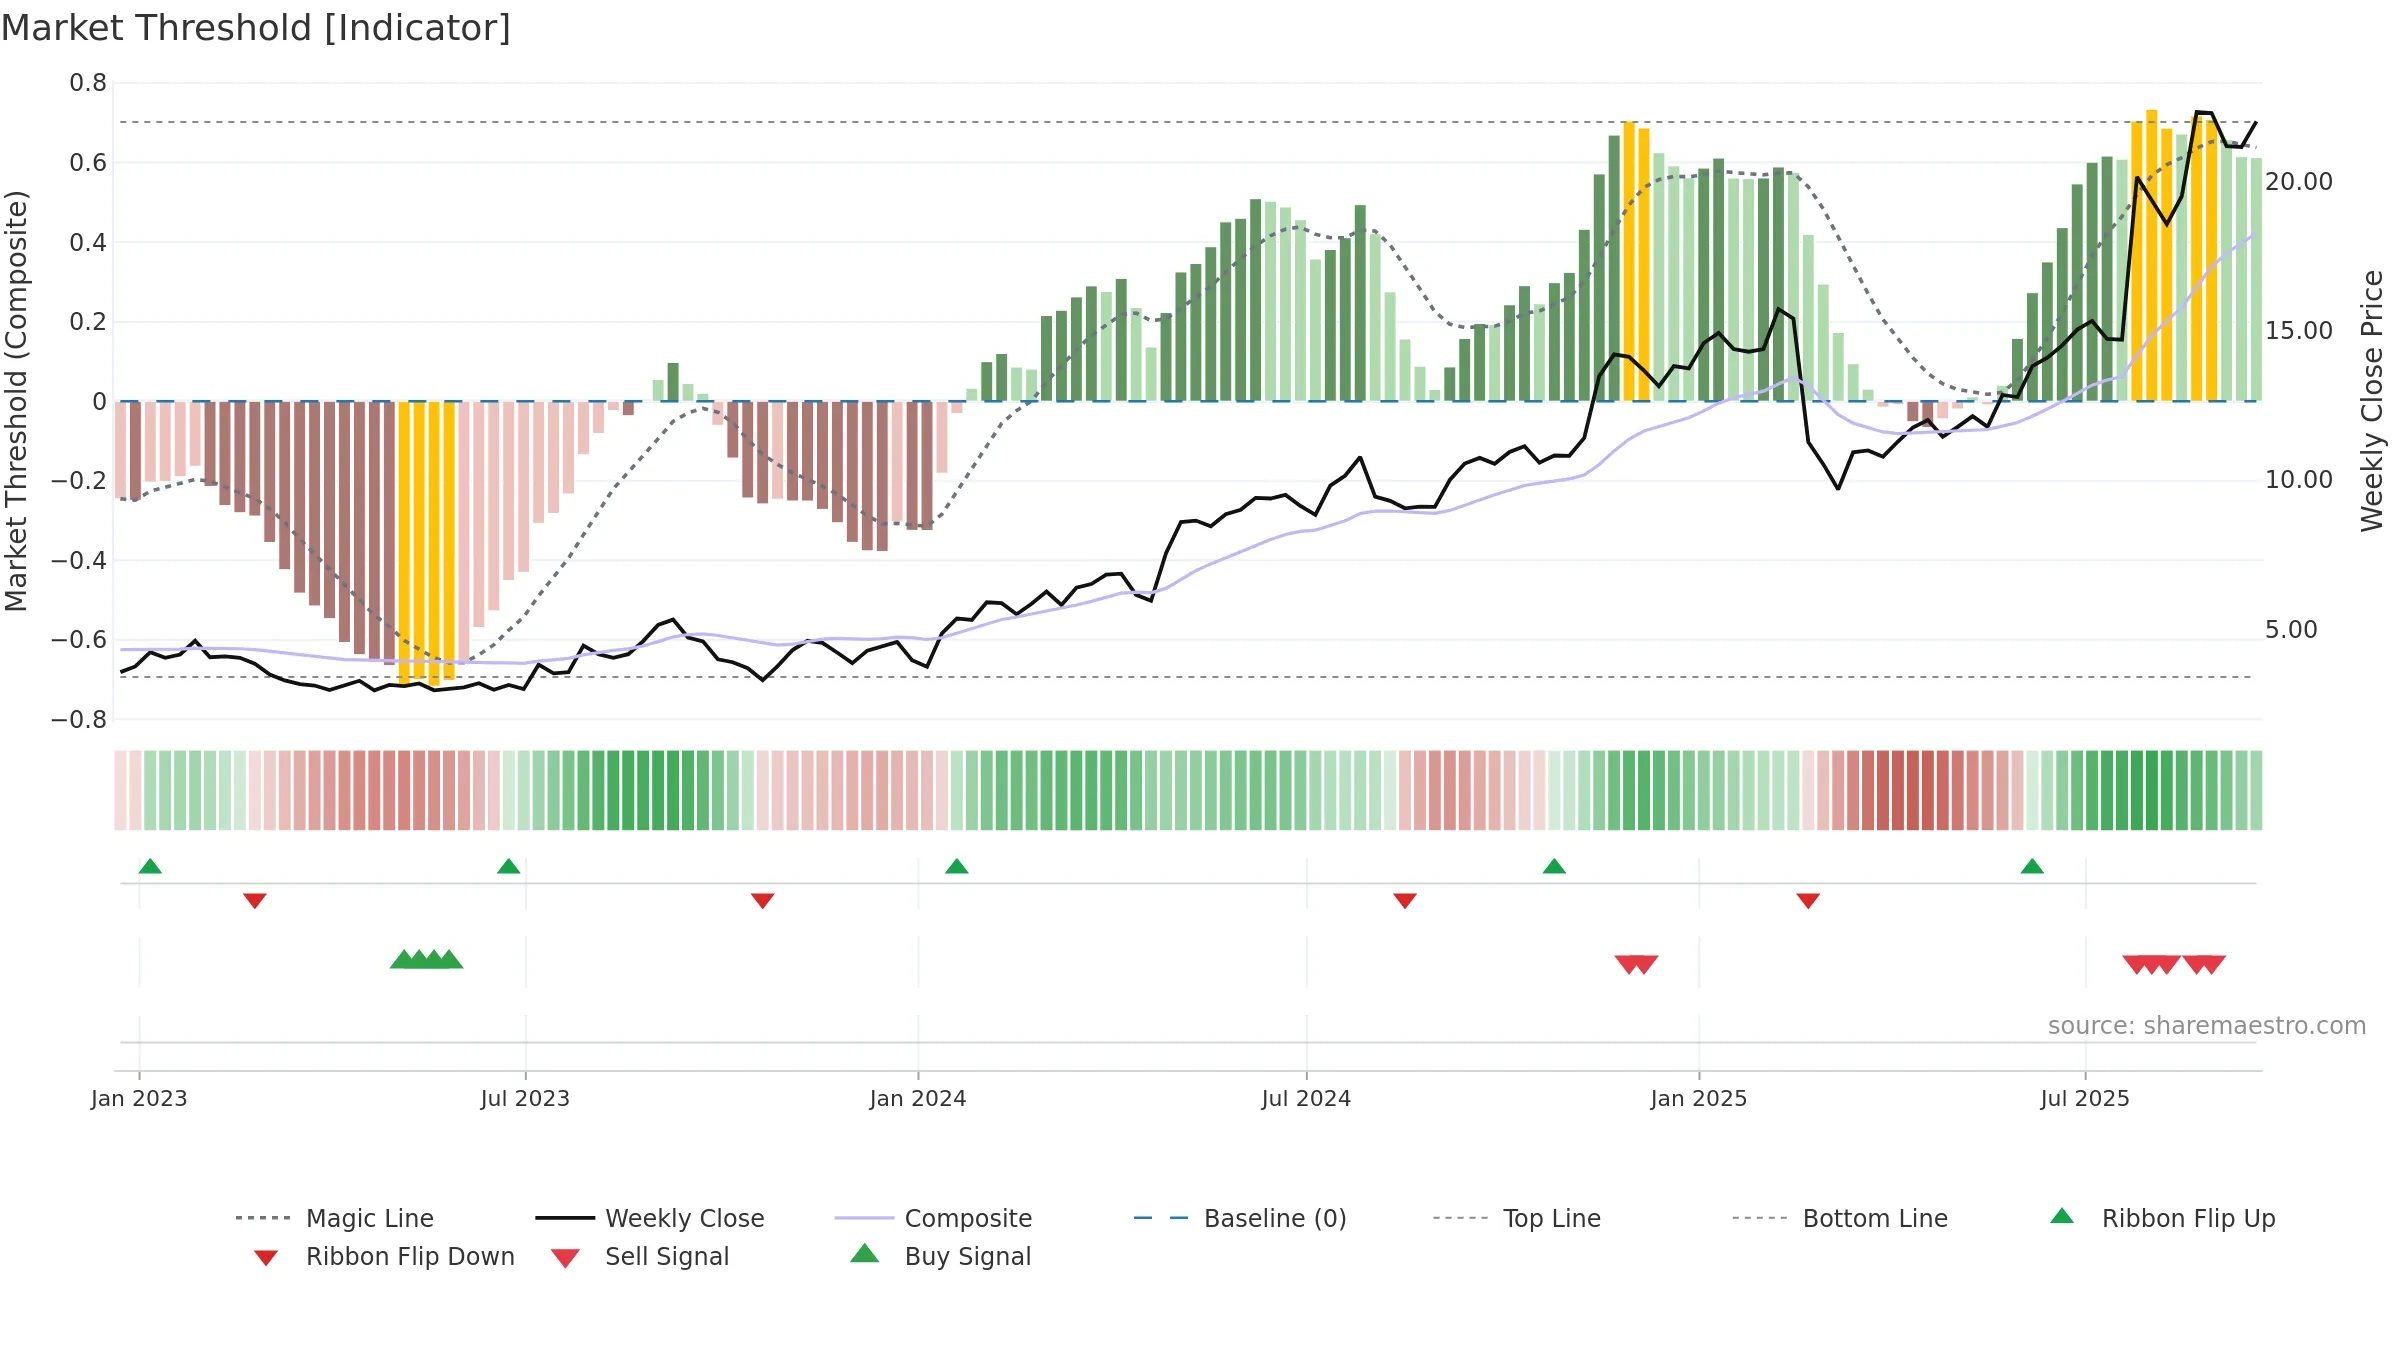
Gauge maps the trend signal to a 0–100 scale.
How to read this — Gauge is elevated but momentum is rolling over; topping risk is rising.
Stay alert: protect gains or seek confirmation before adding risk.
Conclusion
Negative setup. ★★☆☆☆ confidence. Price window: 13. Trend: Uptrend at Risk; gauge 82. In combination, liquidity diverges from price.
- Momentum is bullish and rising
- Price holds above 8w & 26w averages
- Constructive moving-average stack
- Solid multi-week performance
- High-level but rolling over (topping risk)
- Liquidity diverges from price
- High return volatility raises whipsaw risk
Why: Price window 13.80% over 8w. Close is -1.39% below the prior-window high. Return volatility 4.11%. Volume trend falling. Liquidity divergence with price. Trend state uptrend at risk. High-regime (0.80–1.00) downticks 1/6 (17.0%) • Accumulating. MA stack constructive. Baseline deviation 1.66% (widening). Momentum bullish and rising.
Tip: Most metrics include a hover tooltip where they appear in the report.