Abeona Therapeutics Inc.
ABEO NASDAQ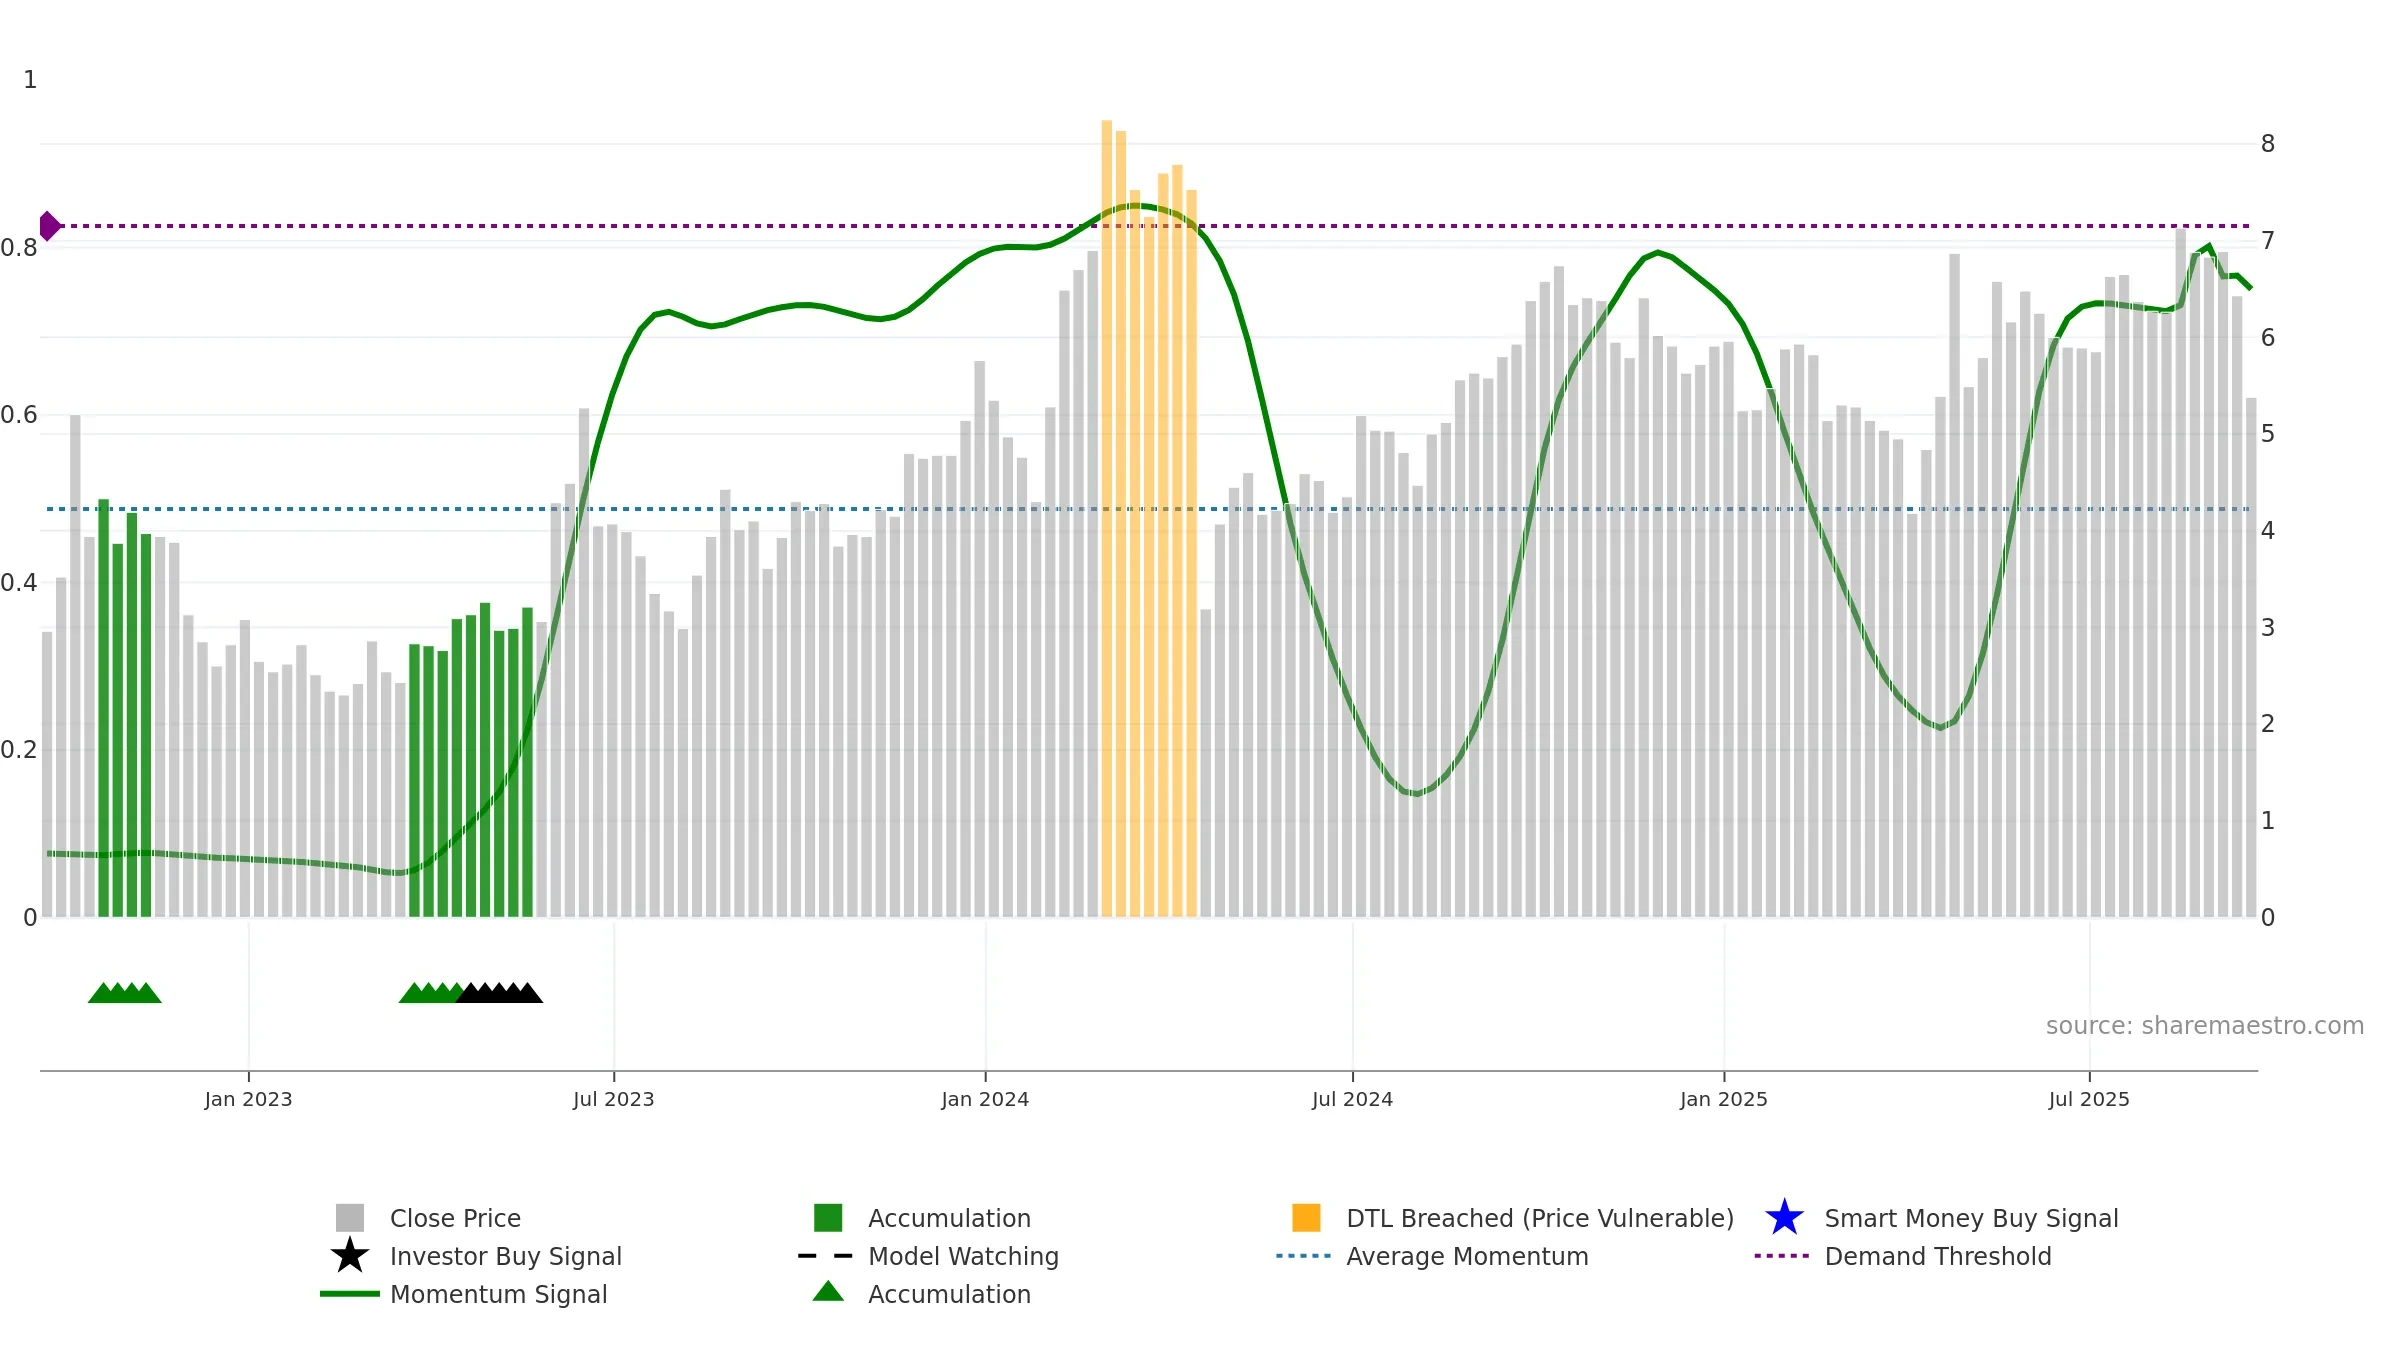
Weekly Report
Abeona Therapeutics Inc. closed at 5.3800 (-4.95% WoW) . Data window ends Fri, 19 Sep 2025.
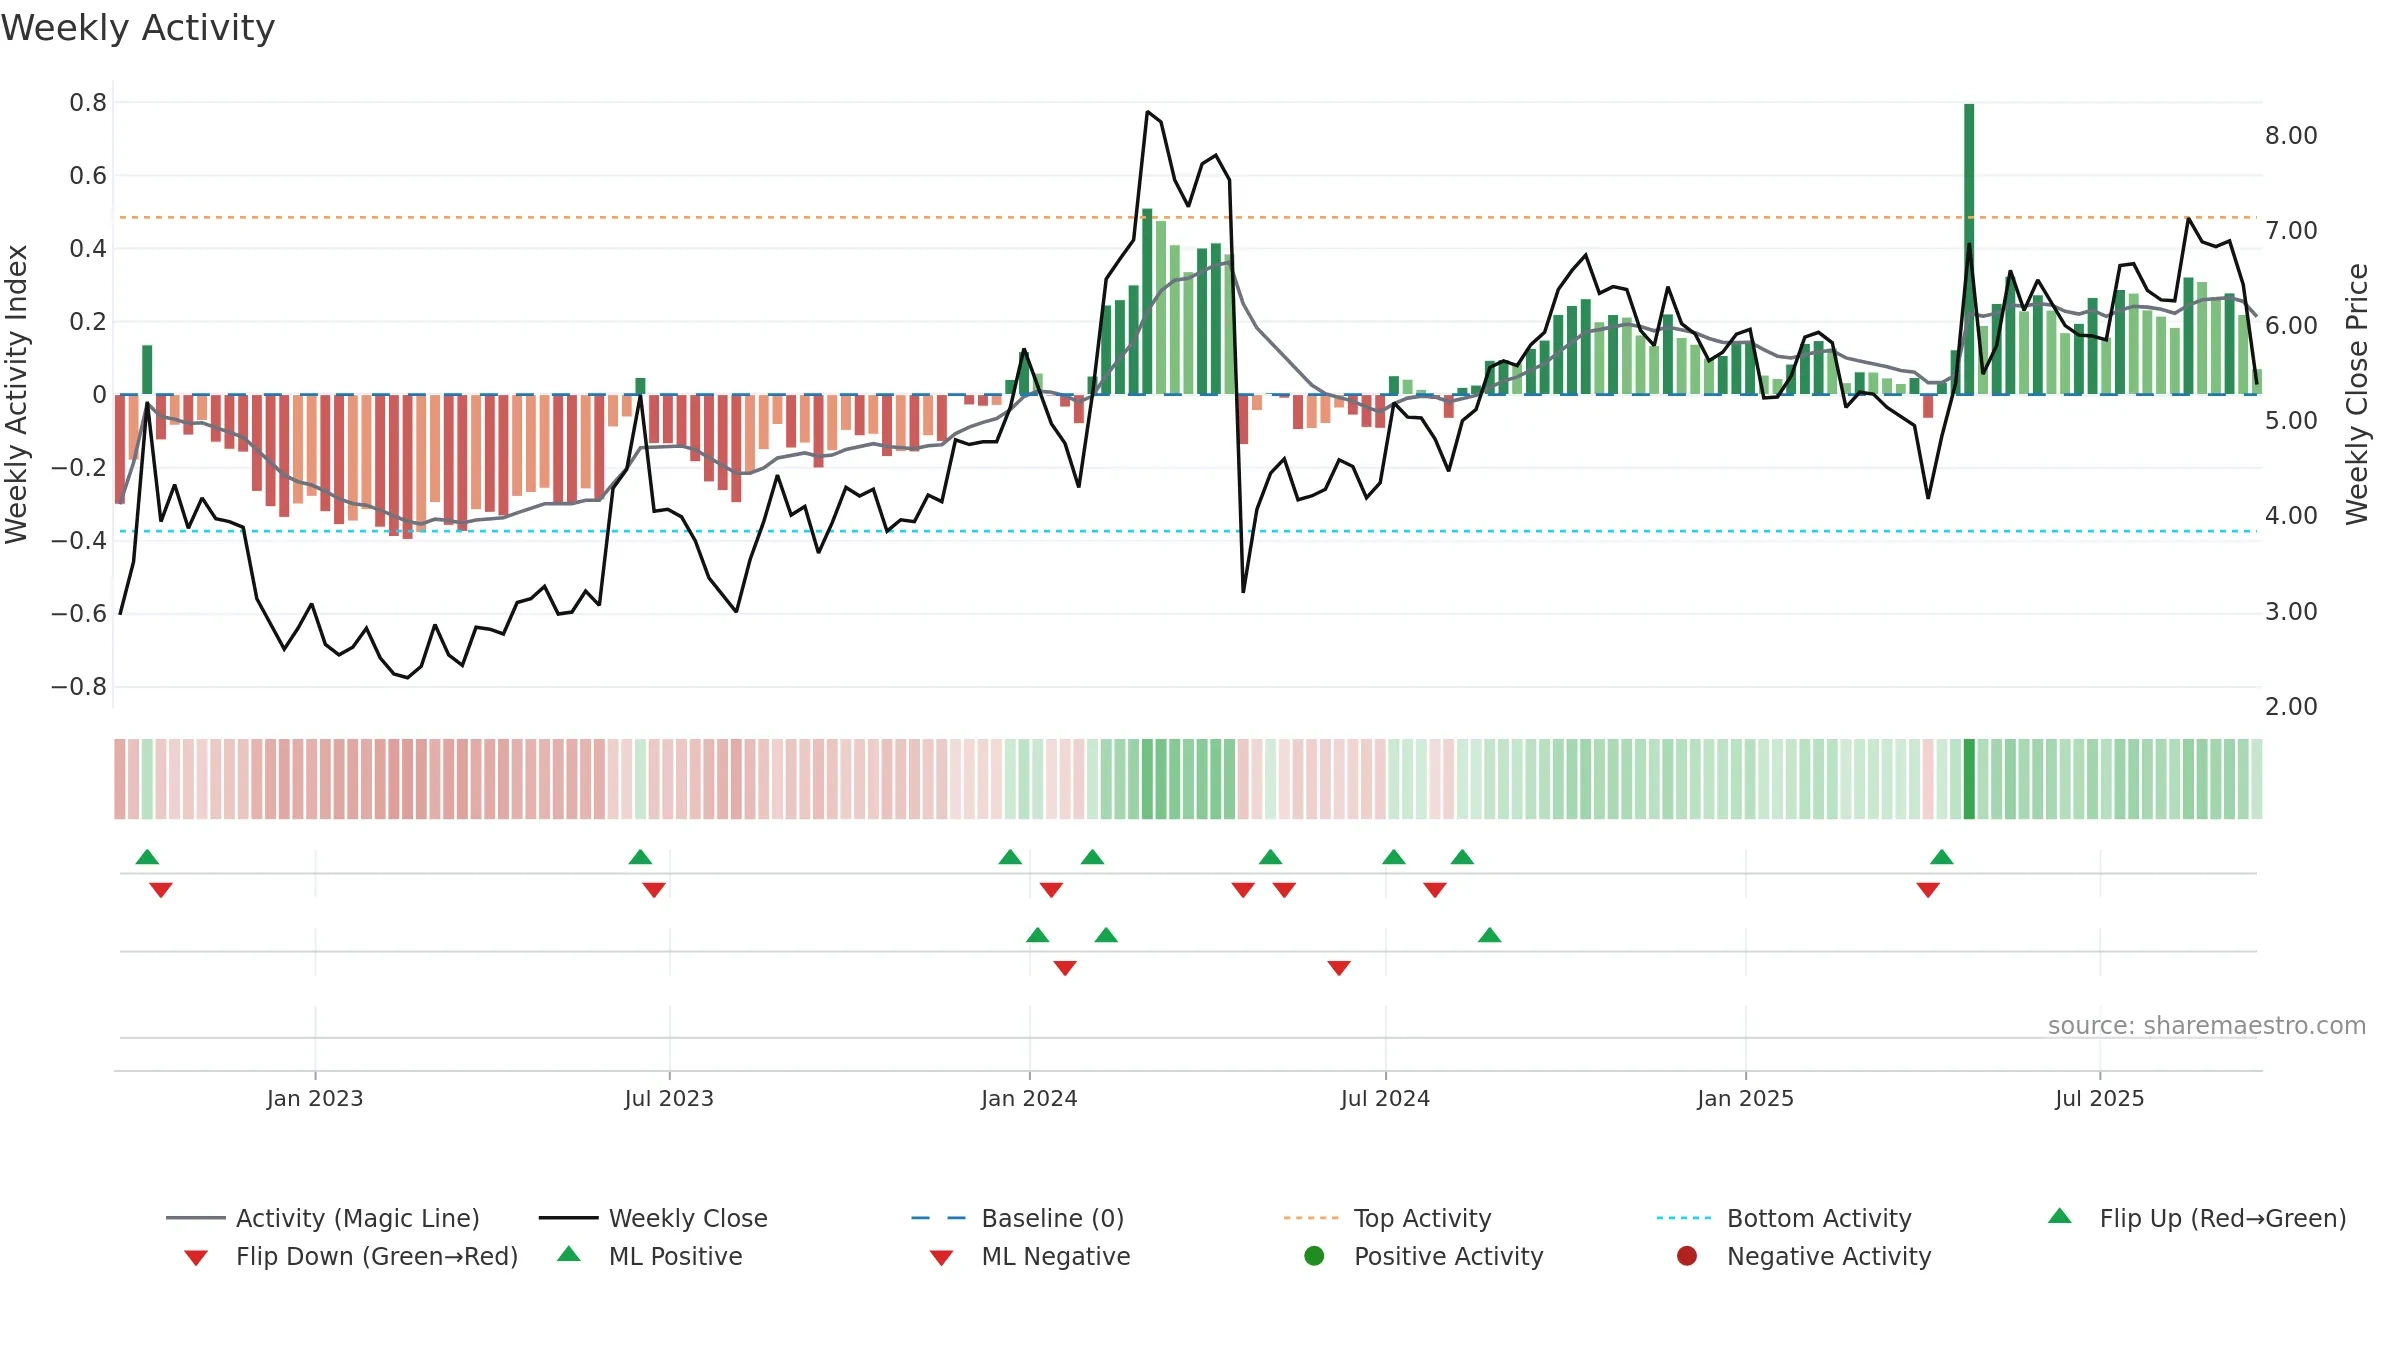
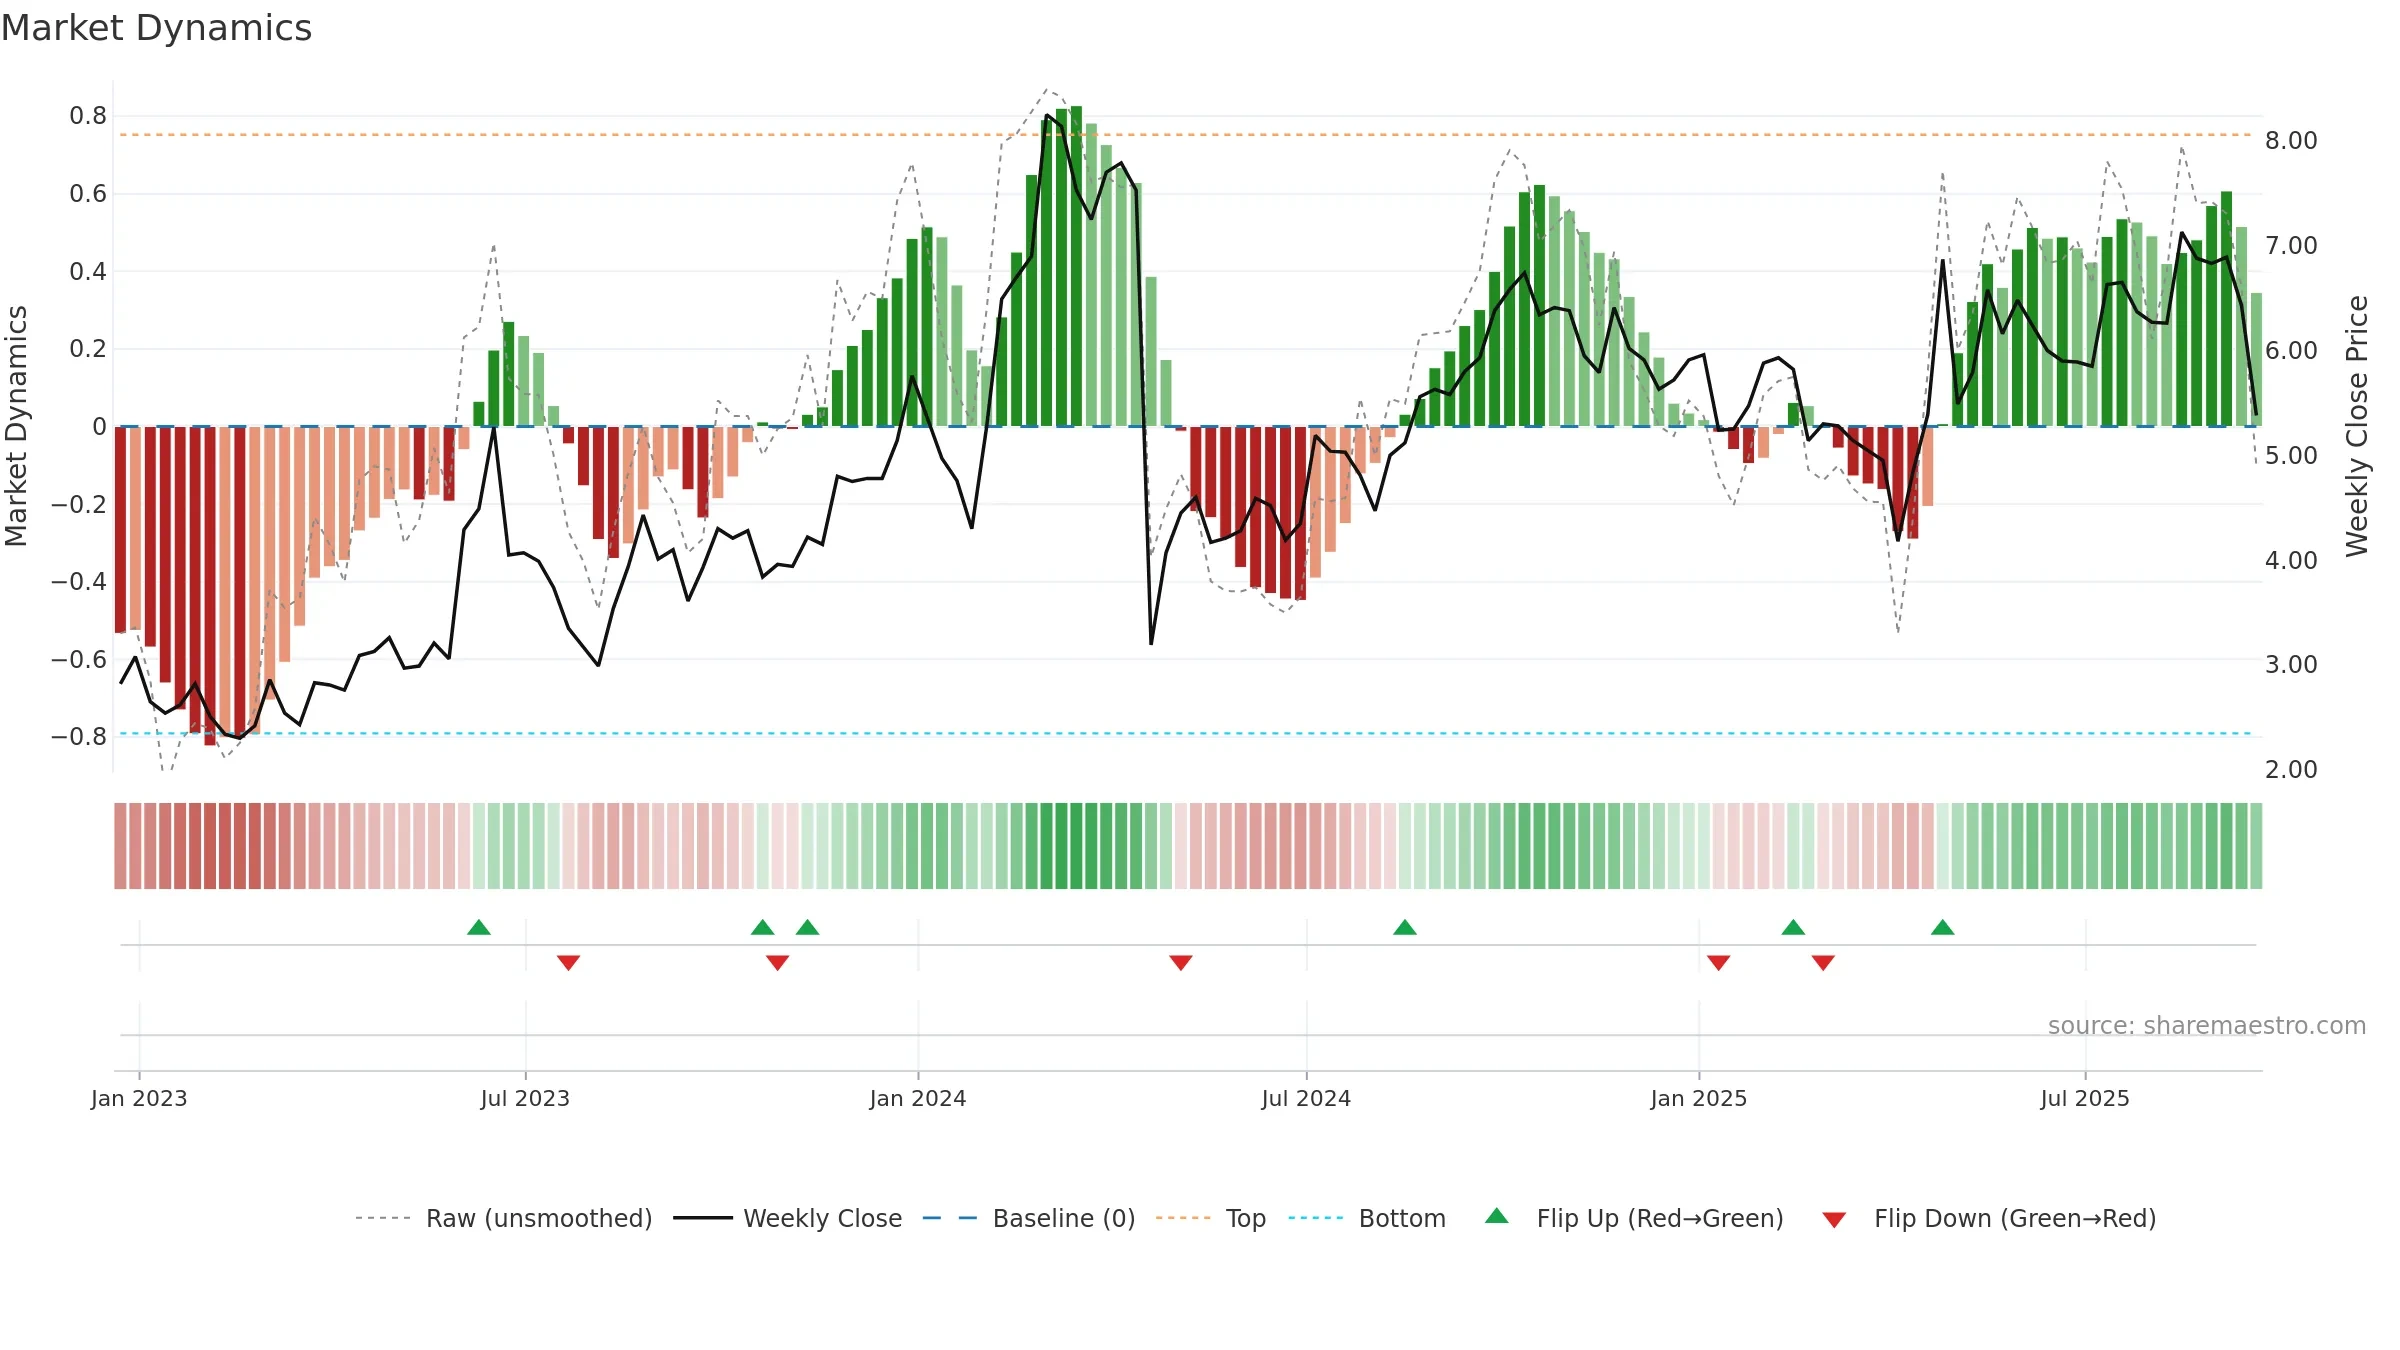
How to read this — Price slope is downward, indicating persistent supply pressure. Volume and price are moving in the same direction — a constructive confirmation. Returns are negatively correlated with volume — strength may come on lighter activity. Fresh short-term downside crossover weakens near-term tone. Price sits below key averages, keeping pressure on the tape.
Down-slope argues for patience; rallies can fade sooner unless participation improves.
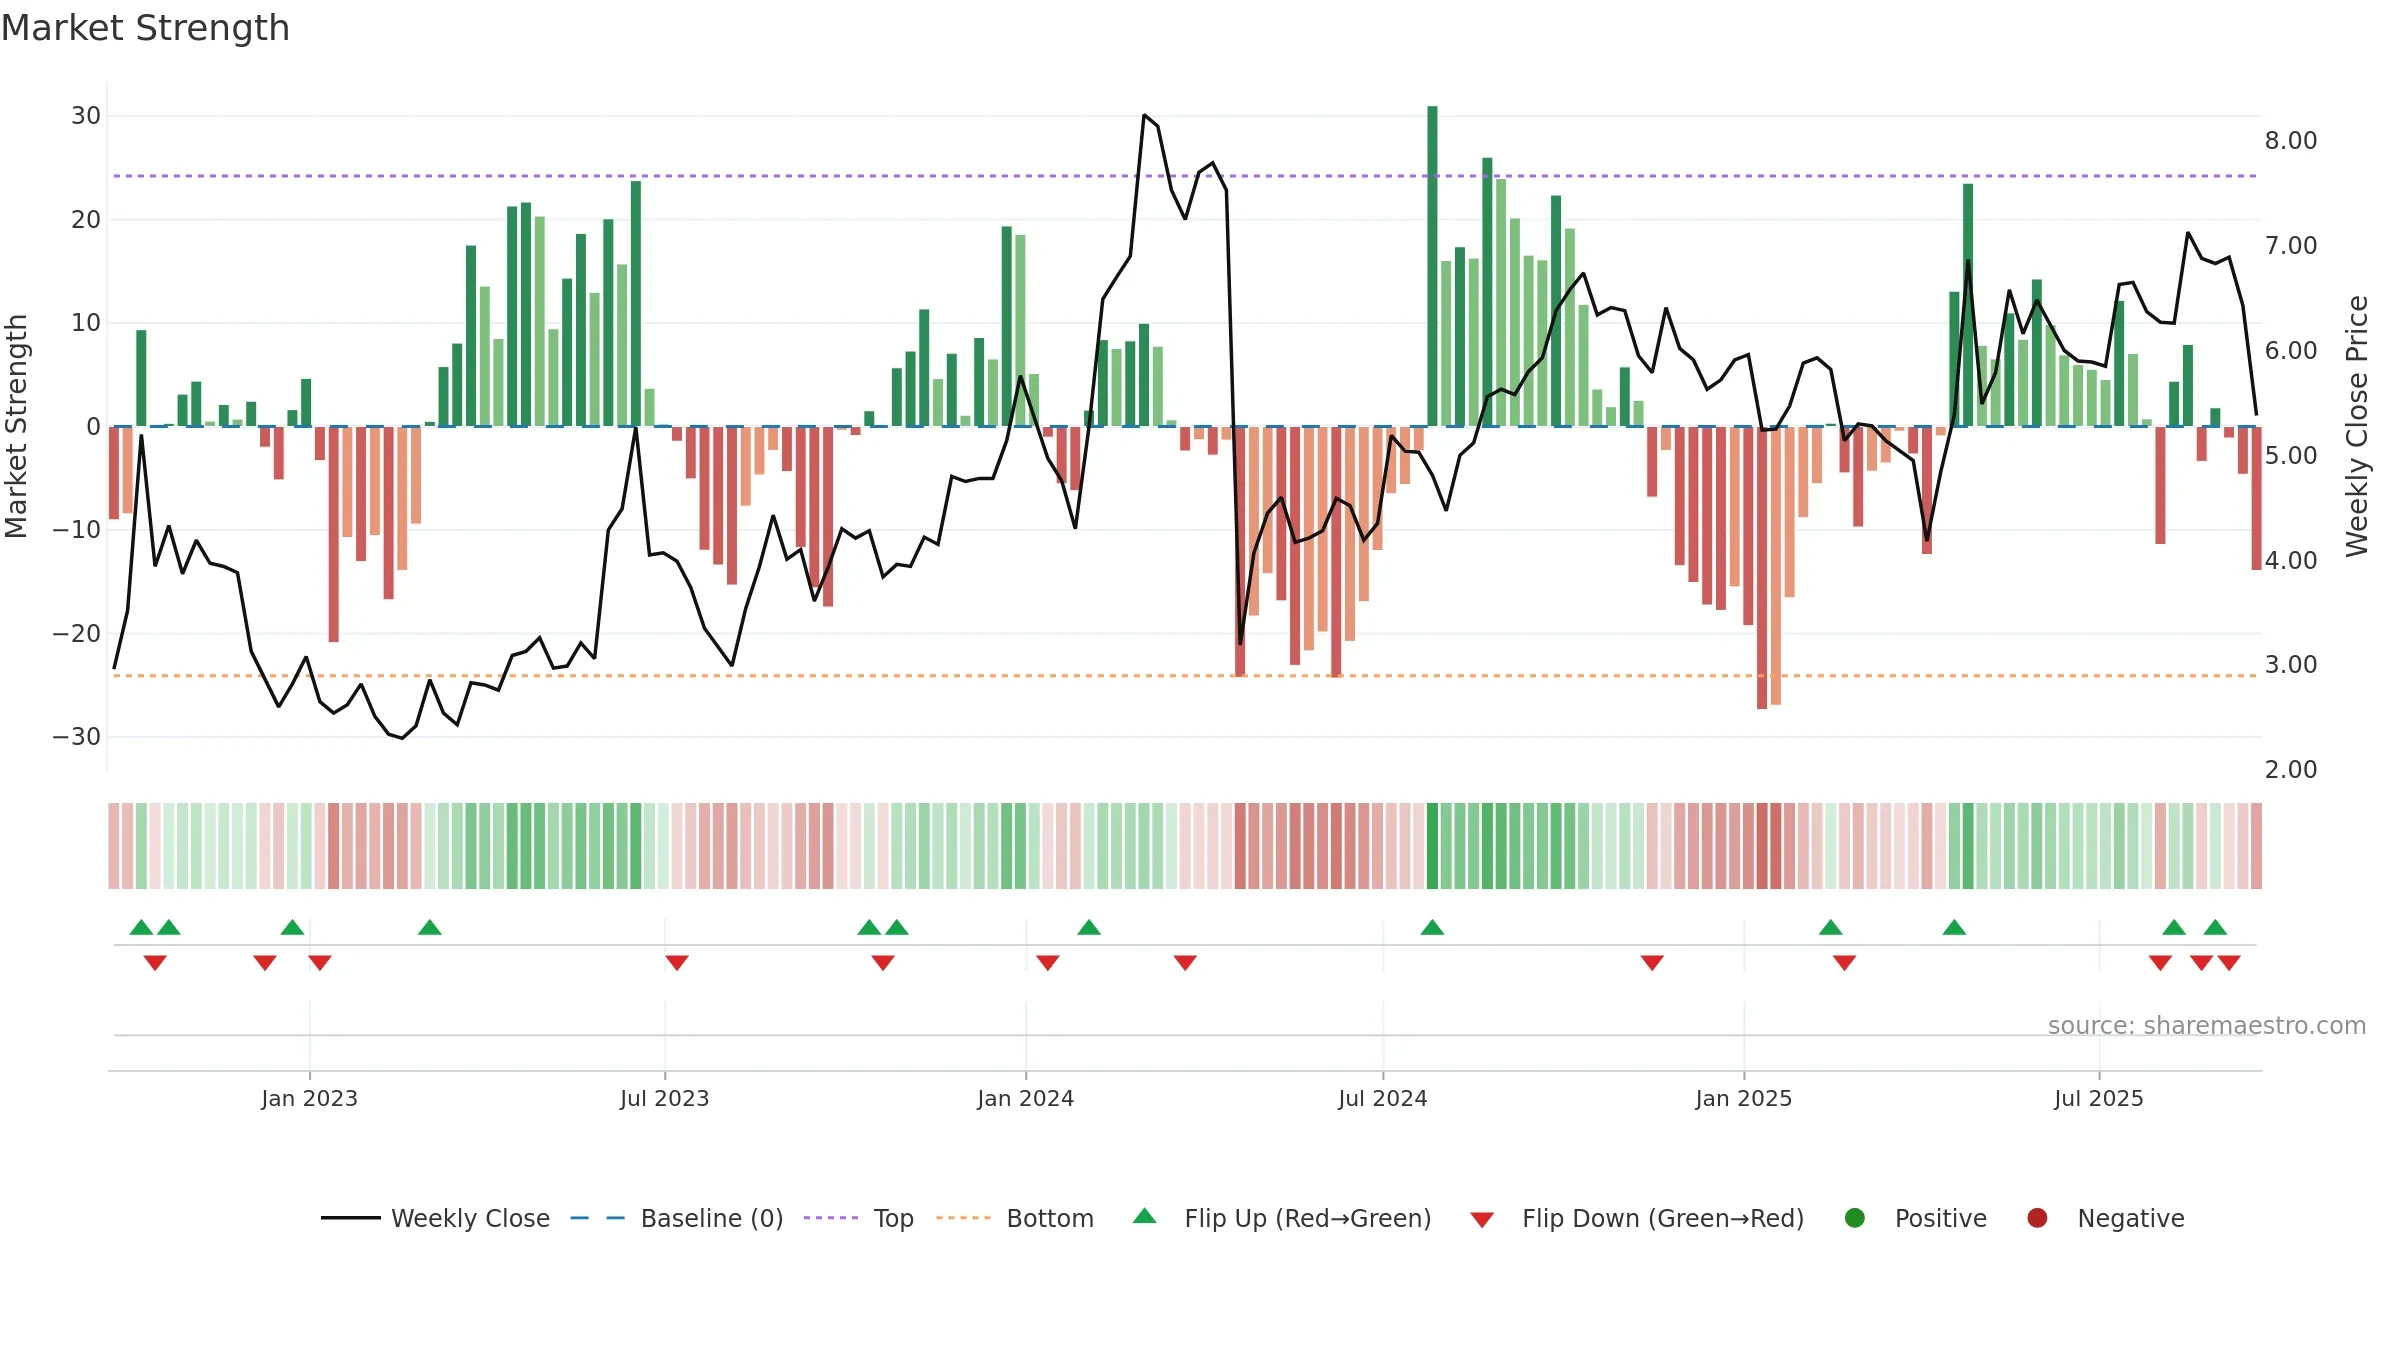
Gauge maps the trend signal to a 0–100 scale.
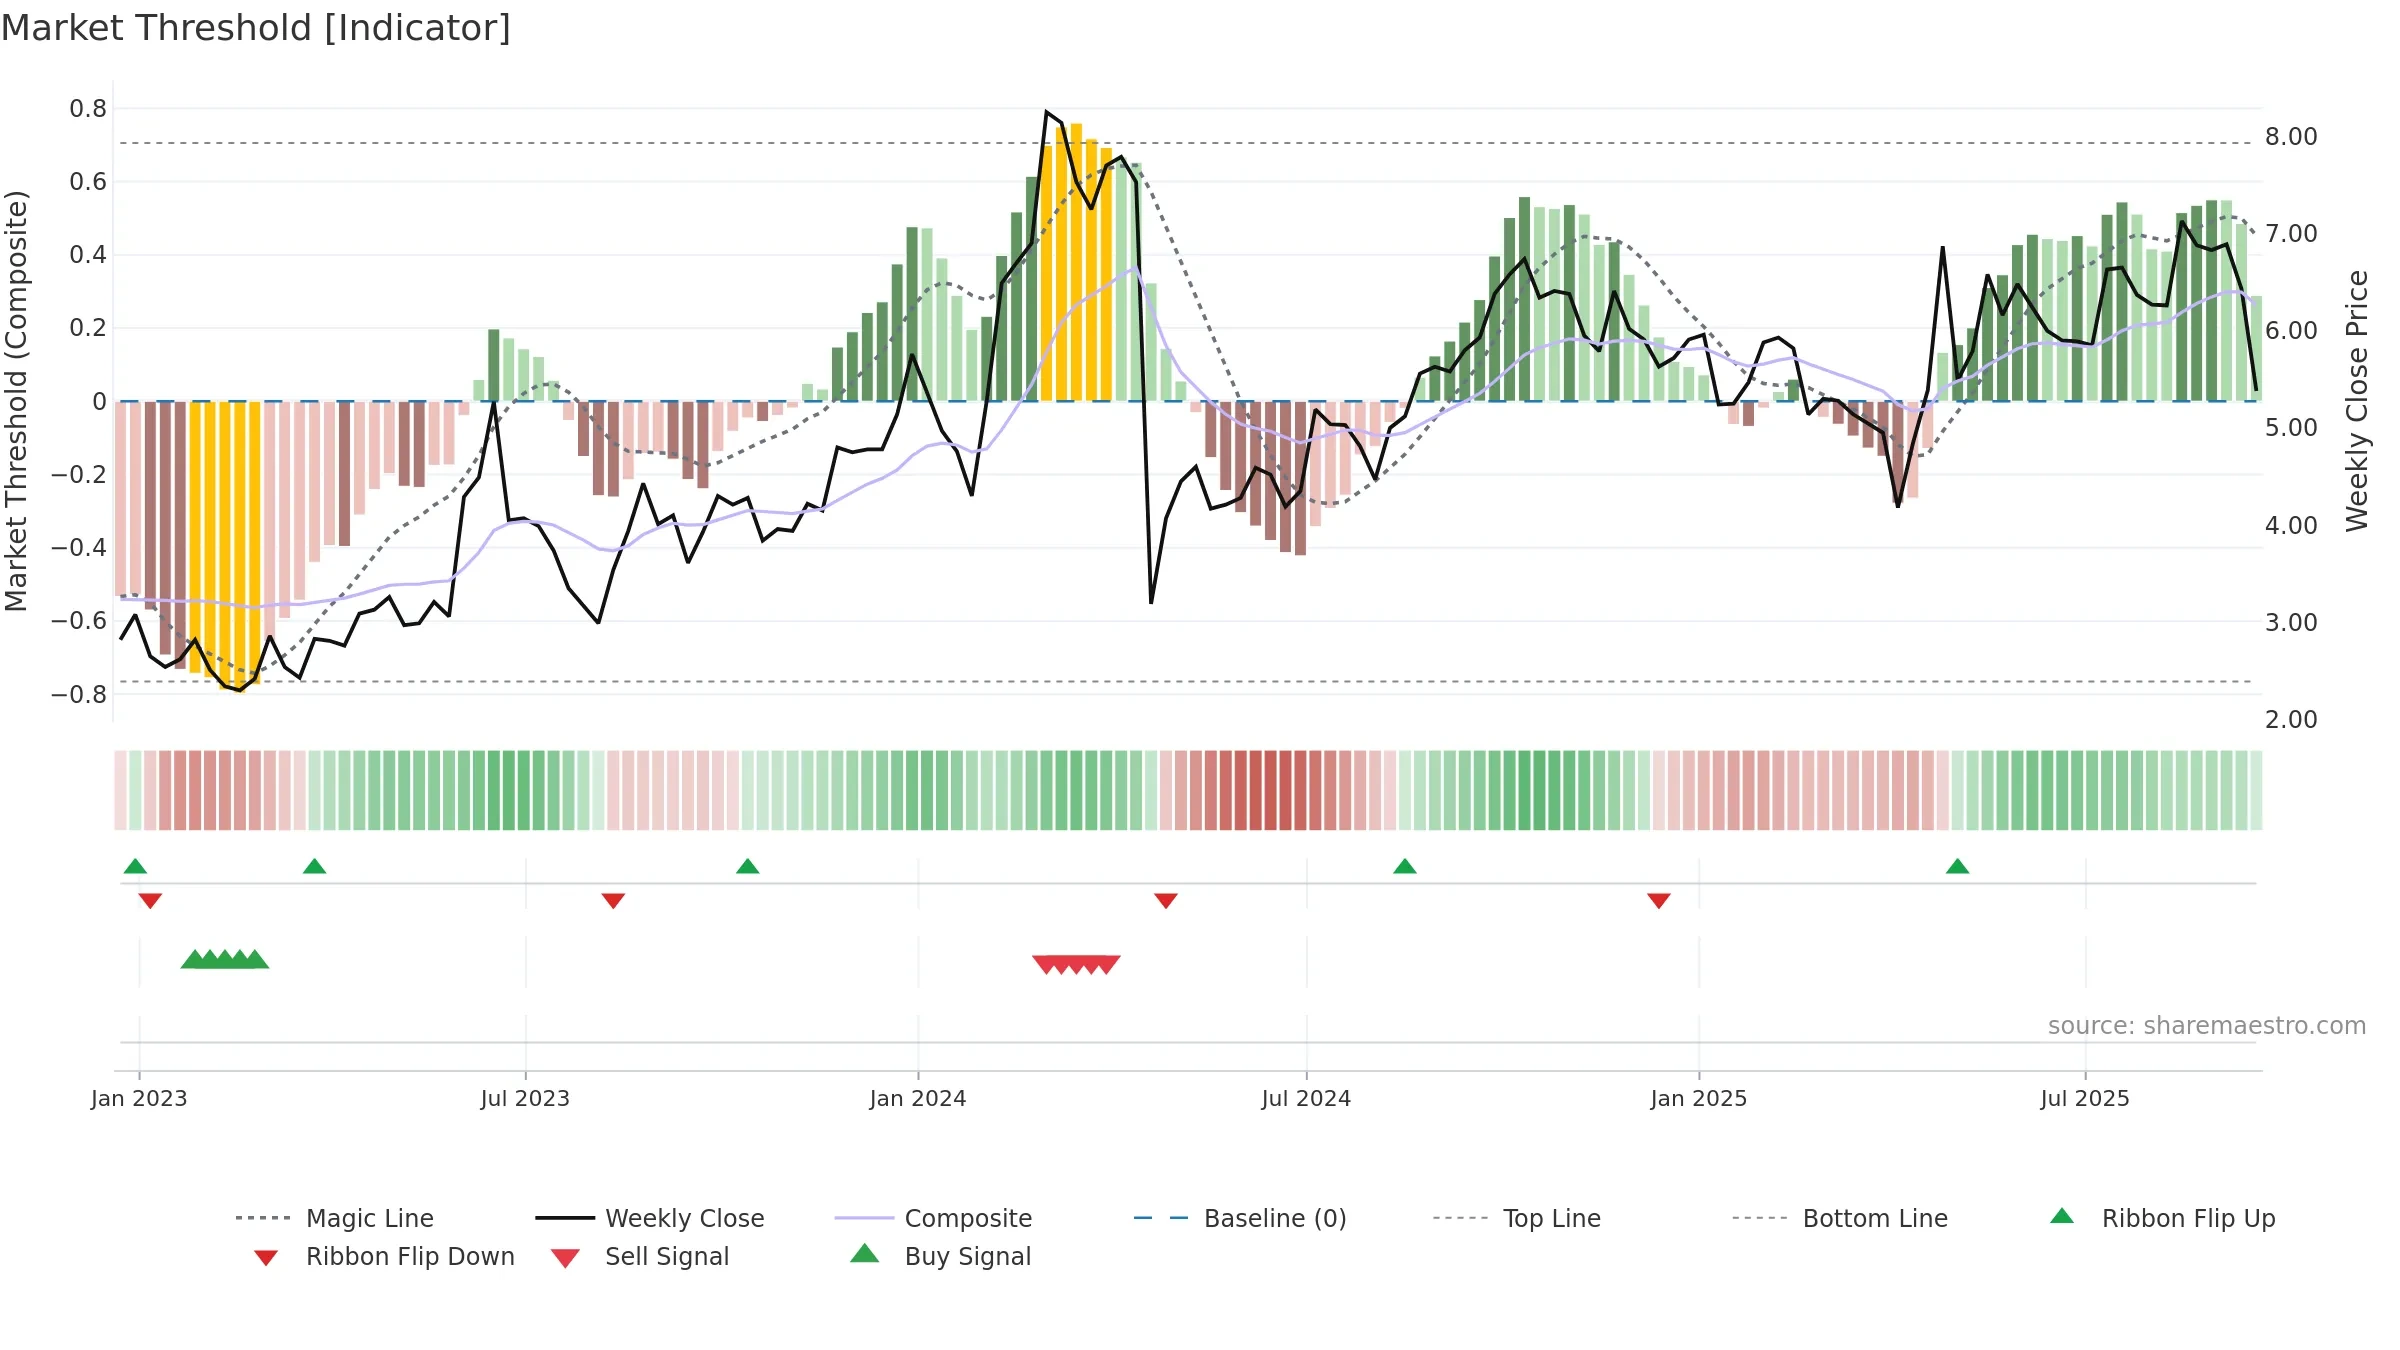
How to read this — Gauge is elevated but momentum is rolling over; topping risk is rising. Notable breakdown from ≥0.80 weakens trend quality.
Stay alert: protect gains or seek confirmation before adding risk.
Conclusion
Neutral setup. ★★★☆☆ confidence. Price window: -14. Trend: Uptrend at Risk; gauge 75. In combination, liquidity confirms the move.
- Momentum is bullish and rising
- Liquidity confirms the price trend
- High-level but rolling over (topping risk)
- Price is not above key averages
- Negative multi-week performance
- Recent breakdown from ≥0.80 weakens trend quality
Why: Price window -14.19% over 8w. Close is -24.54% below the prior-window high. Return volatility 2.09%. Volume trend falling. Liquidity convergence with price. Trend state uptrend at risk. 4–8w crossover bearish. Momentum bullish and rising.
Tip: Most metrics include a hover tooltip where they appear in the report.