Ping An Insurance (Group) Company of China, Ltd.
601318 SHA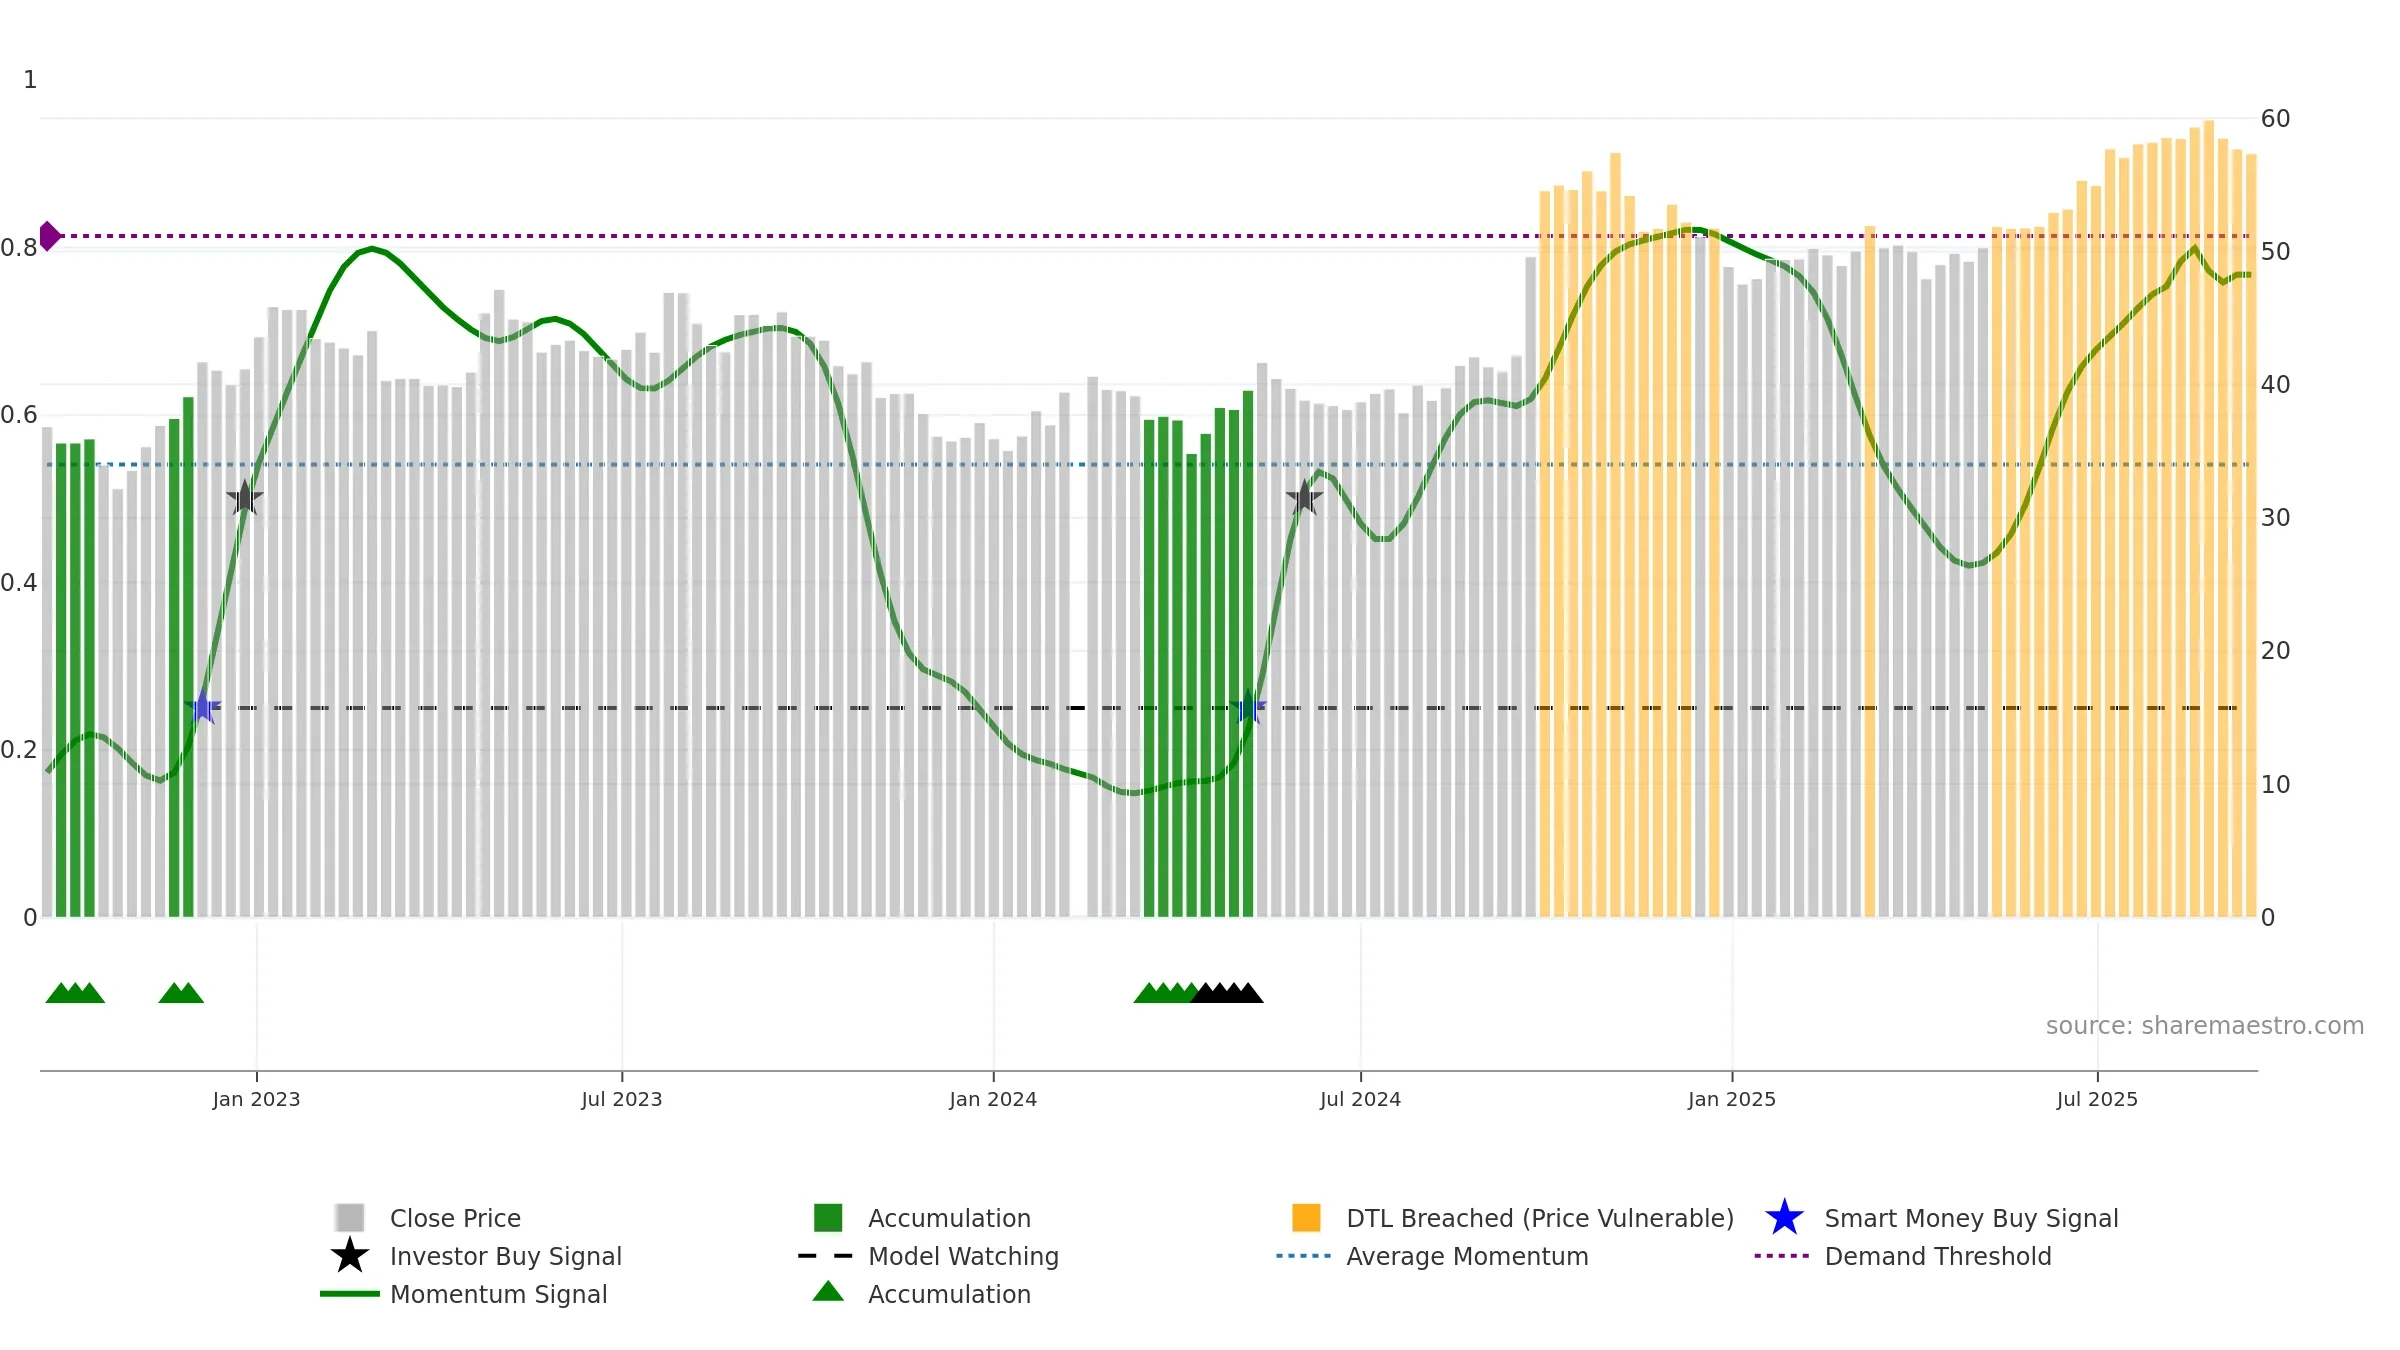
Weekly Report
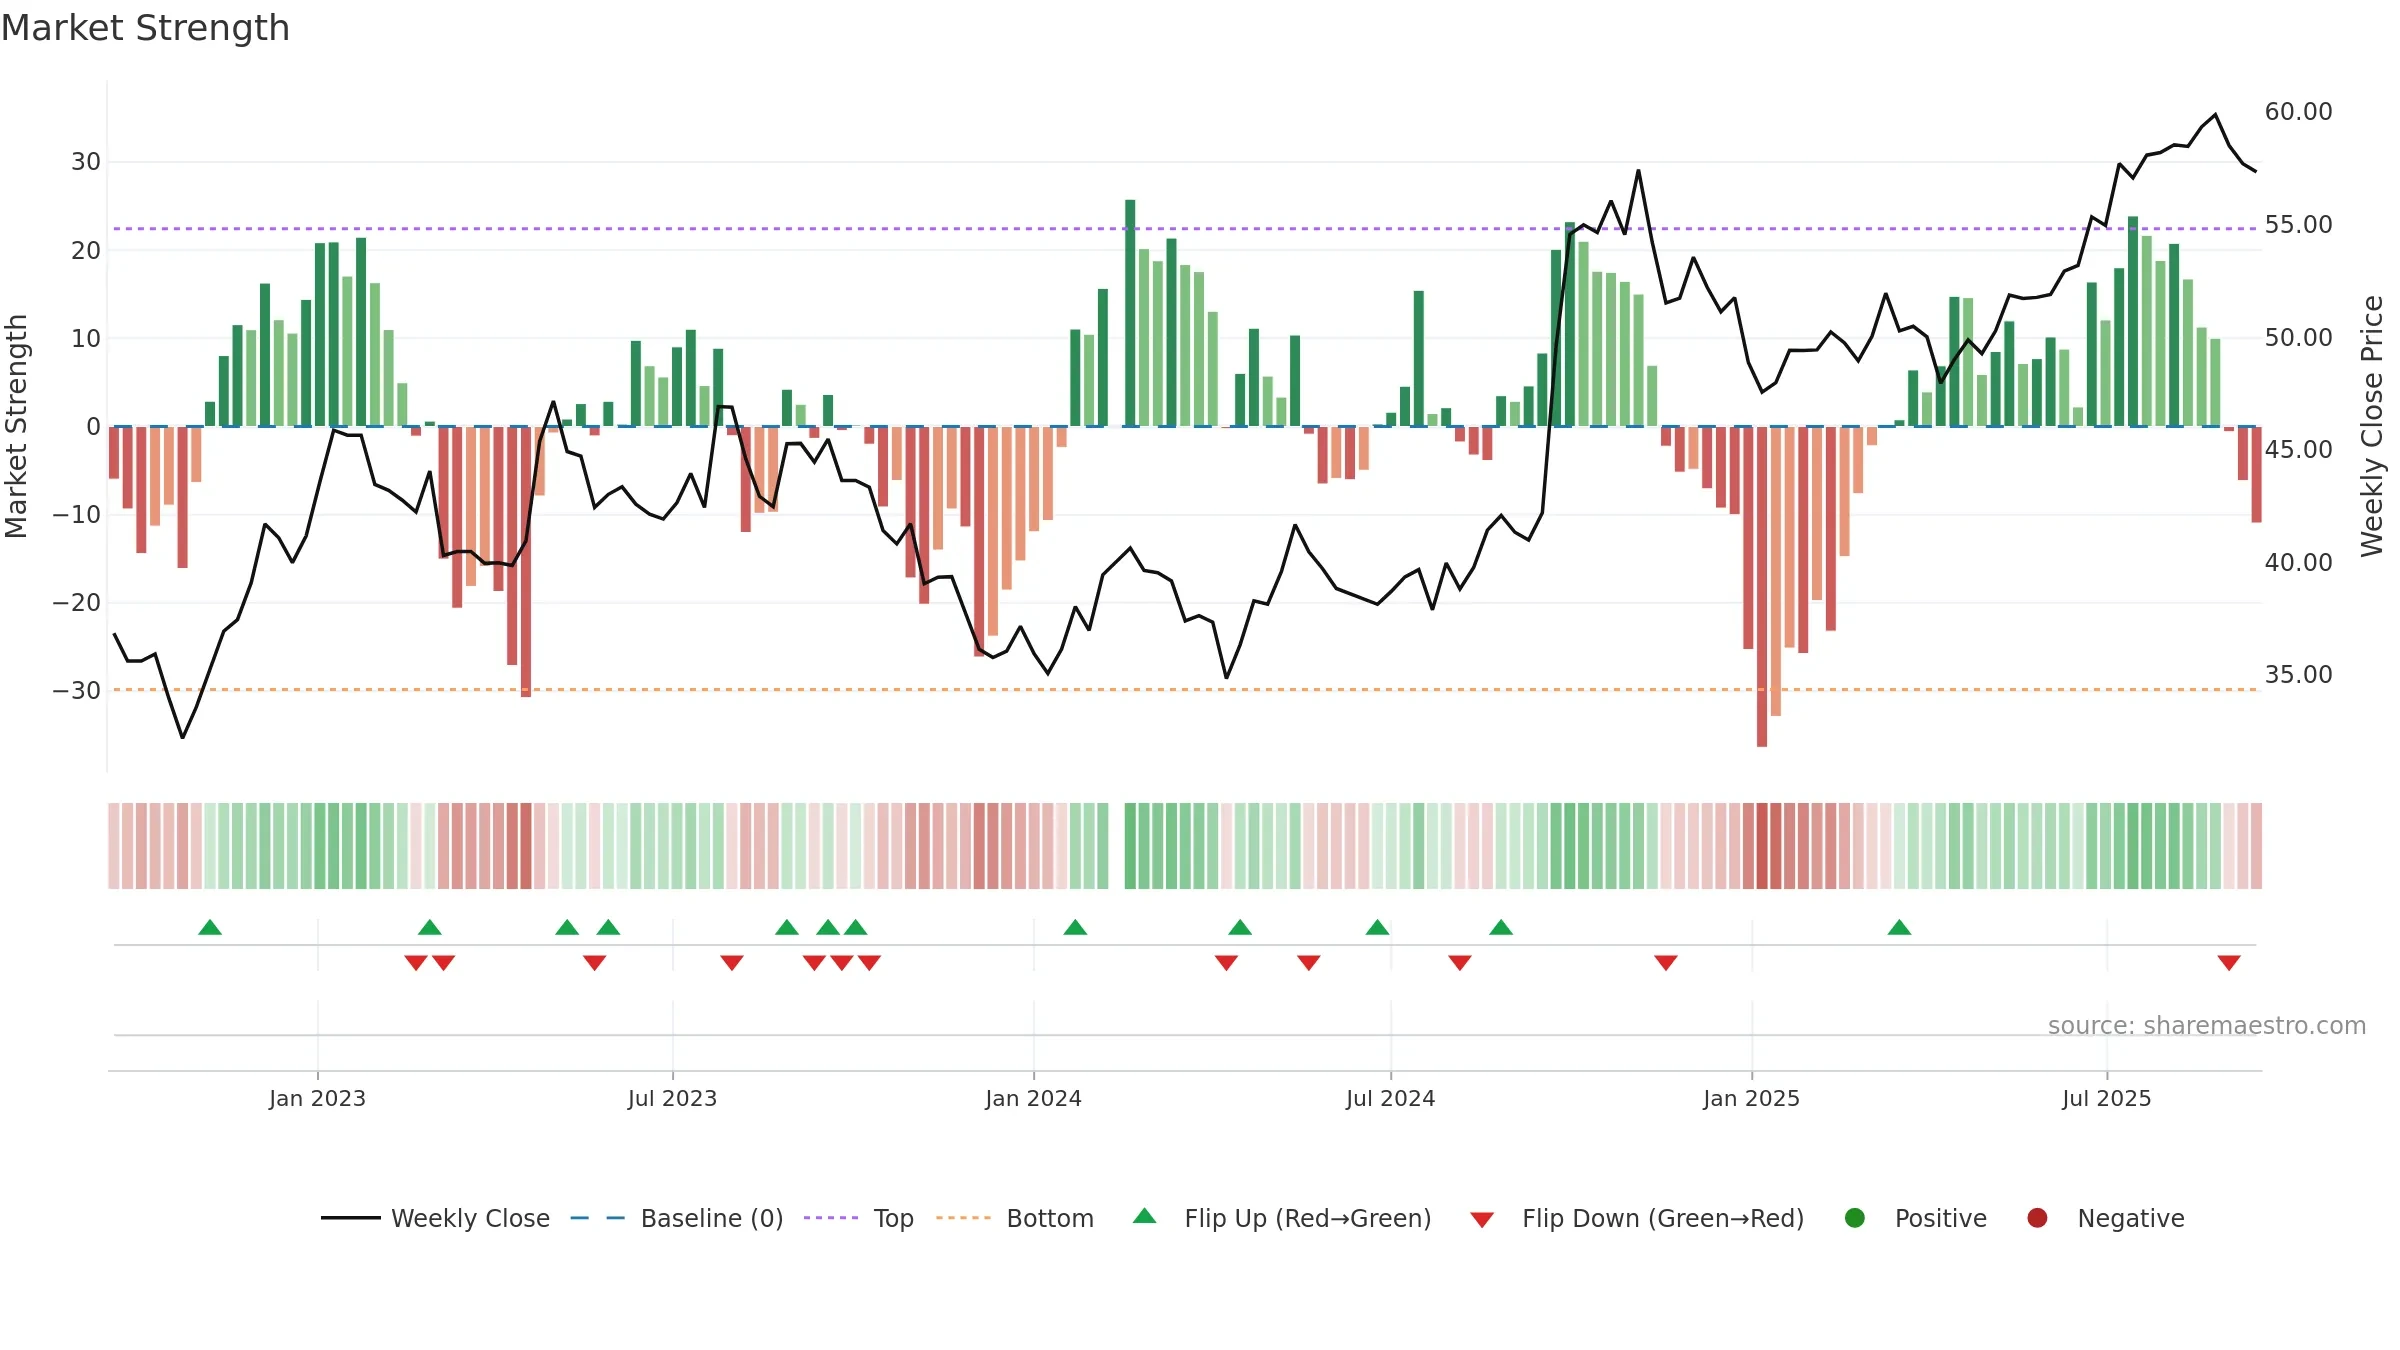
Ping An Insurance (Group) Company of China, Ltd. closed at 57.3300 (-0.56% WoW) . Data window ends Mon, 15 Sep 2025.
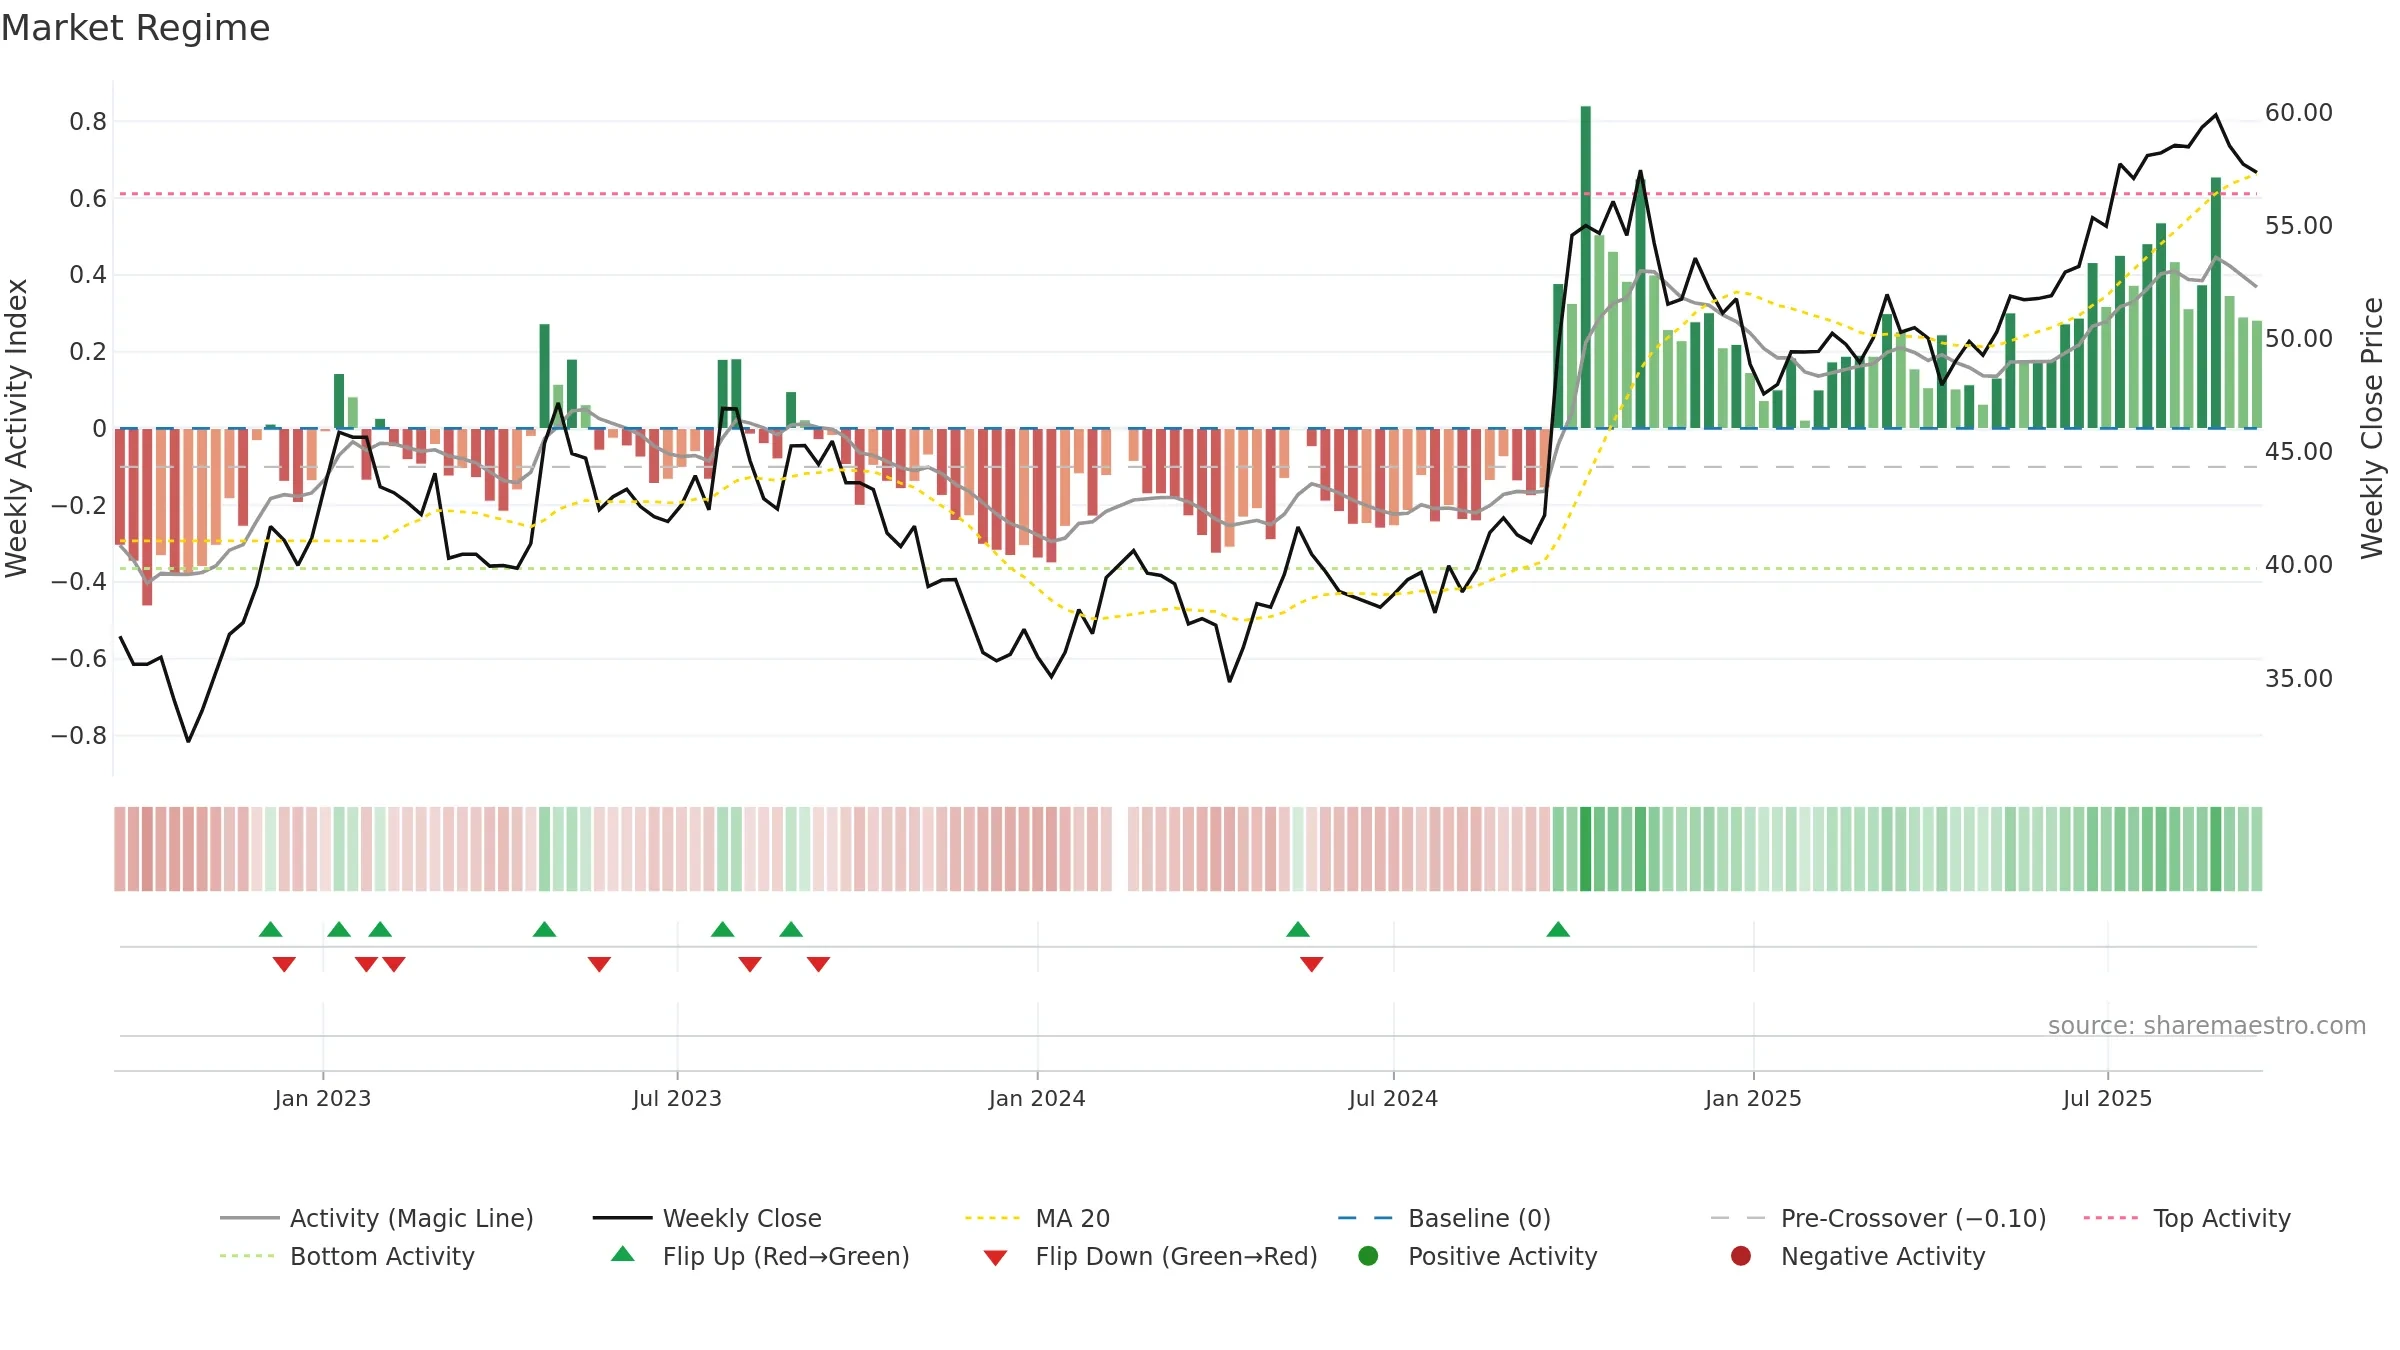
How to read this — Price slope is downward, indicating persistent supply pressure. Low weekly volatility favours steadier follow-through. Volume and price are moving in the same direction — a constructive confirmation. Fresh short-term downside crossover weakens near-term tone.
Down-slope argues for patience; rallies can fade sooner unless participation improves.
Gauge maps the trend signal to a 0–100 scale.
How to read this — Gauge is elevated but momentum is rolling over; topping risk is rising.
Stay alert: protect gains or seek confirmation before adding risk.
Price is below fair value; potential upside if momentum constructive.
Conclusion
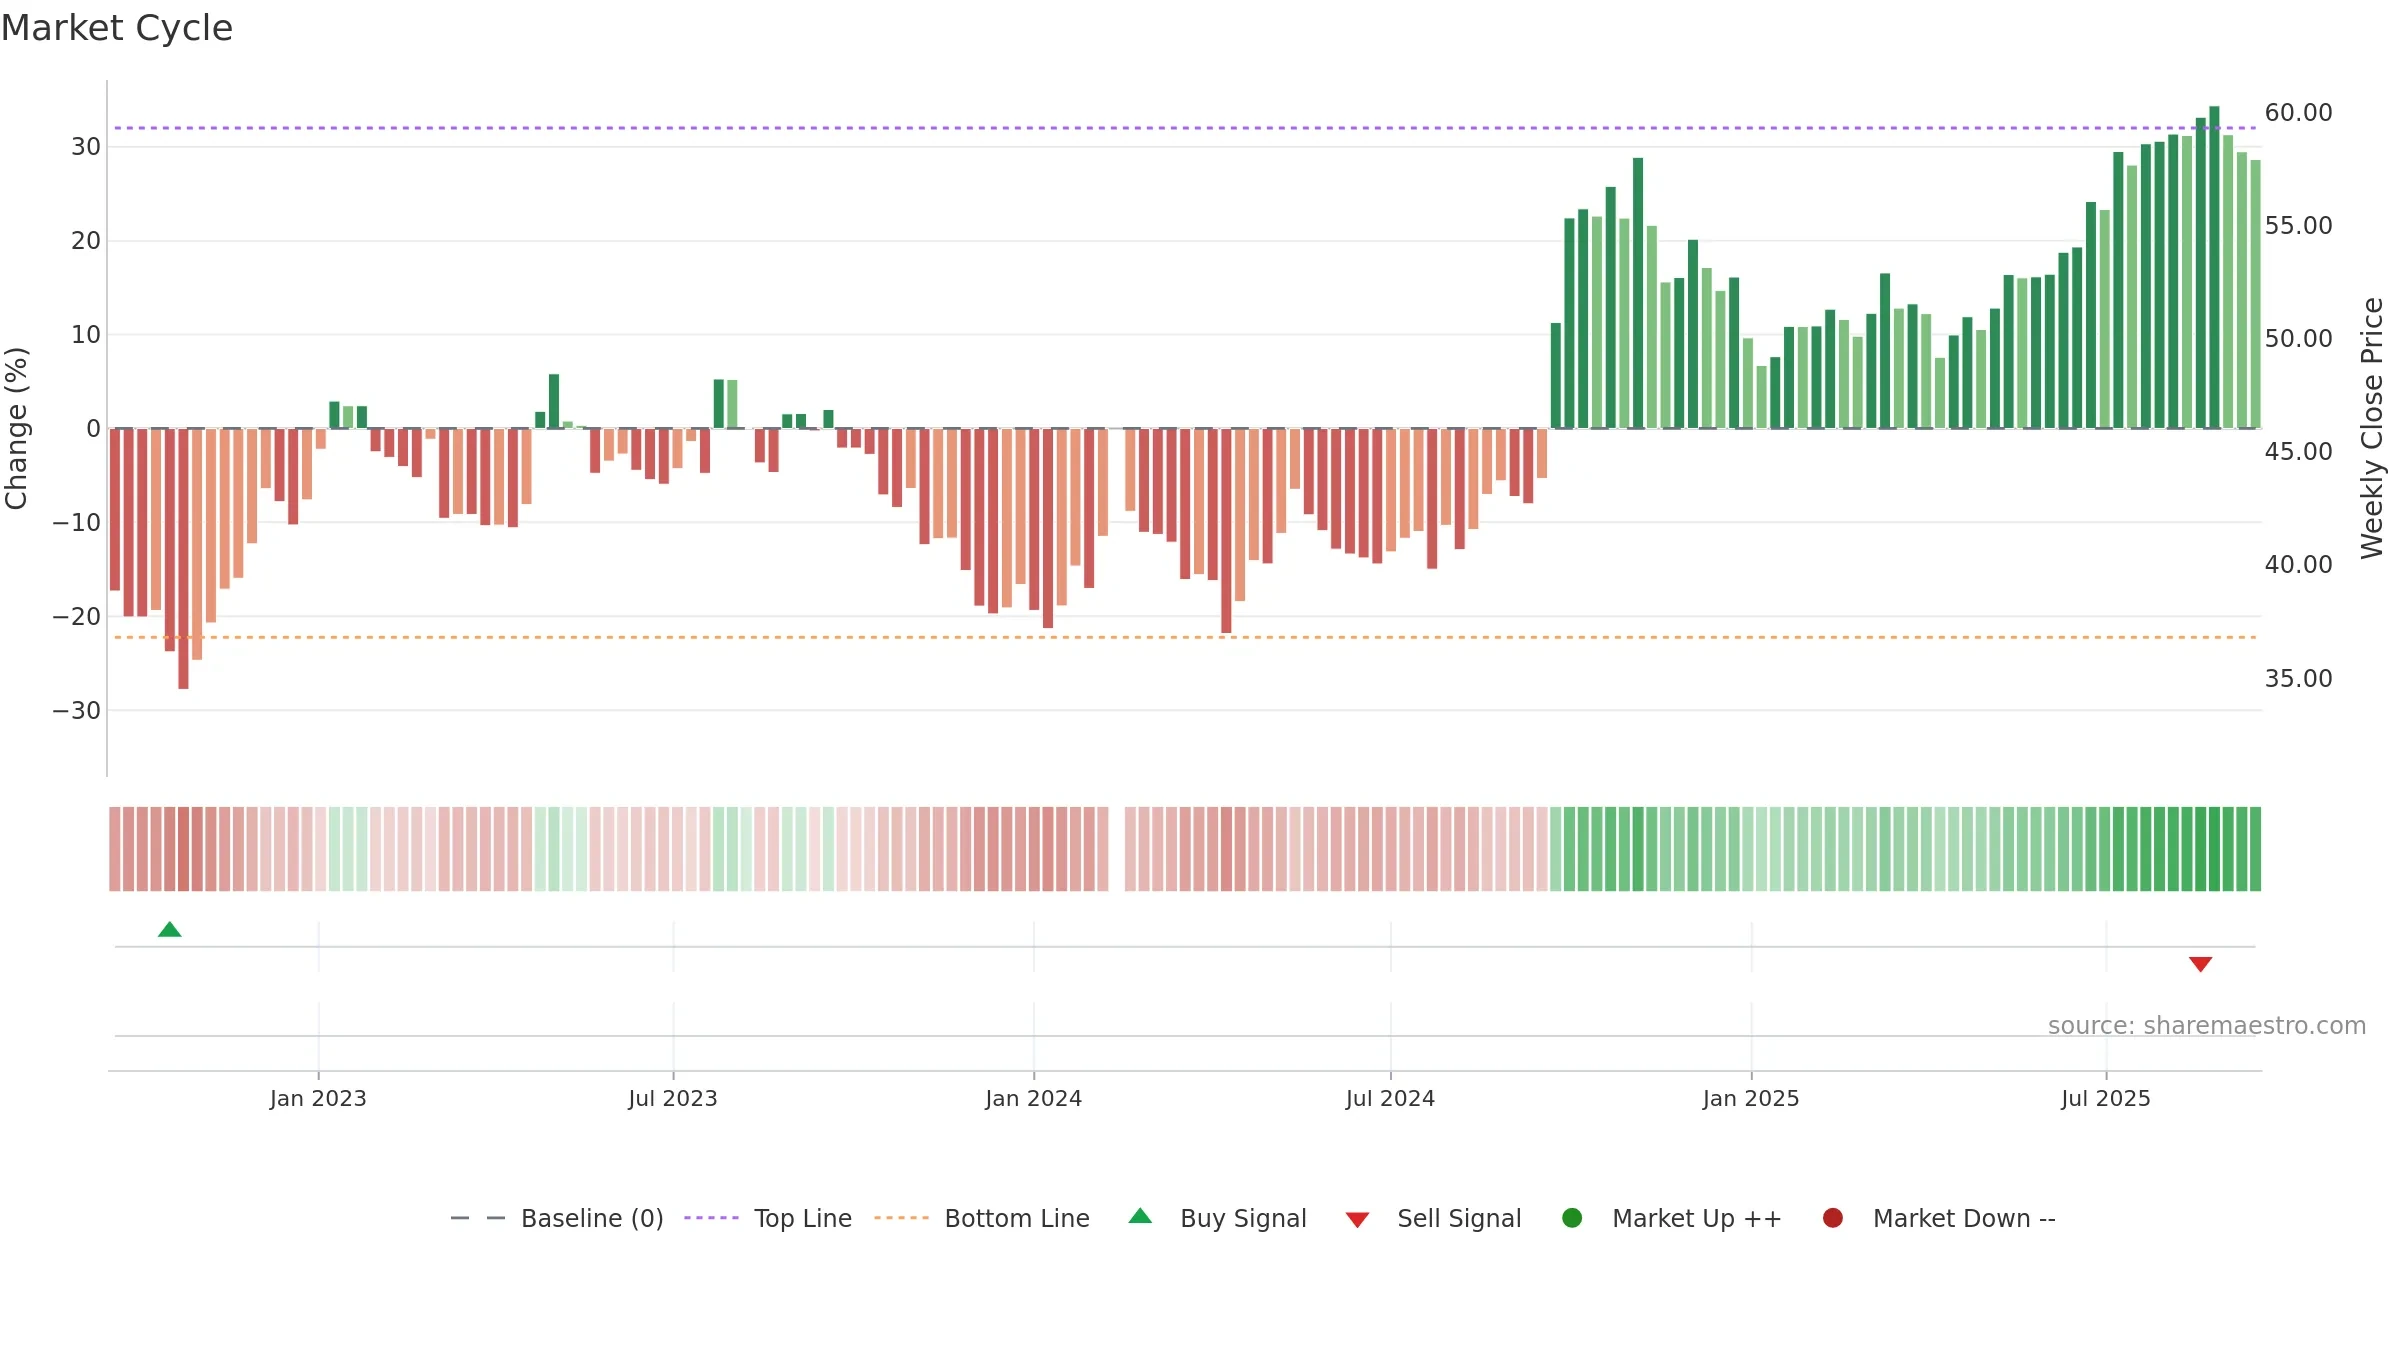
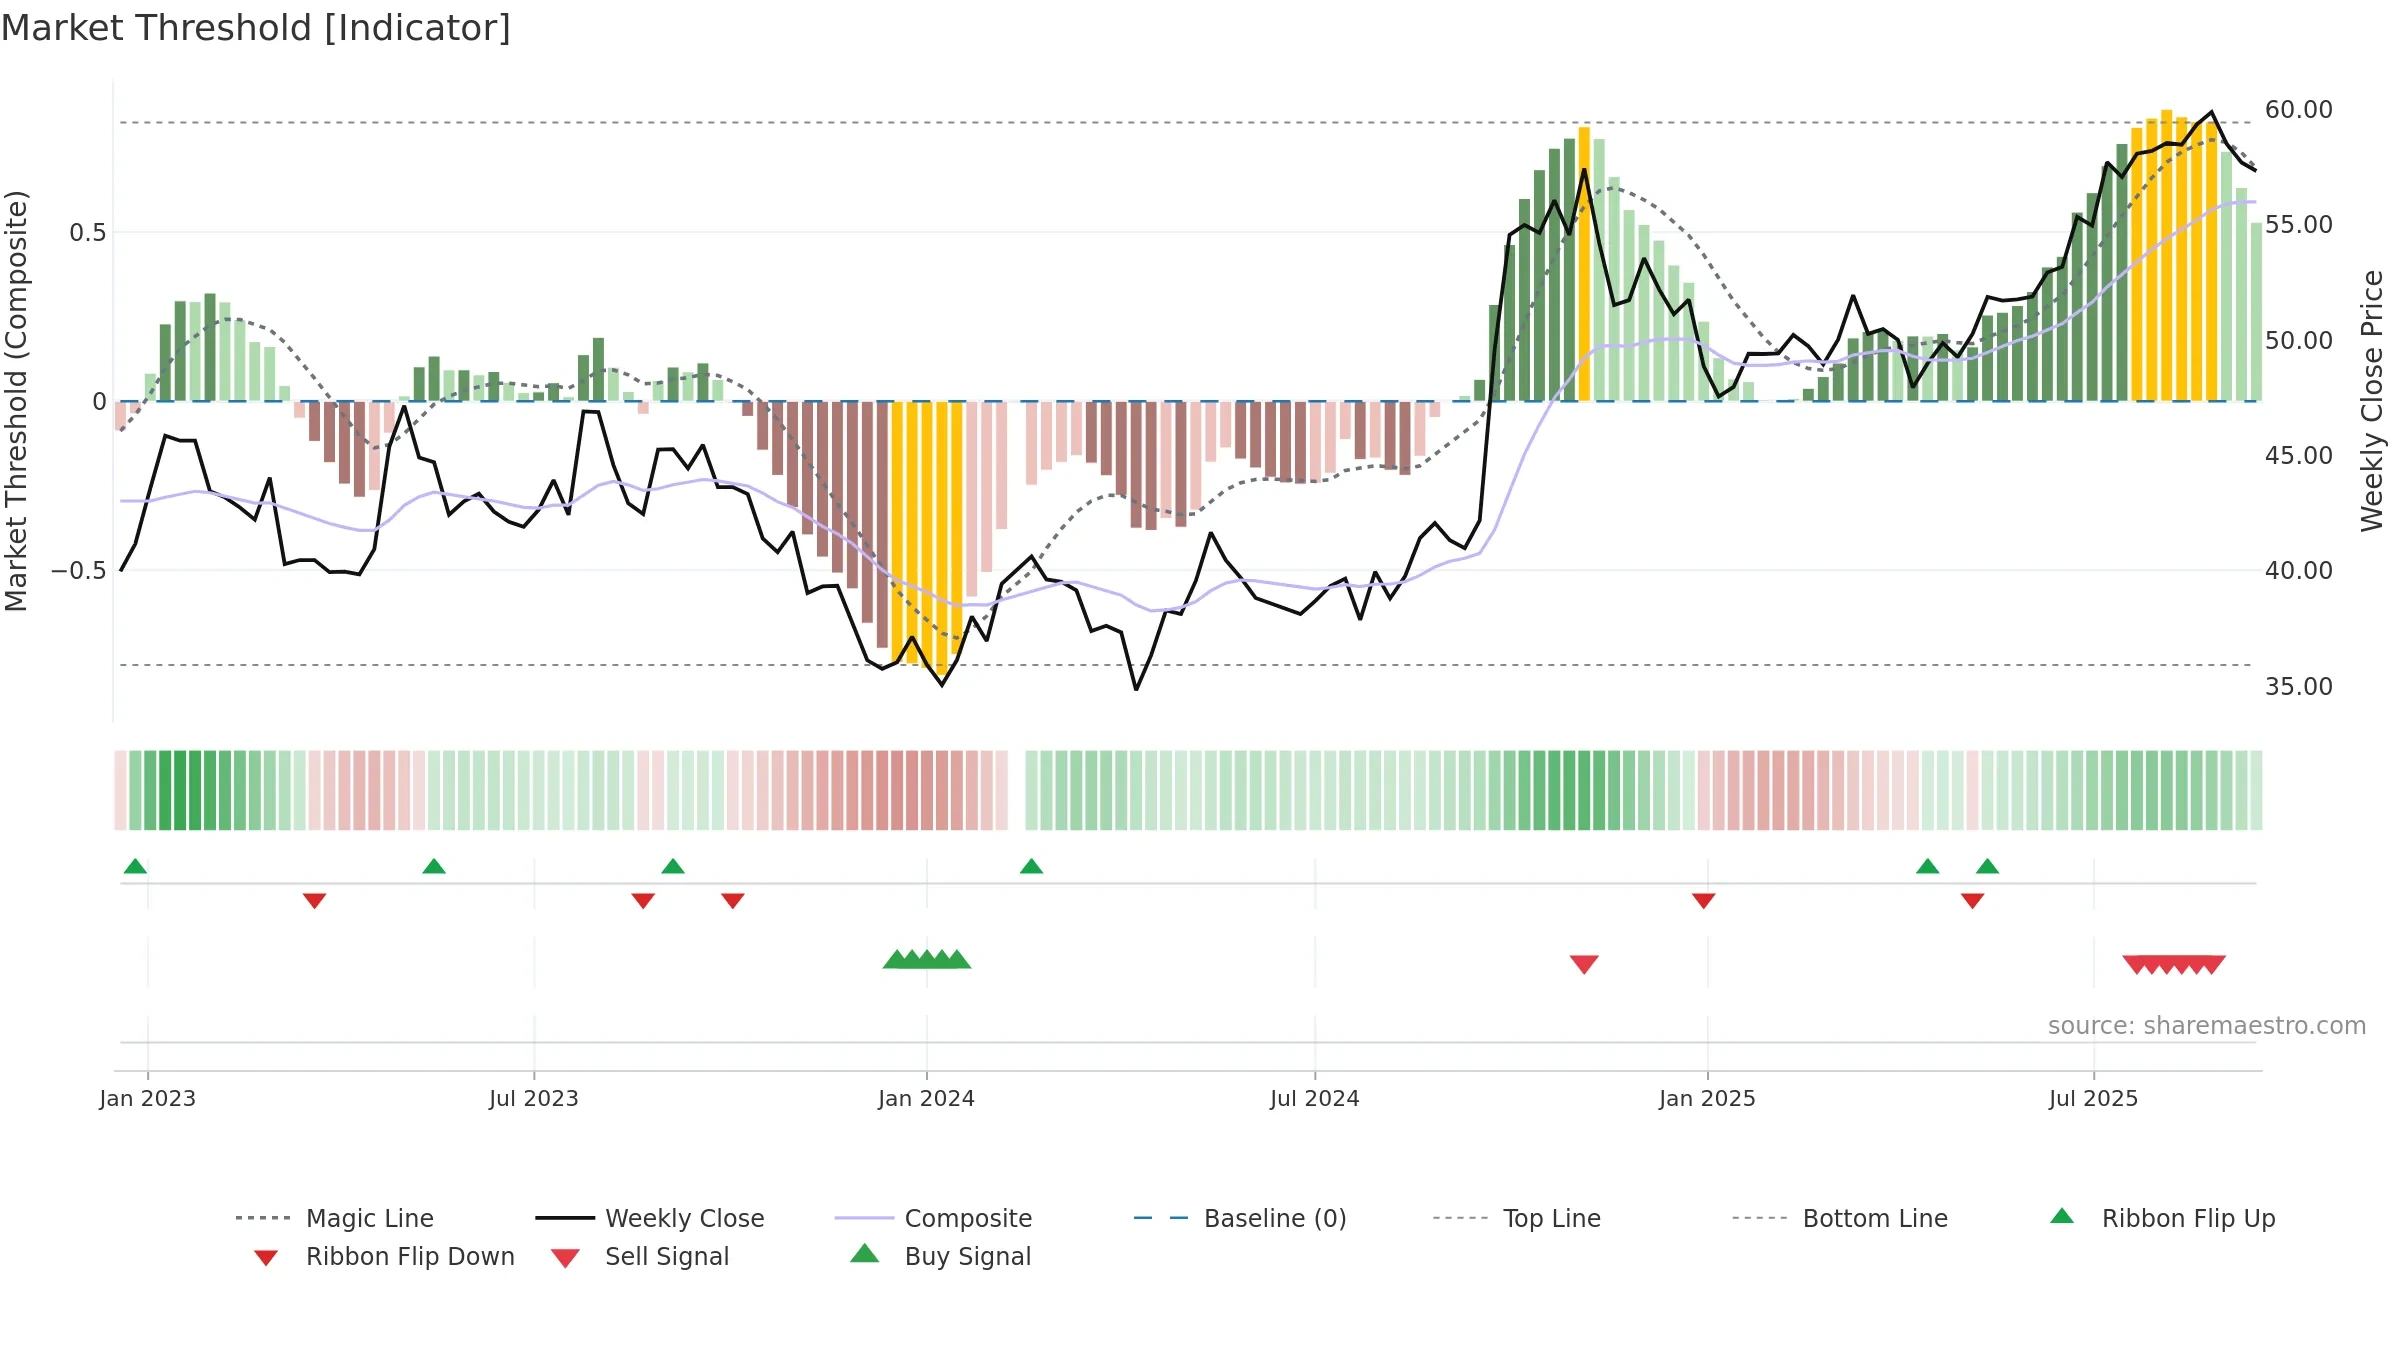
Neutral setup. ★★★☆☆ confidence. Price window: -1. Trend: Uptrend at Risk; gauge 76. In combination, liquidity confirms the move.
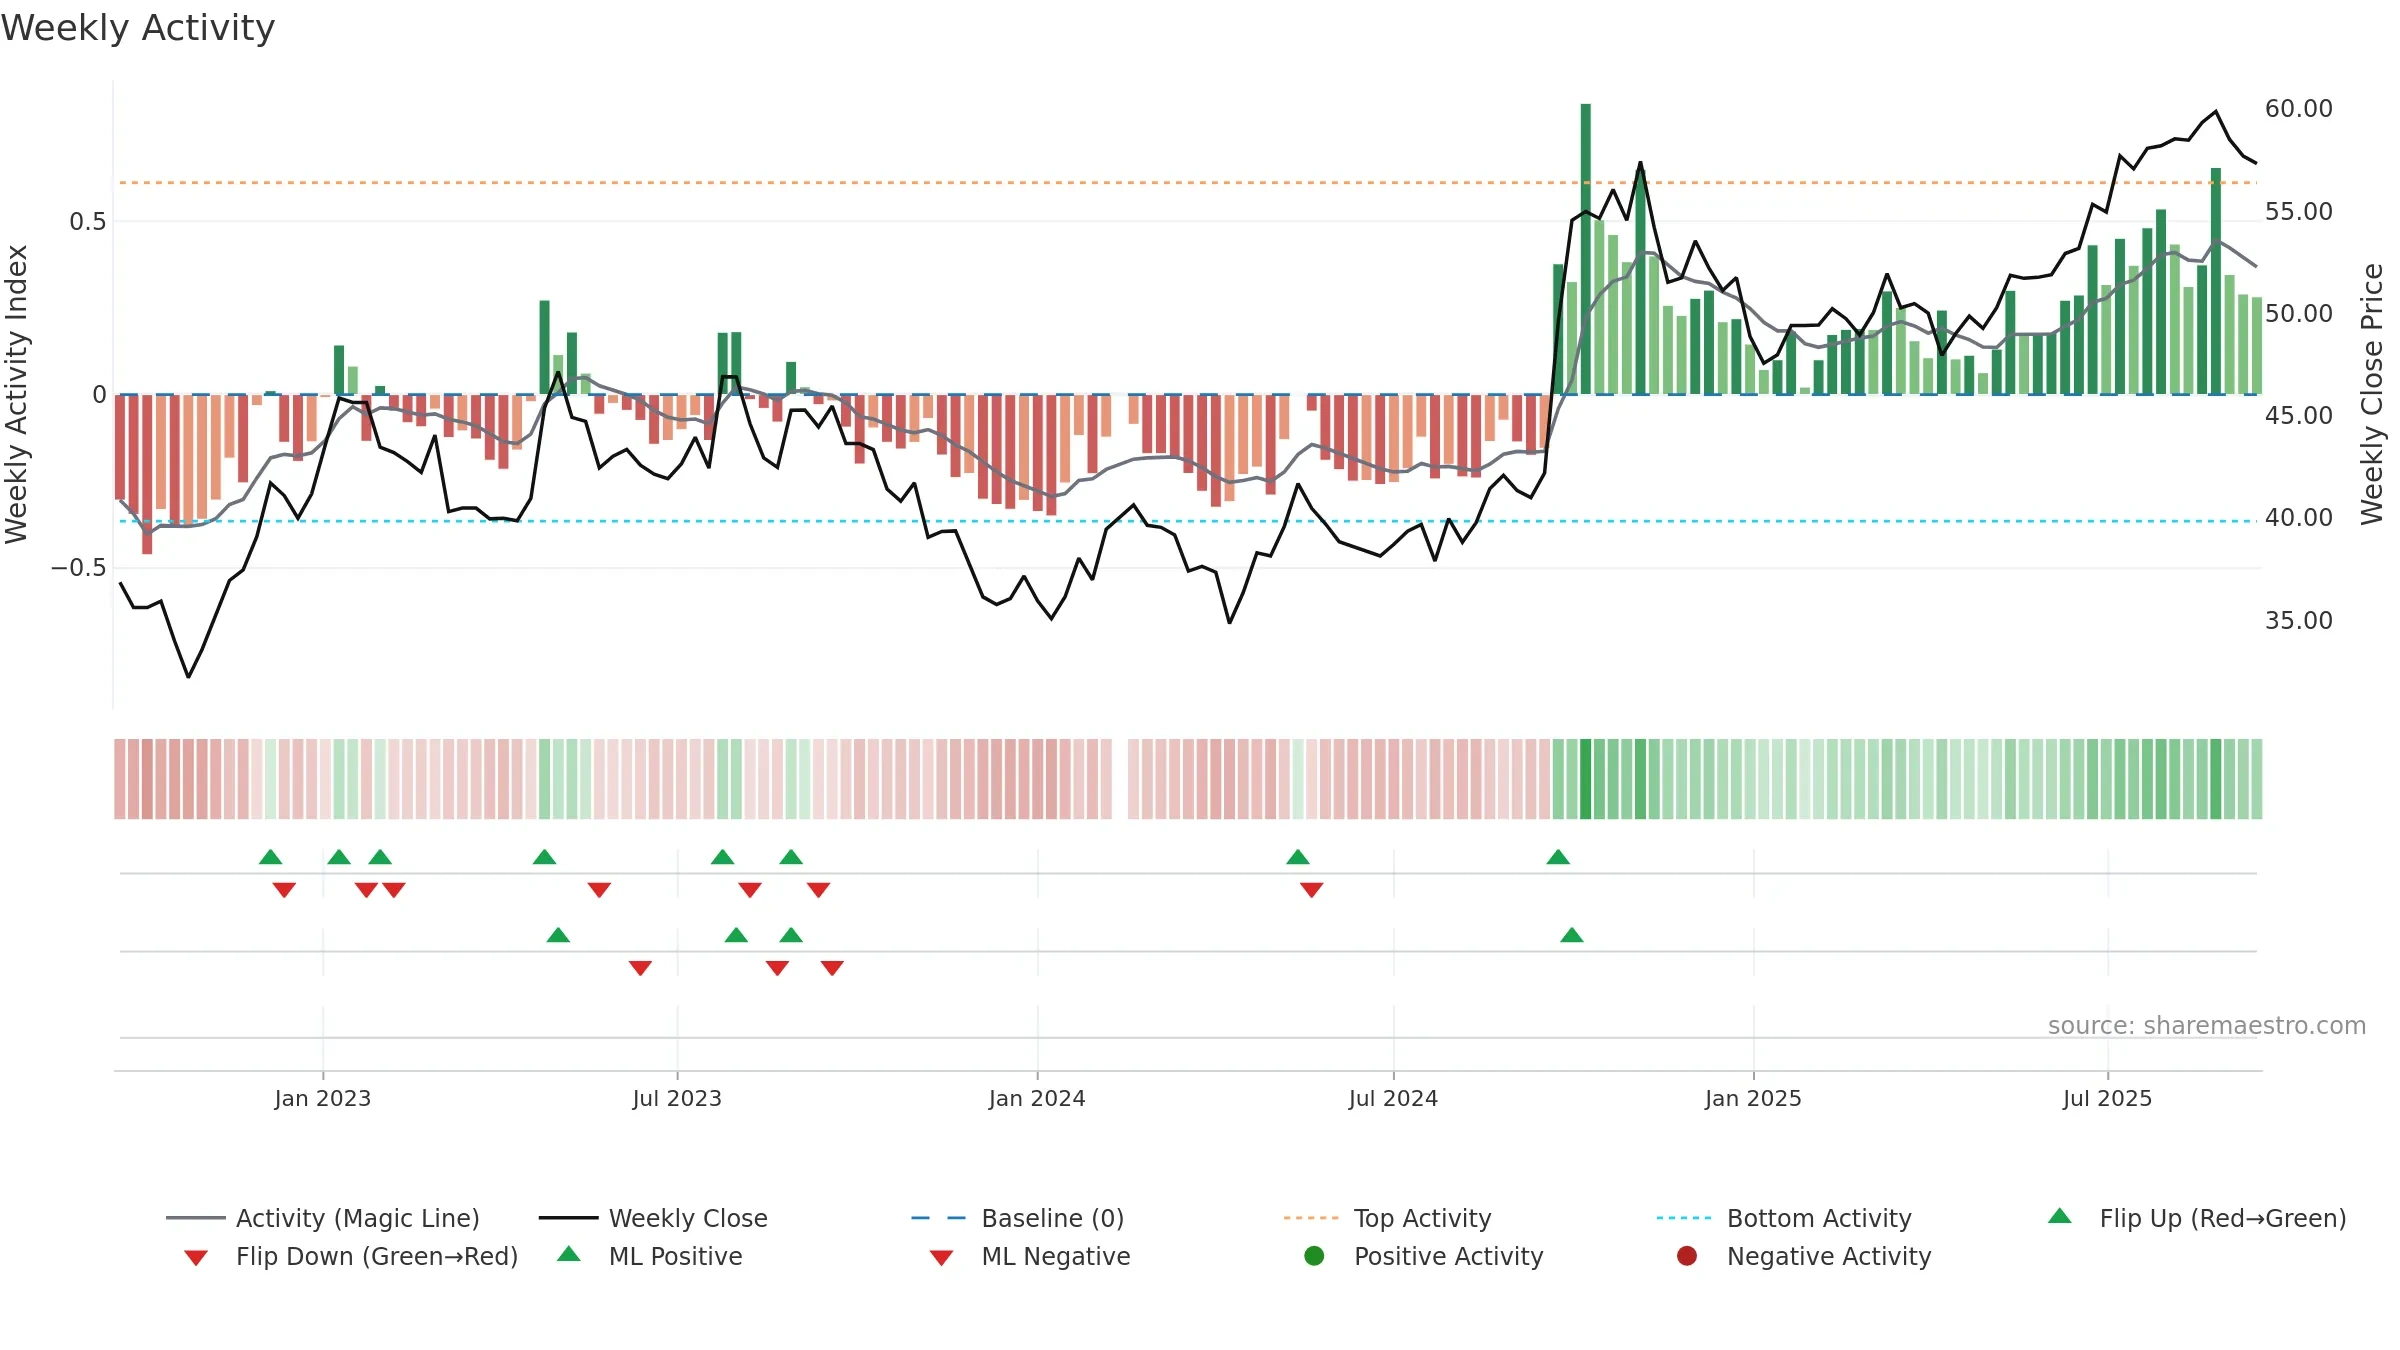
- Momentum is bullish and rising
- Liquidity confirms the price trend
- Low return volatility supports durability
- High-level but rolling over (topping risk)
- Price is not above key averages
- Negative multi-week performance
Why: Price window -1.49% over 8w. Close is -4.26% below the prior-window high. Return volatility 0.82%. Volume trend falling. Liquidity convergence with price. Trend state uptrend at risk. 4–8w crossover bearish. Momentum bullish and rising. Valuation supportive skew.
Tip: Most metrics include a hover tooltip where they appear in the report.