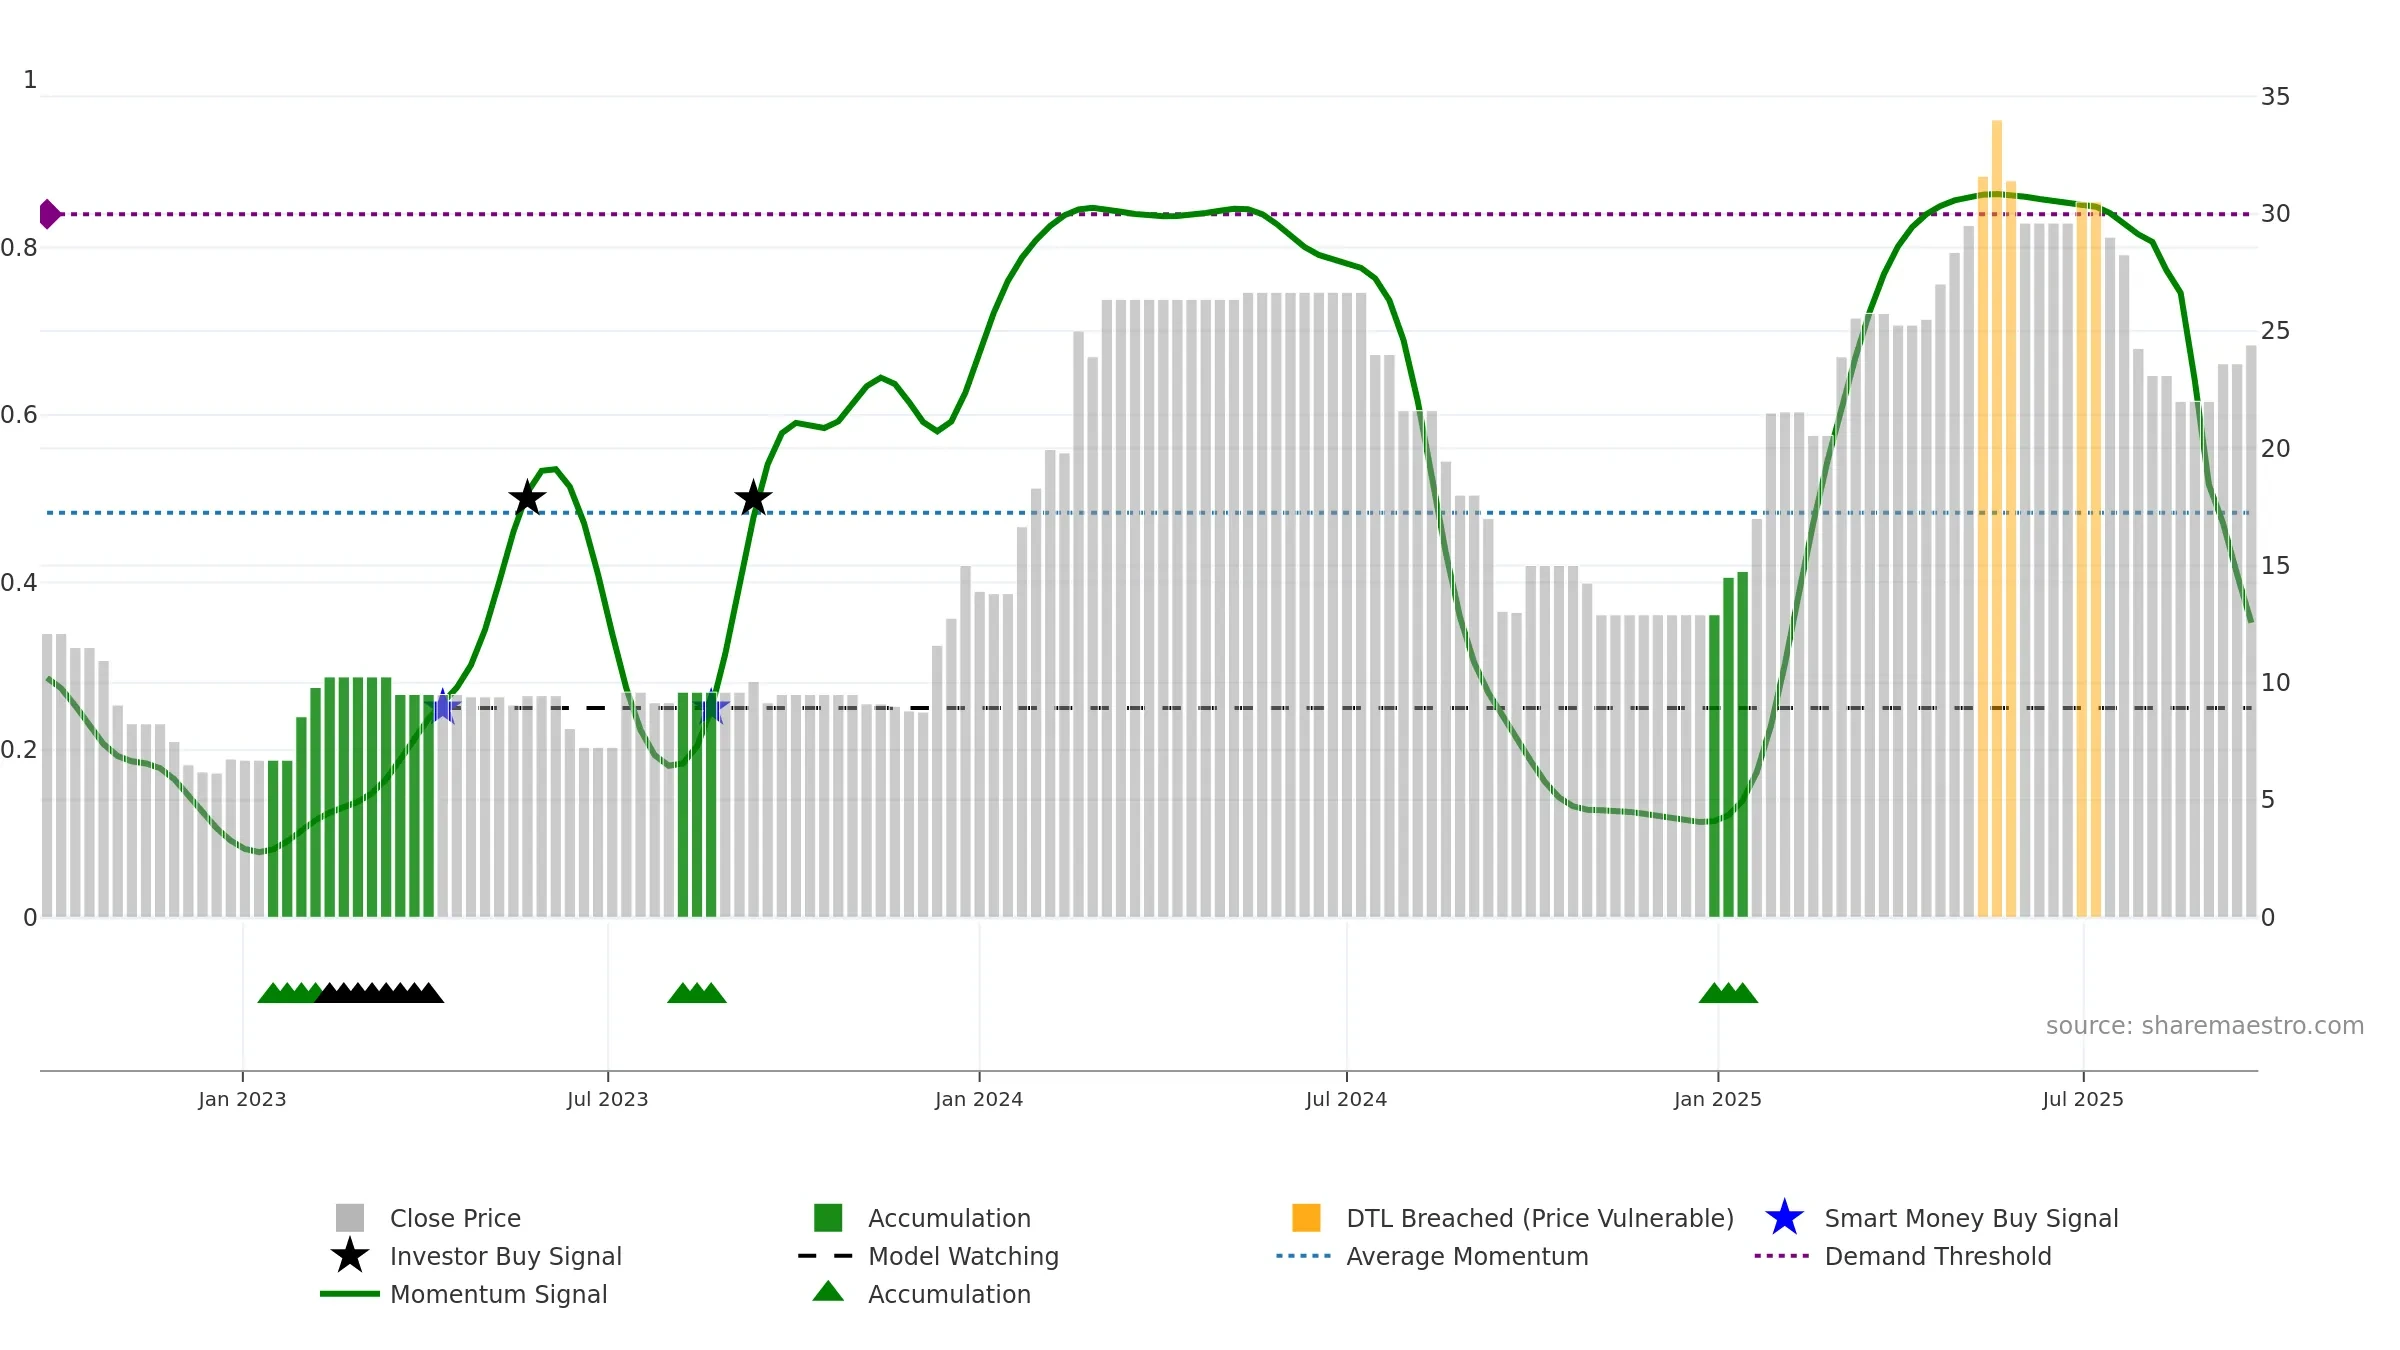
No results found.


Week Ending
Mon, 22 Sep 2025
Open
24.4000
Close
24.4000
High
24.4000
Low
24.4000
Trend
0.35177
Rating
★⯪☆☆☆
Sharemaestro [Charts]
DRL weekly Smart Money chart, closing 2025-09-22.
DRL weekly Market Snapshot chart, closing 2025-09-22.
DRL weekly Market Cycle chart, closing 2025-09-22.
DRL weekly Market Demand chart, closing 2025-09-22.
DRL weekly Market Strength chart, closing 2025-09-22.
DRL weekly Activity chart, closing 2025-09-22.
DRL weekly Market Dynamics chart, closing 2025-09-22.
DRL weekly Market Threshold chart, closing 2025-09-22.

Weekly Summary

None (DRL) Week Ending: Mon, 22 Sep 2025 ★⯪☆☆☆
Weekly Report
Price
Weekly Close

None closed at 24.4000 (0.00% WoW) . Data window ends Mon, 22 Sep 2025.

Return Volatility1.57%
Vs w High3.39%
4–8 CrossoverBullish
What stands out

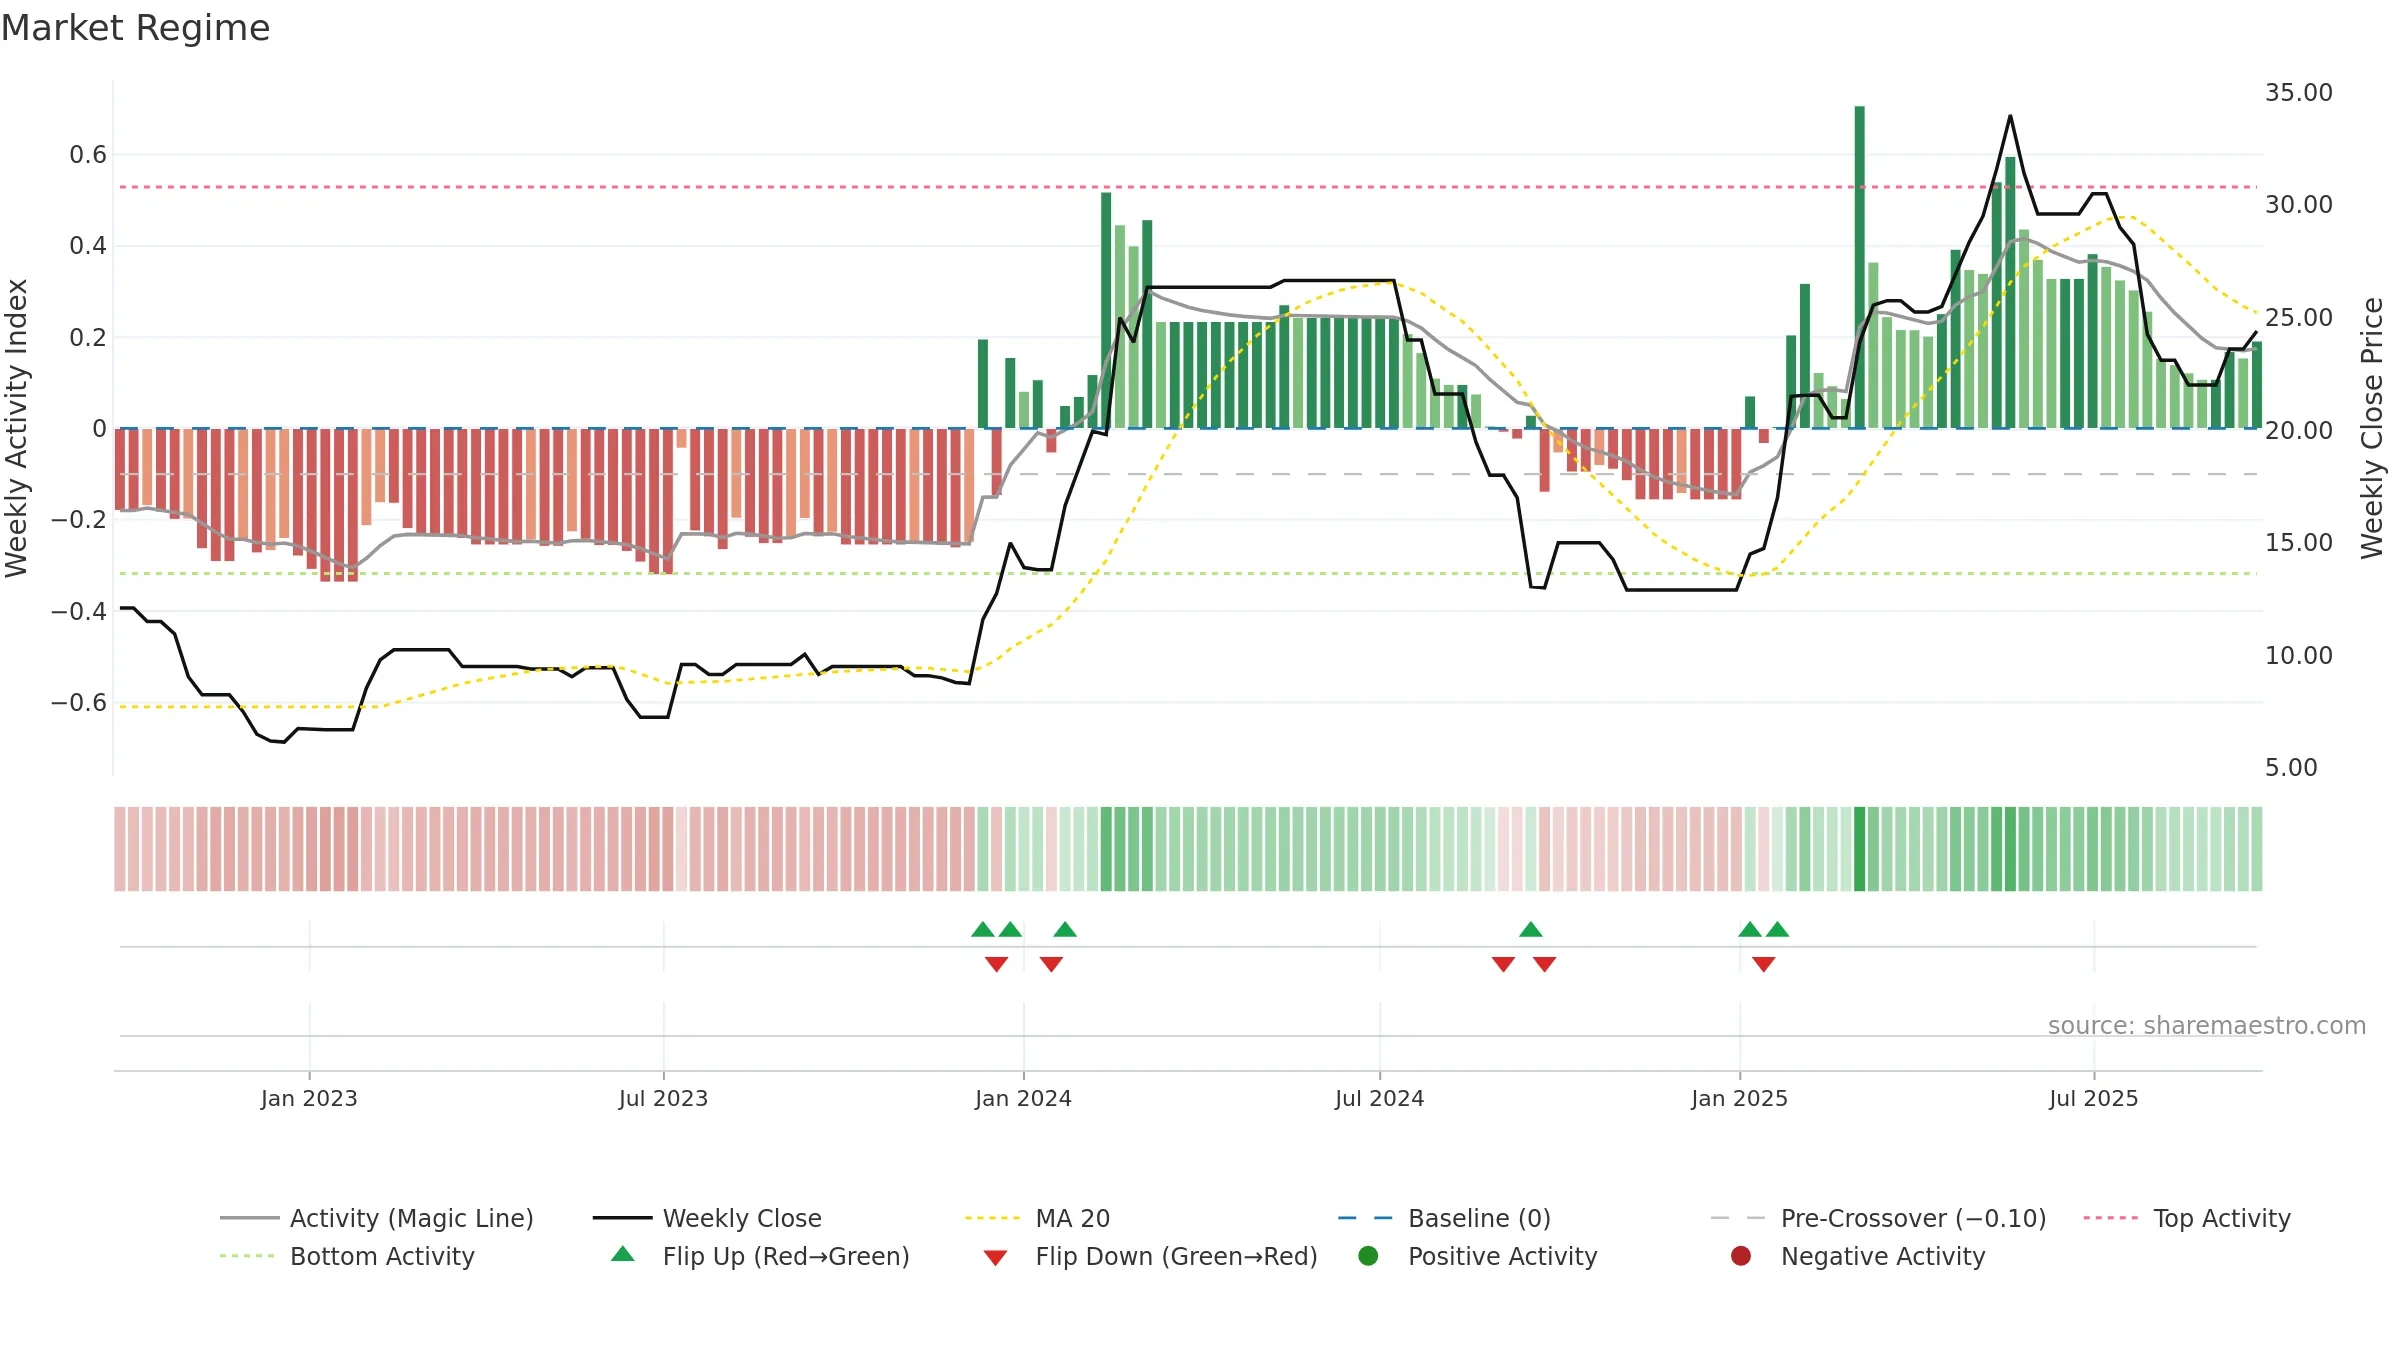
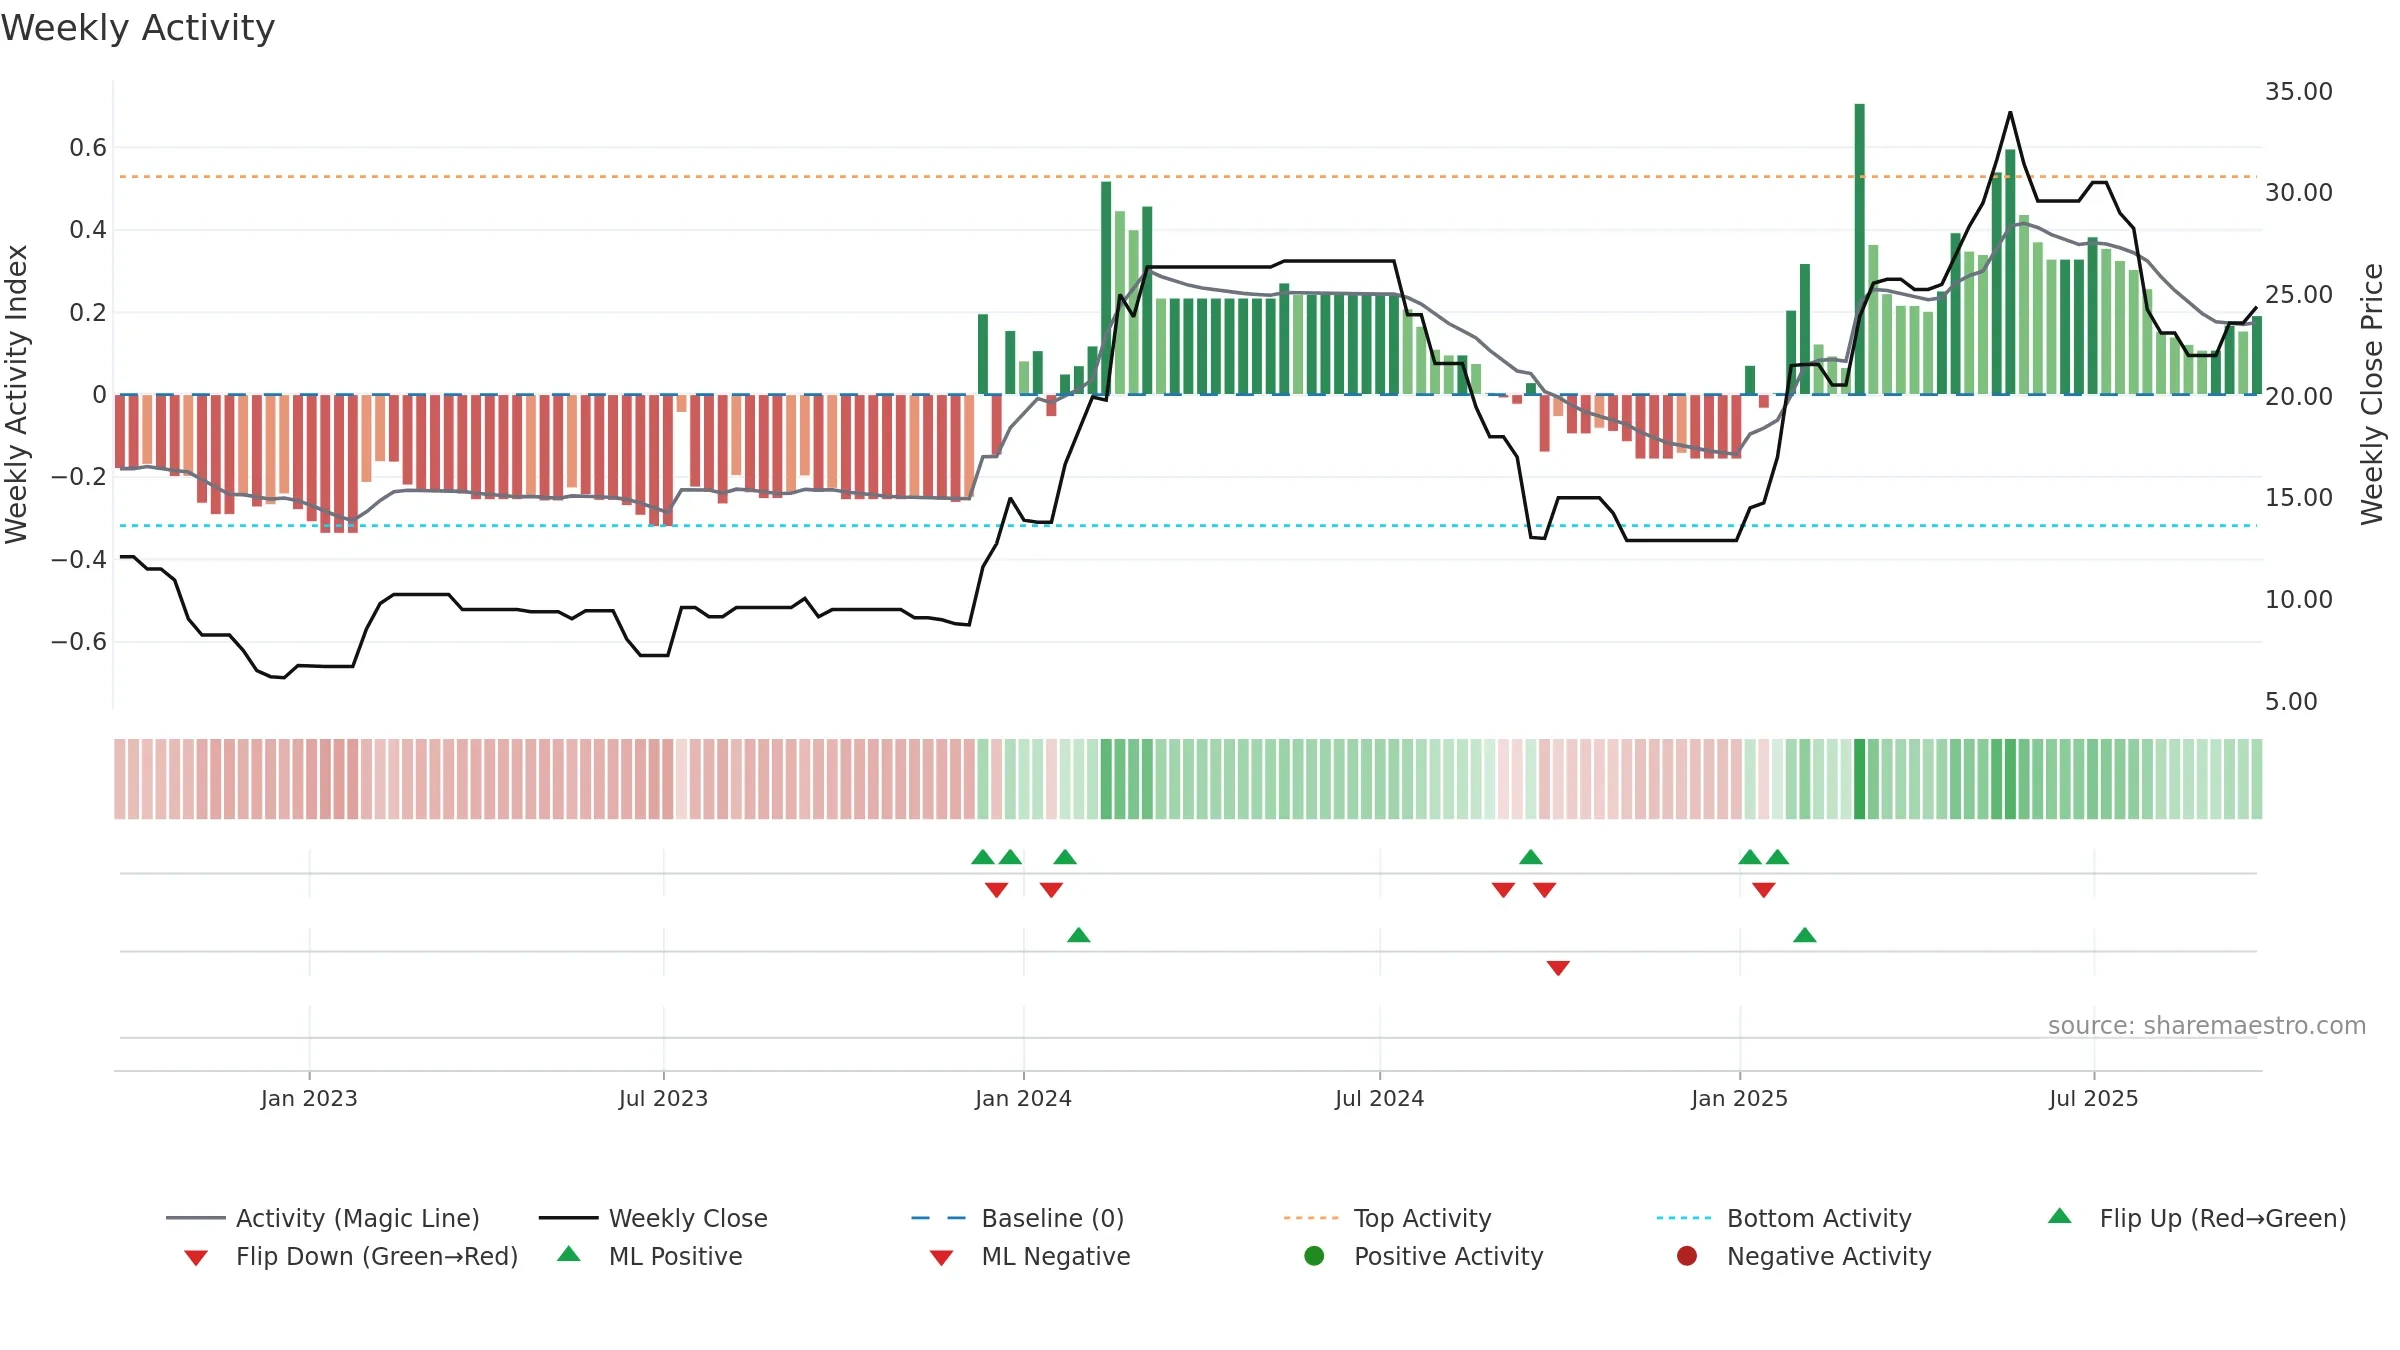
How to read this — Price slope is upward, indicating persistent buying over the window. Low weekly volatility favours steadier follow-through. Volume or price is flat; confirmation from liquidity is limited. Returns are negatively correlated with volume — strength may come on lighter activity. Distance to baseline is narrowing — reverting closer to its fair-value track. Fresh short-term crossover improves near-term tone.

What to watch

Up-slope supports buying interest; pullbacks may be contained if activity stays firm.

Trend
Sharemaestro Trend Line

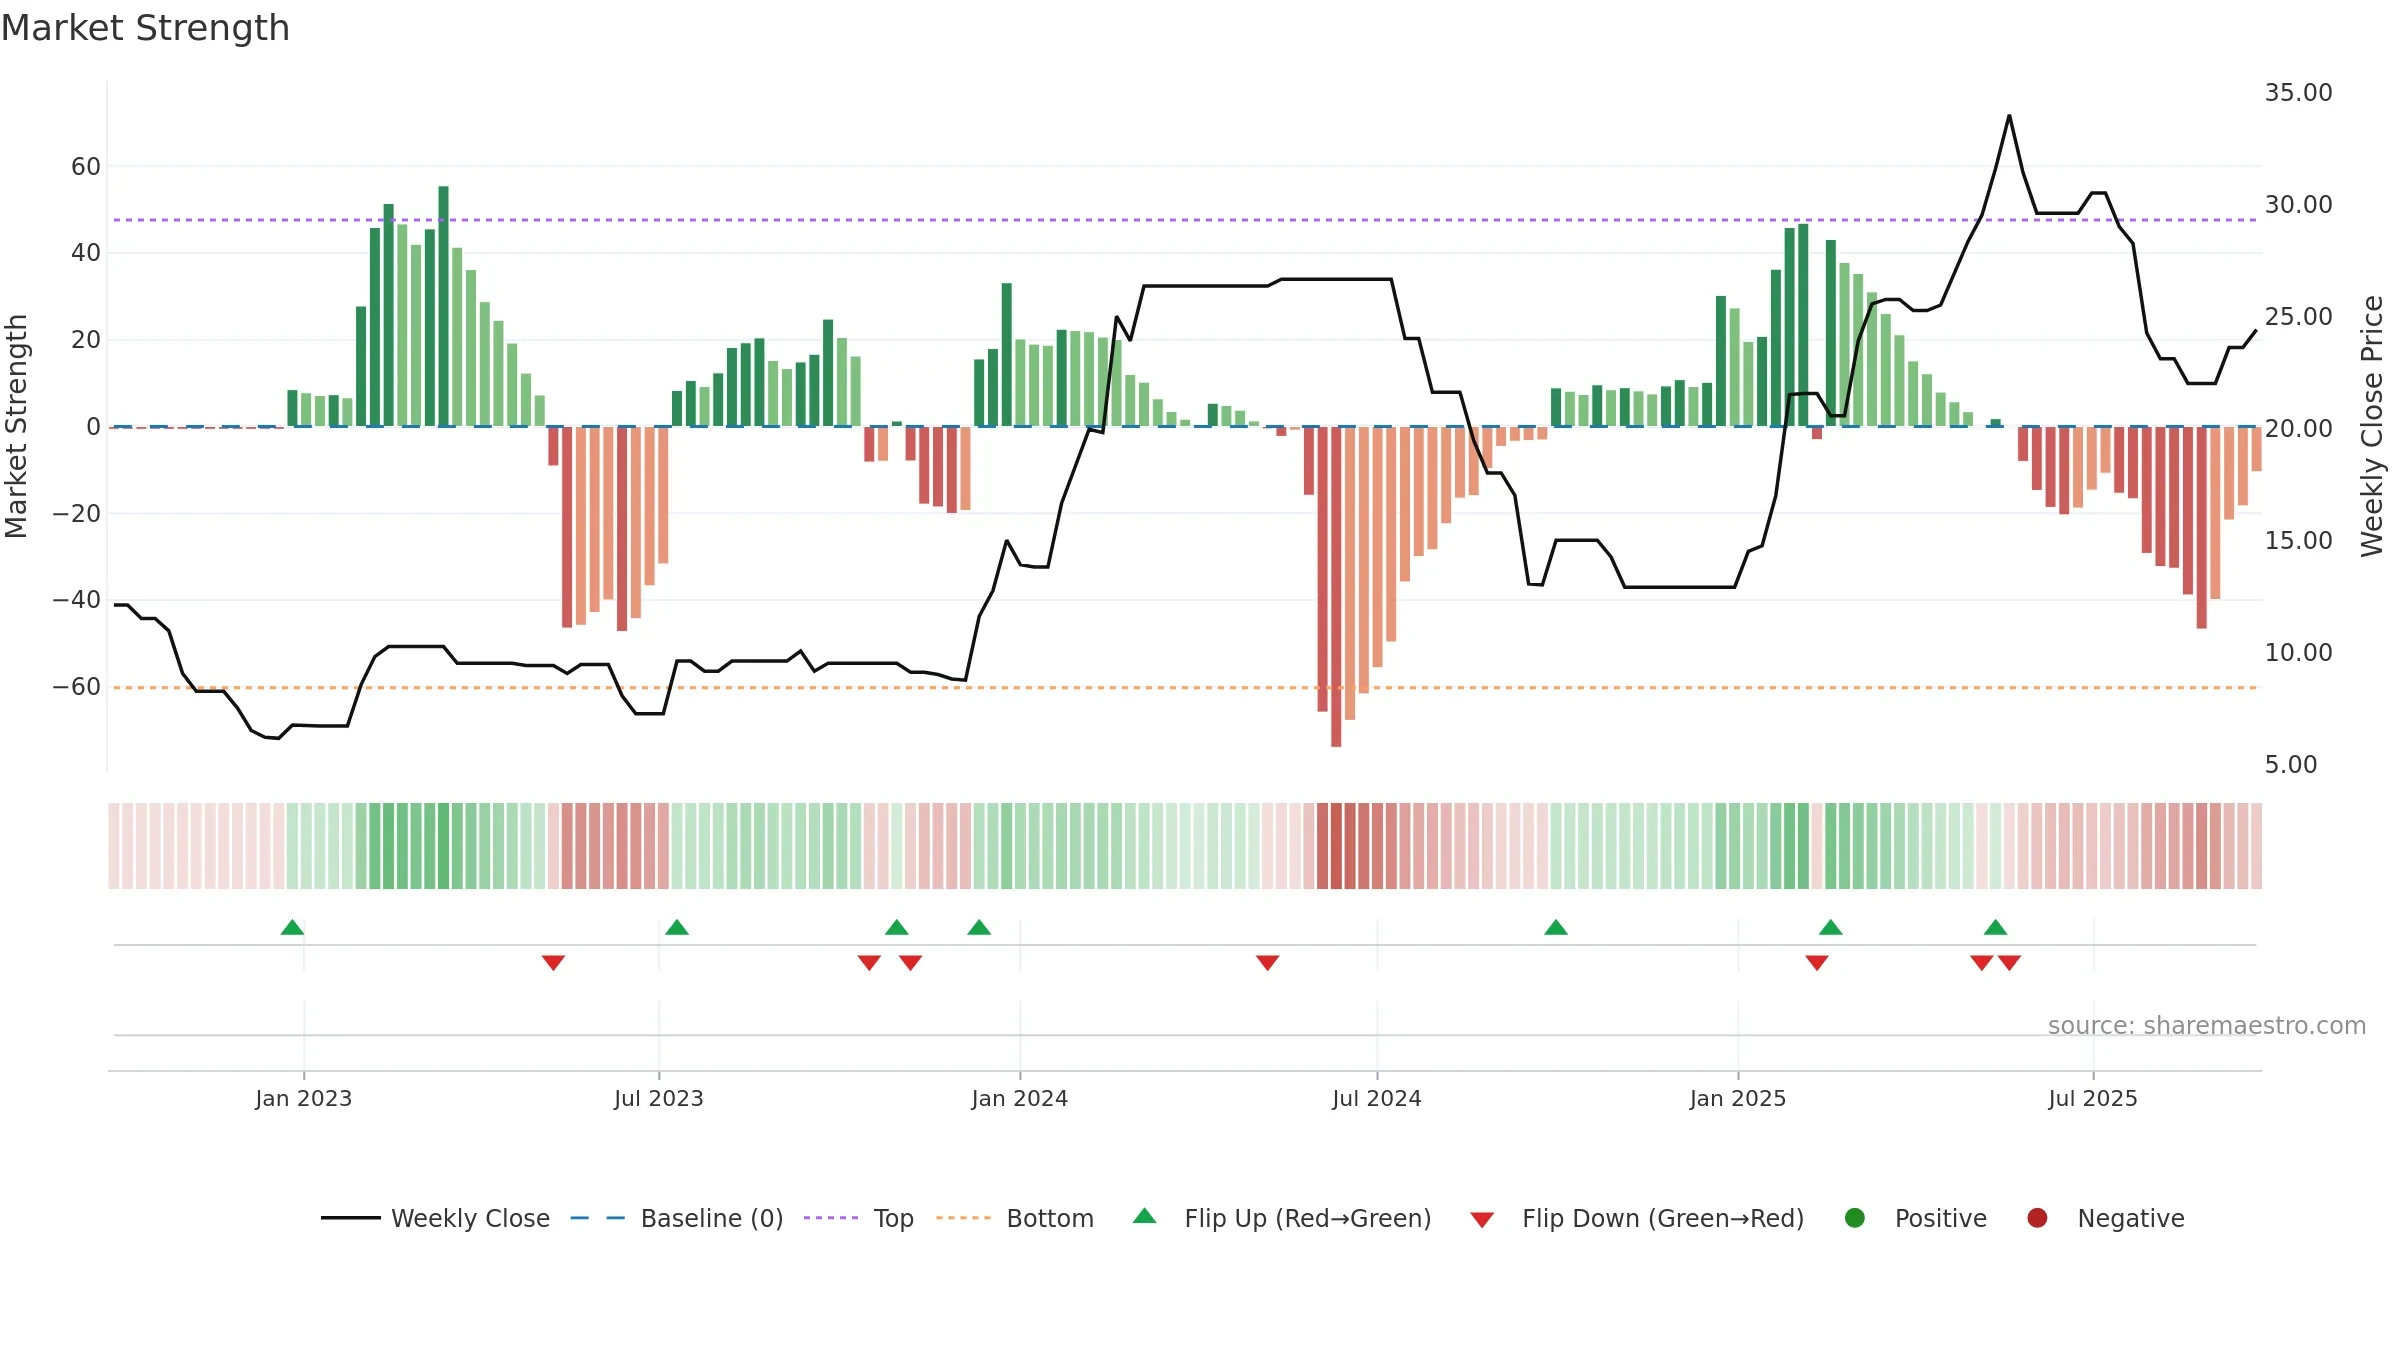
Gauge maps the trend signal to a 0–100 scale.

Gauge Reading35.2/100
DirectionFalling
Accelerationdecelerating
Gauge VolatilityHigh
Trend StateDowntrend Confirmed
Momentum Drawdown45.5 pts from 8w peak
EventMidline failure (~0.50) after strength
EventBear control (sub-0.40)
What stands out

How to read this — Bearish zone with falling momentum — sellers in control. Loss of the ~0.50 midline after strength suggests regime shift. Sub-0.40 print confirms downside control.

What to watch

Bias remains lower; rallies are suspect unless gauge reclaims 0.50/0.60.

Market Strength Mansfield Relative Strength vs Index
Mansfield RS
DRL Mansfield Relative Strength vs ^NSEI — weekly
Mansfield Relative Strength (MRS) compares this share’s weekly price to its exchange benchmark (e.g., ^NSEI), then normalises to a 52-week baseline. Above 0% = outperforming; below 0% = underperforming. Sharemaestro overlays fast/slow MAs for clarity and a colour strip for momentum bias.
What’s happening?

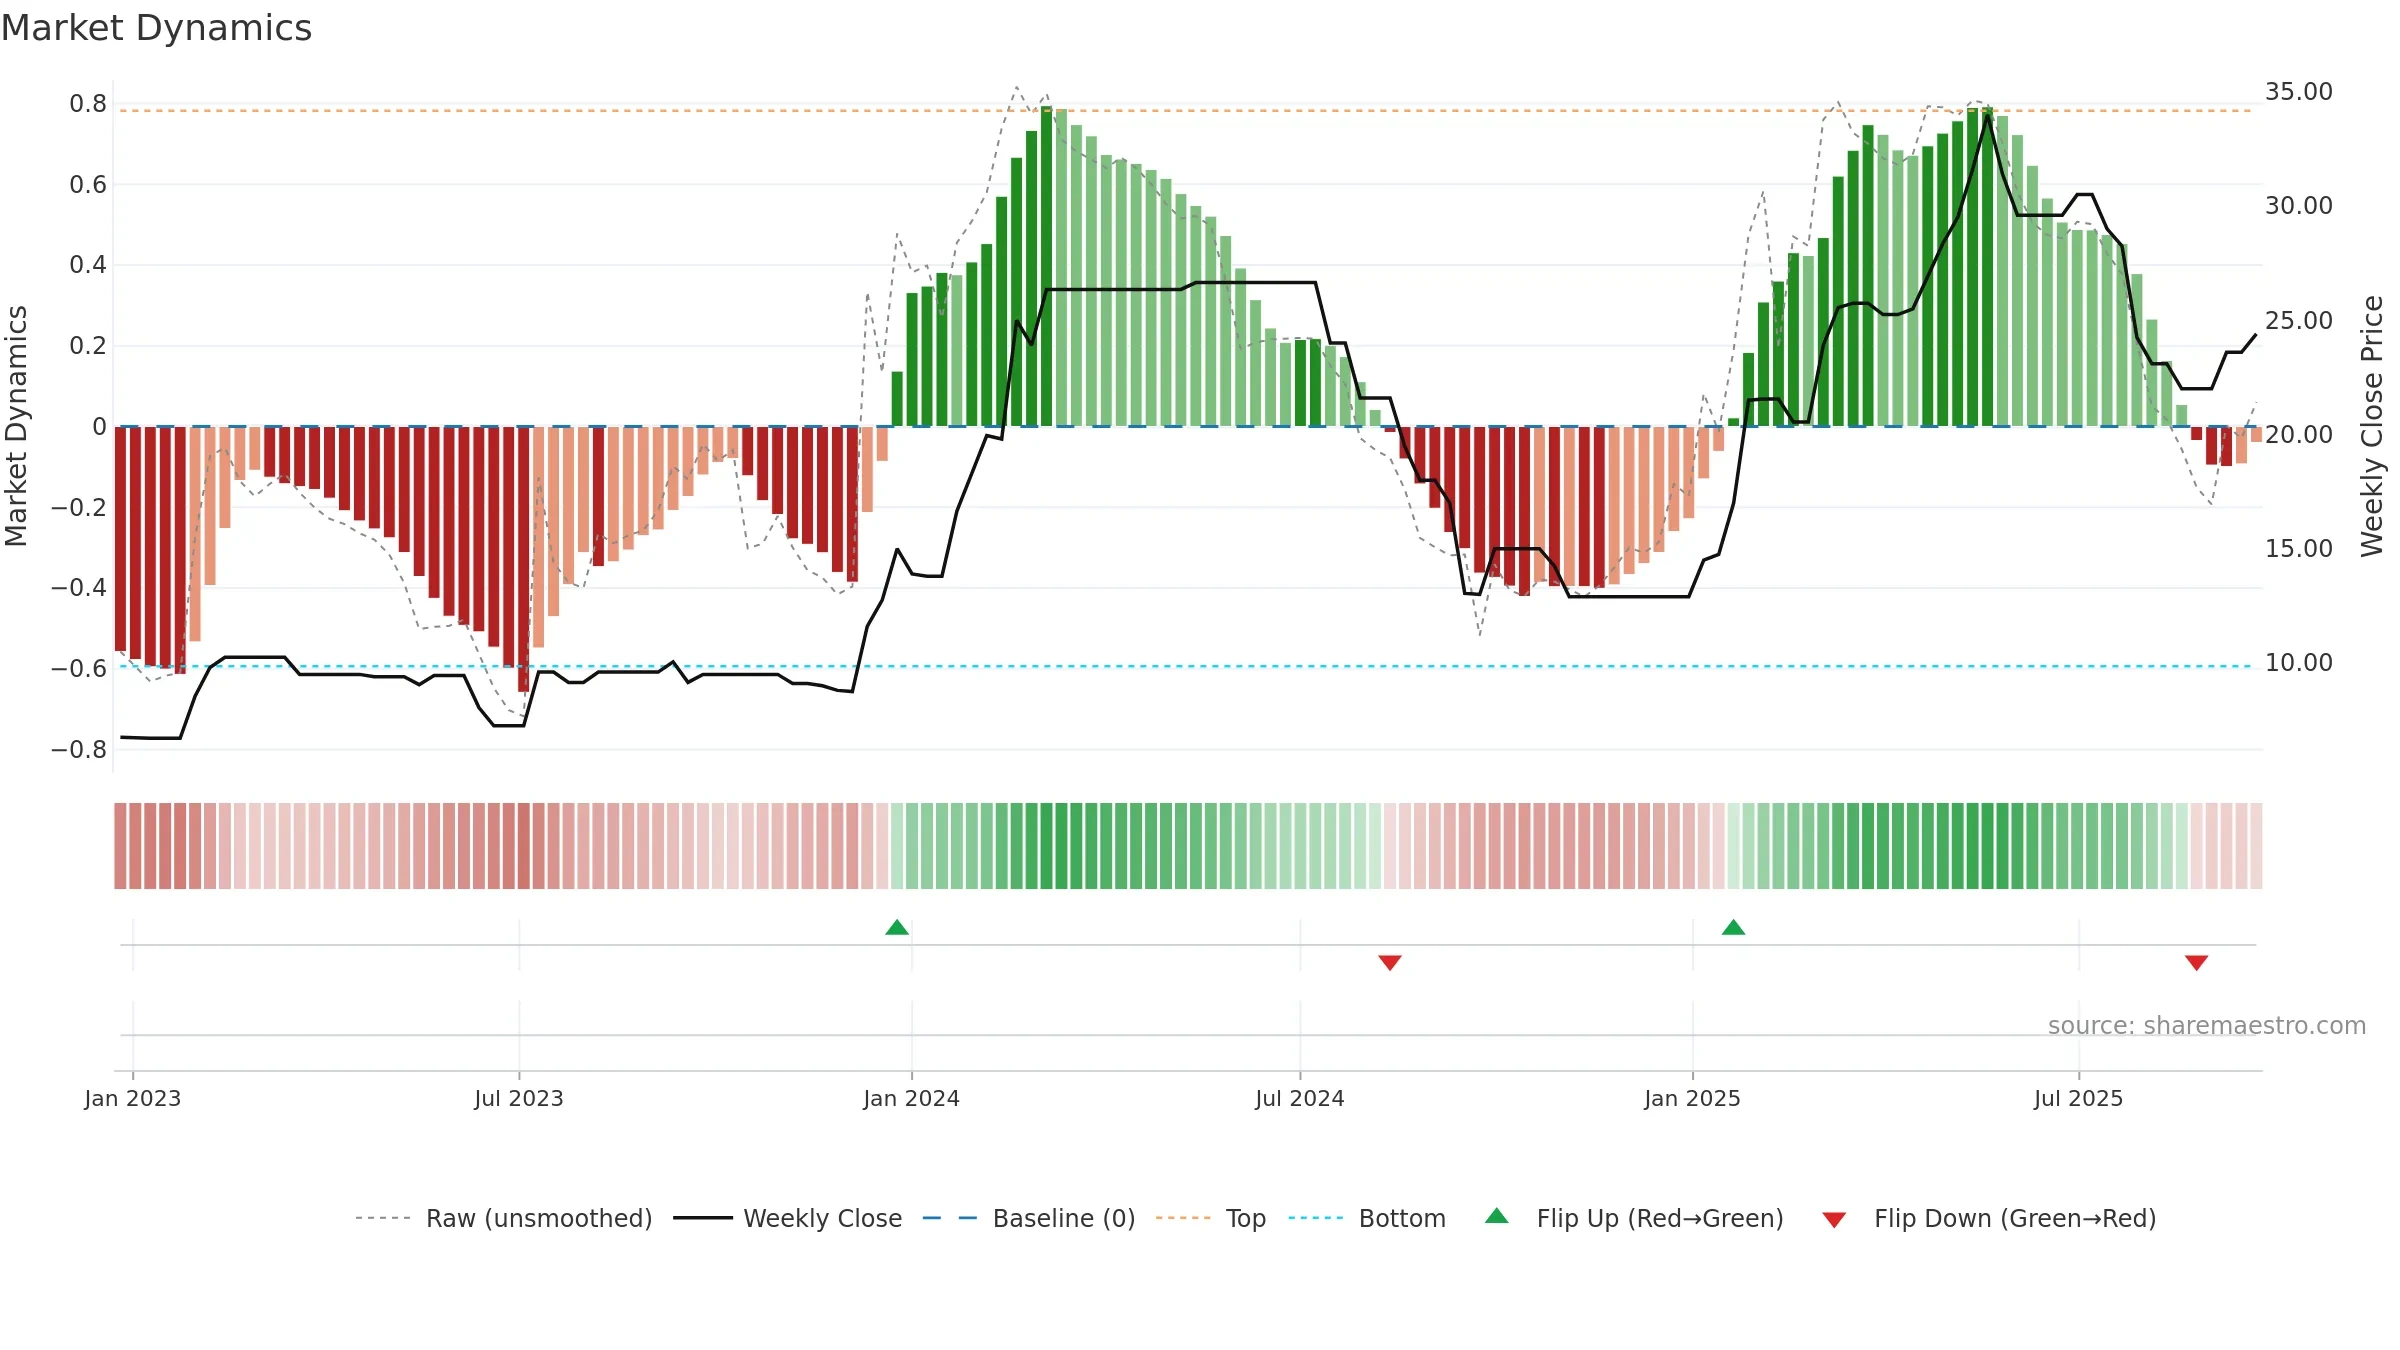
Relative strength is Negative (< 0%, underperforming). Latest MRS: -7.86% (week ending Fri, 19 Sep 2025). Slope: Falling over 8w.
Notes:

  • Below zero line indicates relative weakness vs benchmark.
  • MRS slope falling over ~8 weeks.

Benchmark^NSEI
Latest MRS-7.86%
Fast MA-7.23%
Slow MA12.89%
BiasUnderperforming

Conclusion

Negative ★⯪☆☆☆

Negative setup. ★⯪☆☆☆ confidence. Trend: Downtrend Confirmed · 5.63% over window · vol 1.57% · liquidity flat · posture mixed · RS weak

Strengths
  • Low return volatility supports durability
Watch-outs
  • Bearish control with falling momentum
  • Momentum is weak/falling
  • Price is not above key averages
  • Midline (~0.50) failure after strength

Why: Price window 5.63% over w. Close is 3.39% above the prior-window high. Return volatility 1.57%. Liquidity flat with price. Trend state downtrend confirmed. 4–8w crossover bullish. Momentum bearish and falling.

Price Window Endpoint return over the last N weeks using weekly closes: (Closelast − Closefirst)/Closefirst × 100.
Return Volatility Std-dev of weekly returns (%). Higher = choppier.
Volume Trend Slope of weekly volume across the window (rising / falling / flat).
Vs N-week High % distance of latest close from the highest close in the window.
Accumulation Weeks Weeks price rose on higher volume than the prior week.
Distribution Weeks Weeks price fell on higher volume than the prior week.
MA Stack Relative order of short/intermediate/long MAs. Short > long is constructive.
4–8 Crossover Latest cross of 4-week vs 8-week MA (bullish / bearish / none).
Price vs MAs Whether the close is above/below key averages (8w & 26w).
Baseline Deviation % distance from the market-cycle baseline (fair-value track).
Gauge Reading Smoothed trend signal mapped to 0–100.
Direction Slope sign of the gauge across the window (rising / falling).
Acceleration Change in the slope of the gauge (accelerating / decelerating).
Gauge Volatility Variability of the gauge (low / normal / high).
Zone Label Classification by level (Bullish / Neutral / Bearish).
Target Price (Flag) If flagged: Positive/Negative stance. Otherwise: numeric fair value.
Rating Model’s verdict for the snapshot.
Weekly Close Sparkline of the last 52 weekly closing prices.
Trend Line Sparkline of the smoothed trend signal over the last 52 weeks.

Tip: Most metrics include a hover tooltip where they appear in the report.

Week Ending: September 22, 2025
Top