Keystone Technology Co.,Ltd.
605588 SHA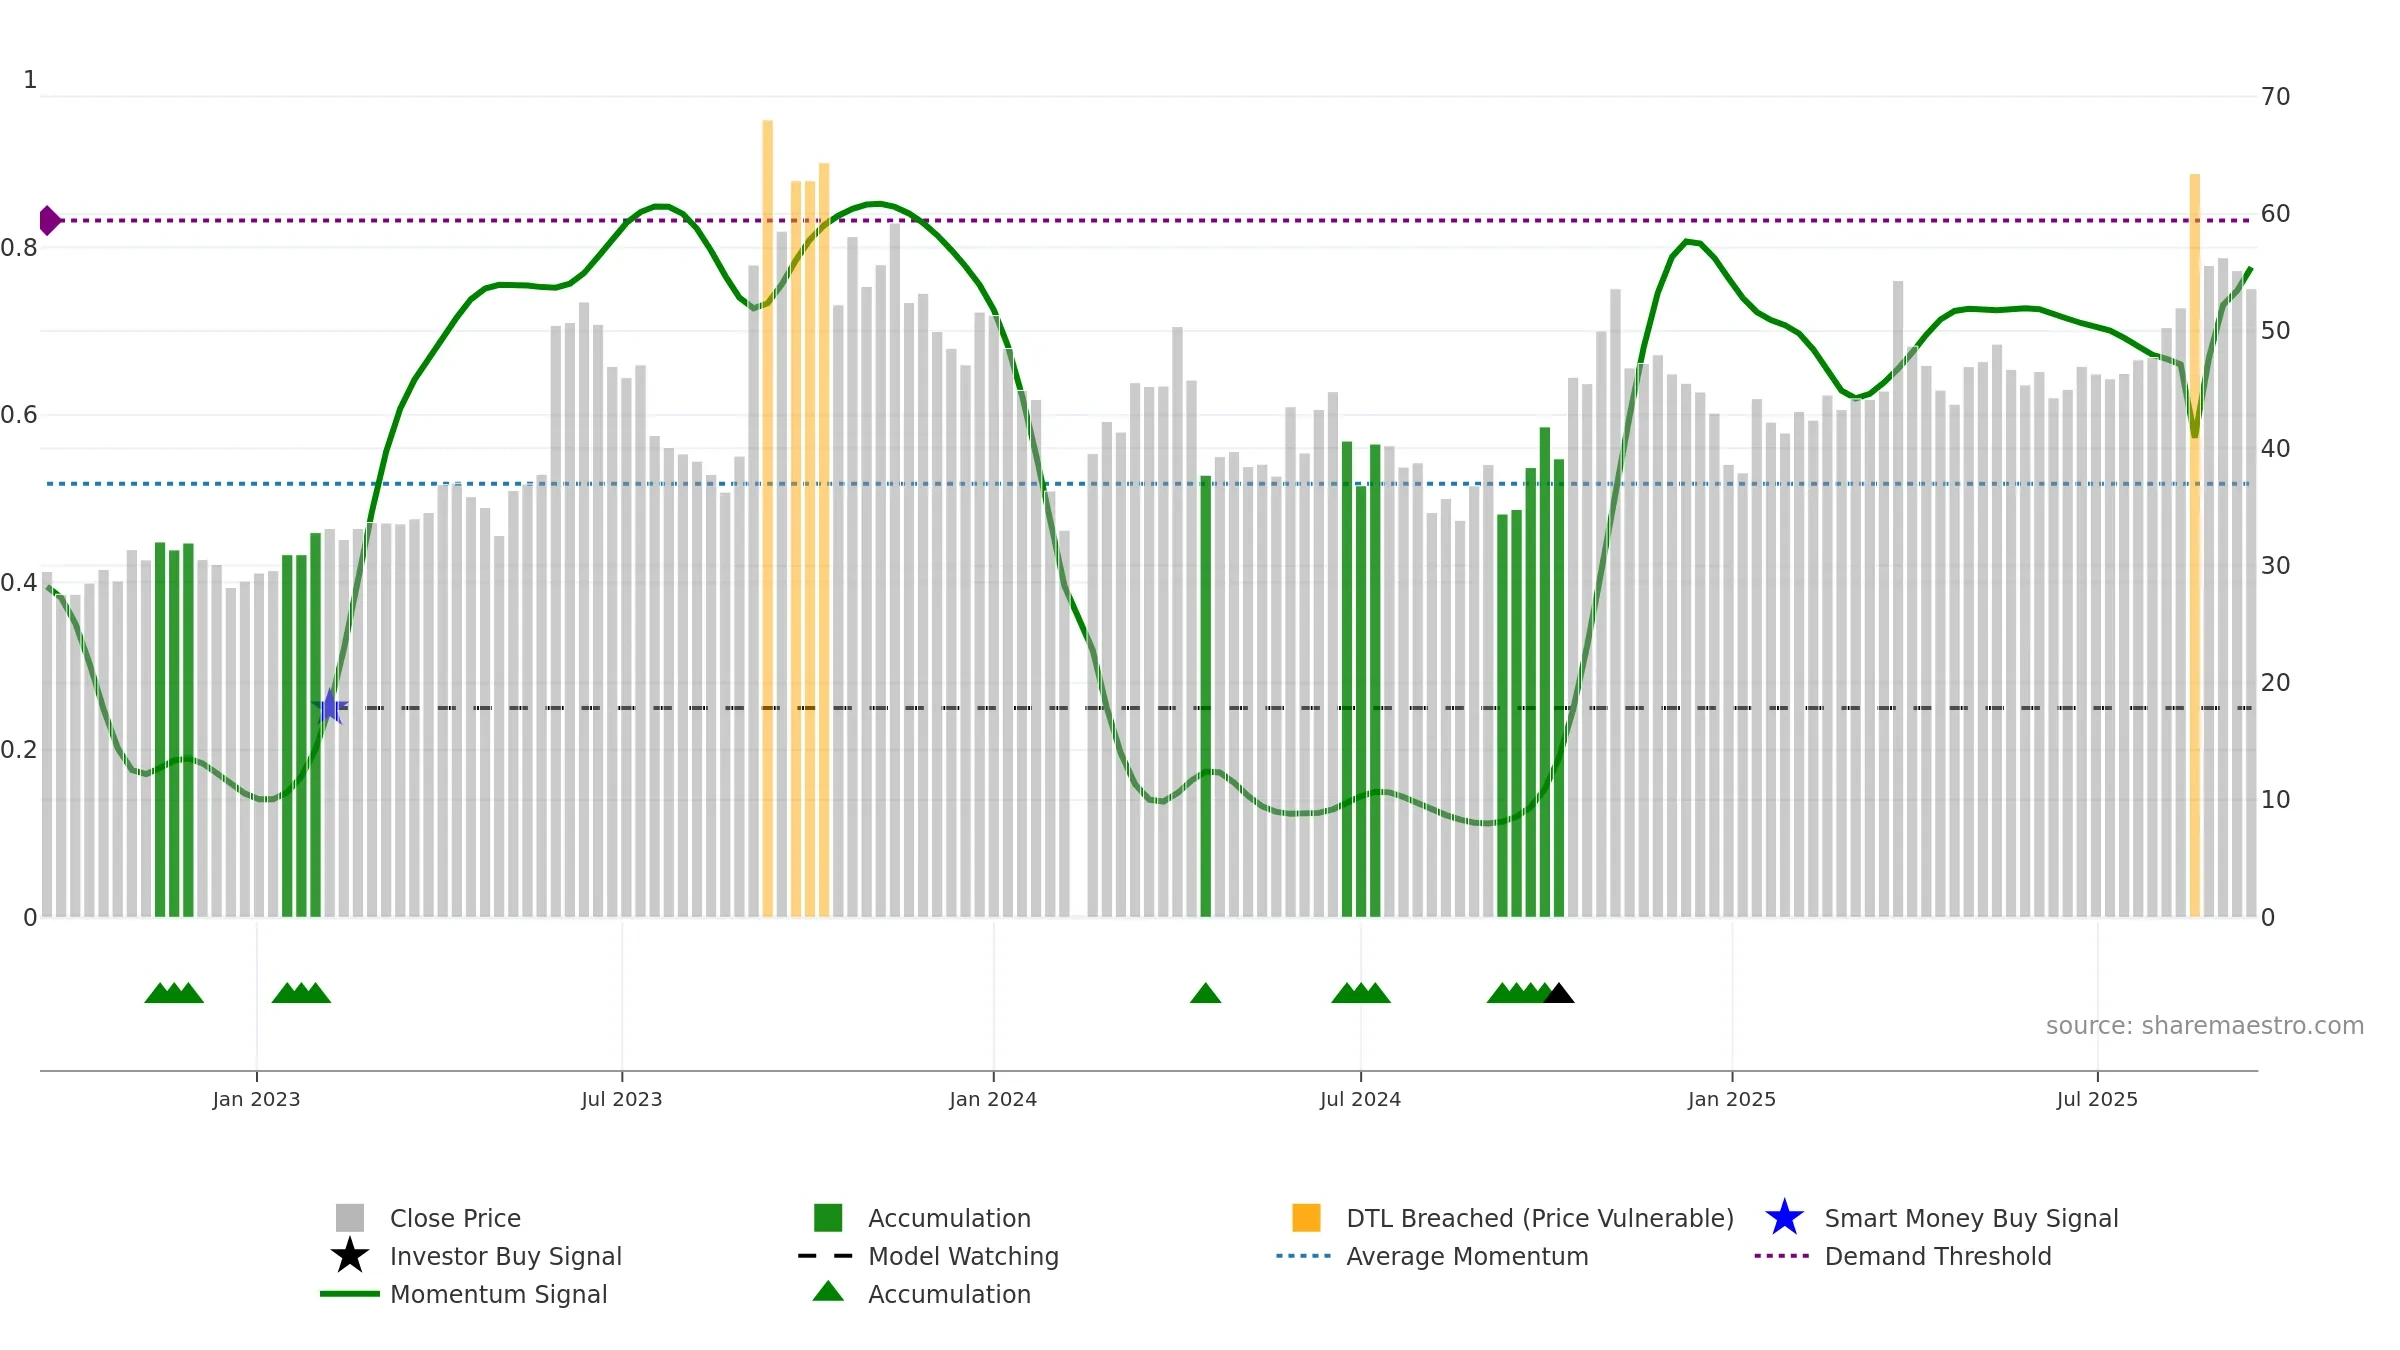
Weekly Report
Keystone Technology Co.,Ltd. closed at 53.6000 (-1.29% WoW) . Data window ends Mon, 15 Sep 2025.
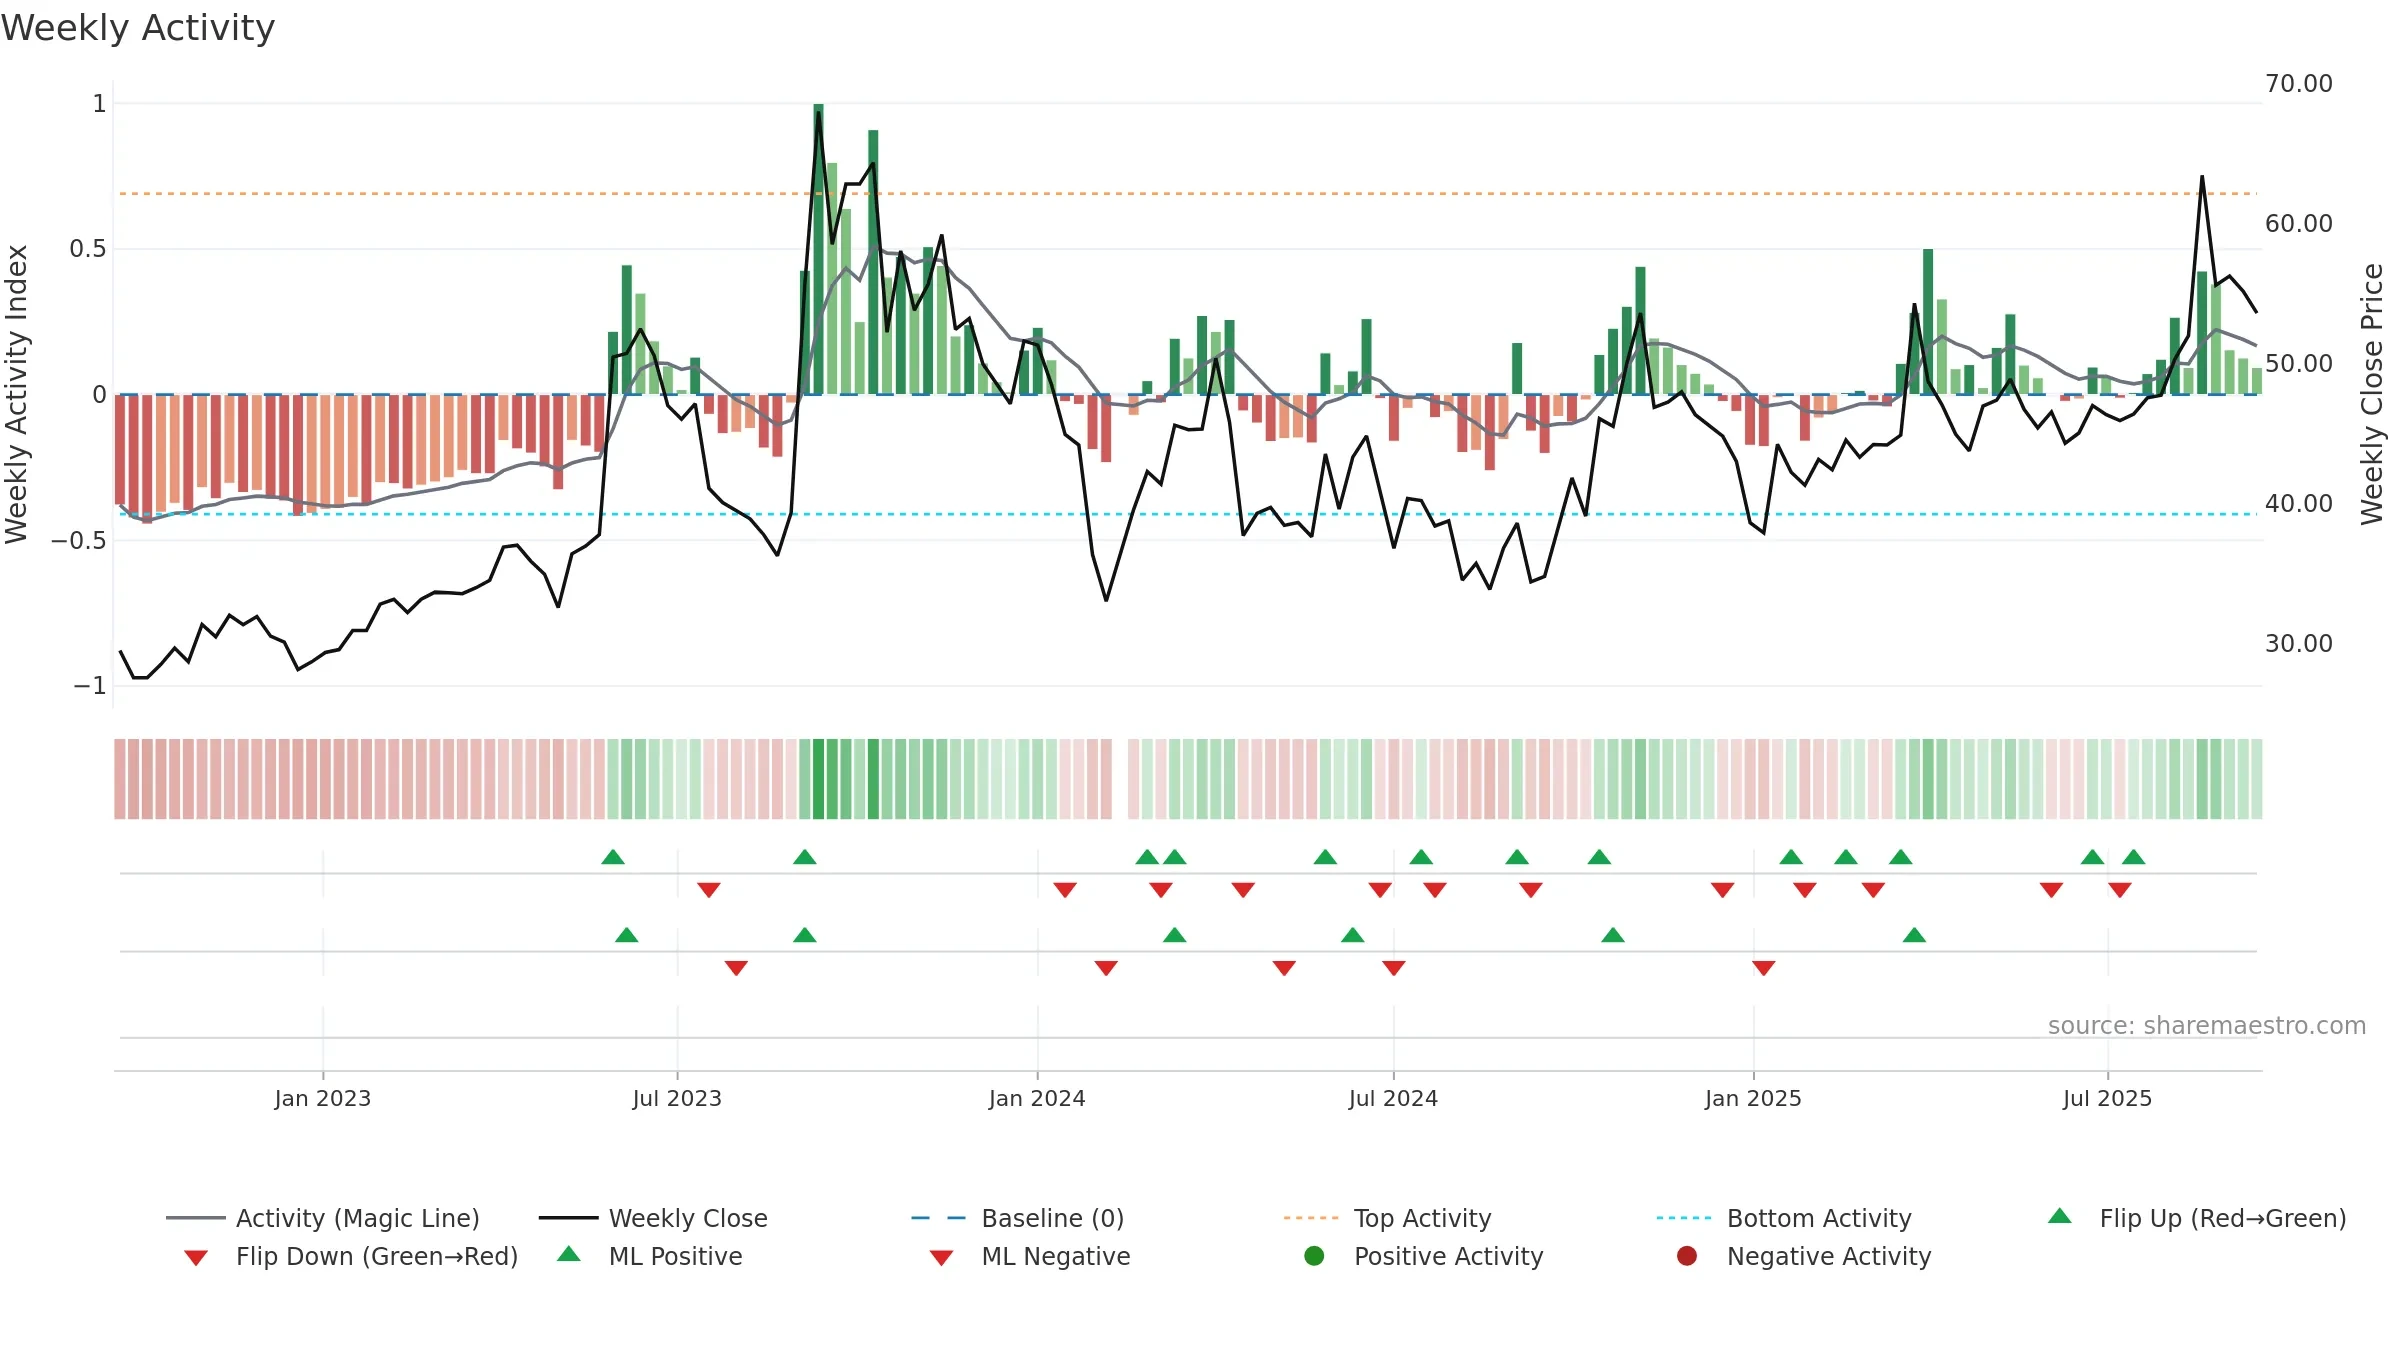
How to read this — Price slope is upward, indicating persistent buying over the window. Elevated weekly volatility increases whipsaw risk. Volume trend diverges from price — watch for fatigue or rotation. Constructive MA stack supports the up-drift; pullbacks may find support at the 8–13 week region.
Up-slope supports buying interest; pullbacks may be contained if activity stays firm. Because liquidity isn’t confirming, prefer evidence of fresh demand before chasing moves.
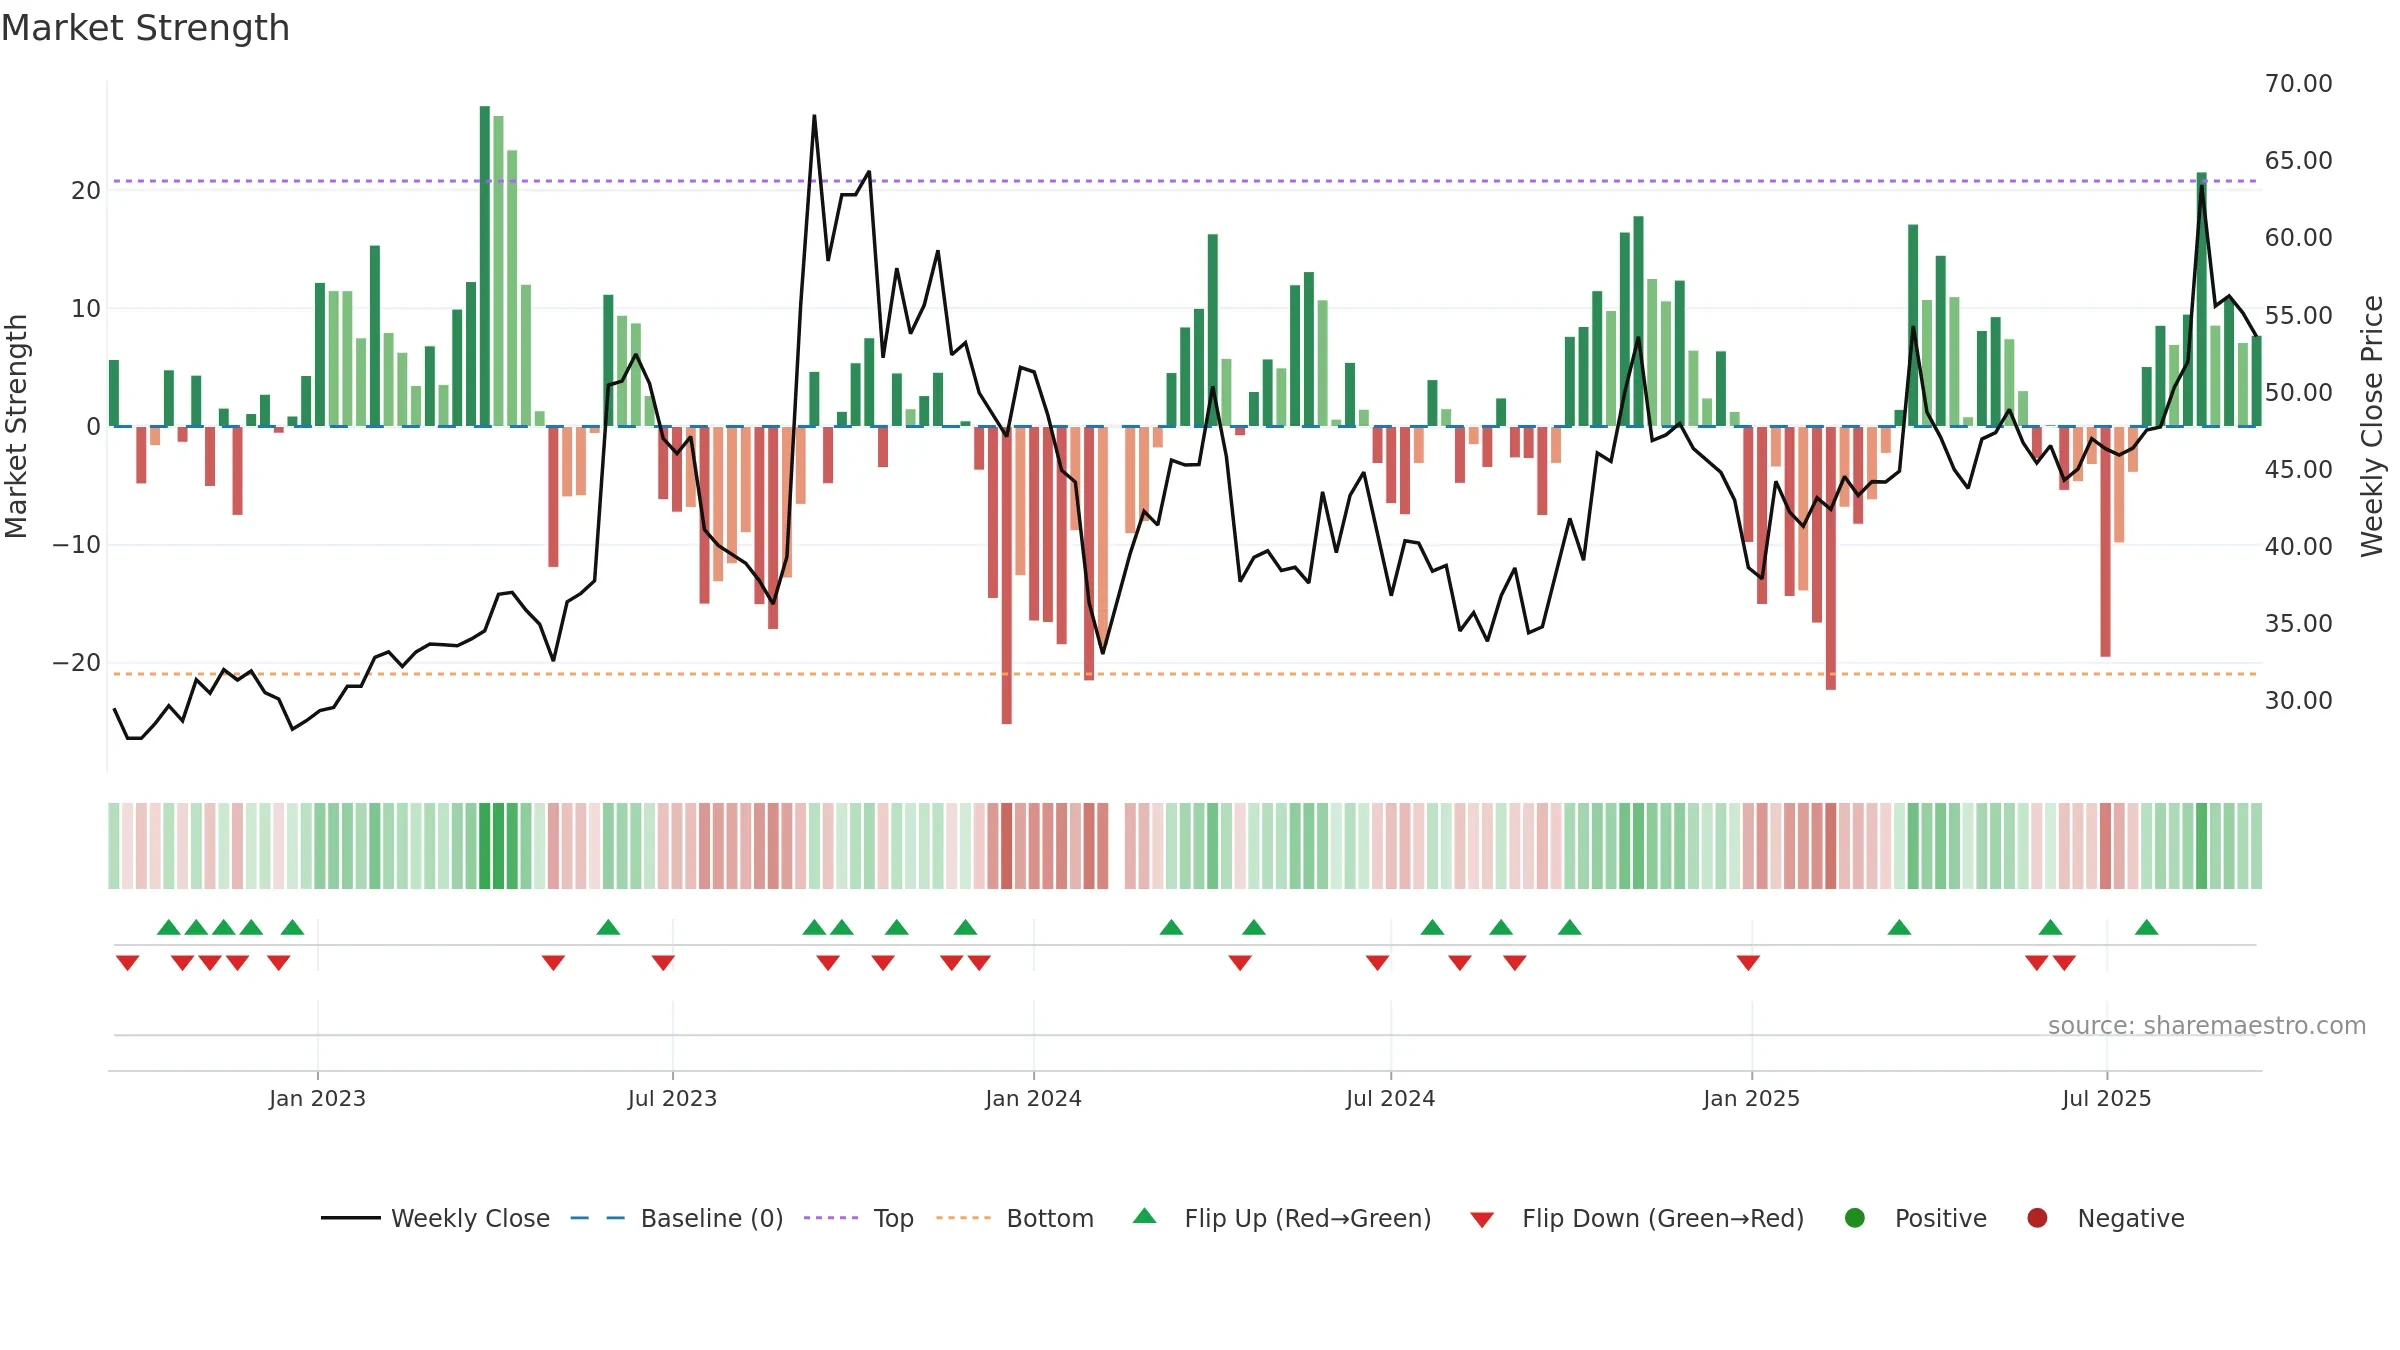
Gauge maps the trend signal to a 0–100 scale.
How to read this — High gauge and rising momentum — buyers in control.
Bias remains higher; pullbacks could be buyable if participation holds.
Conclusion
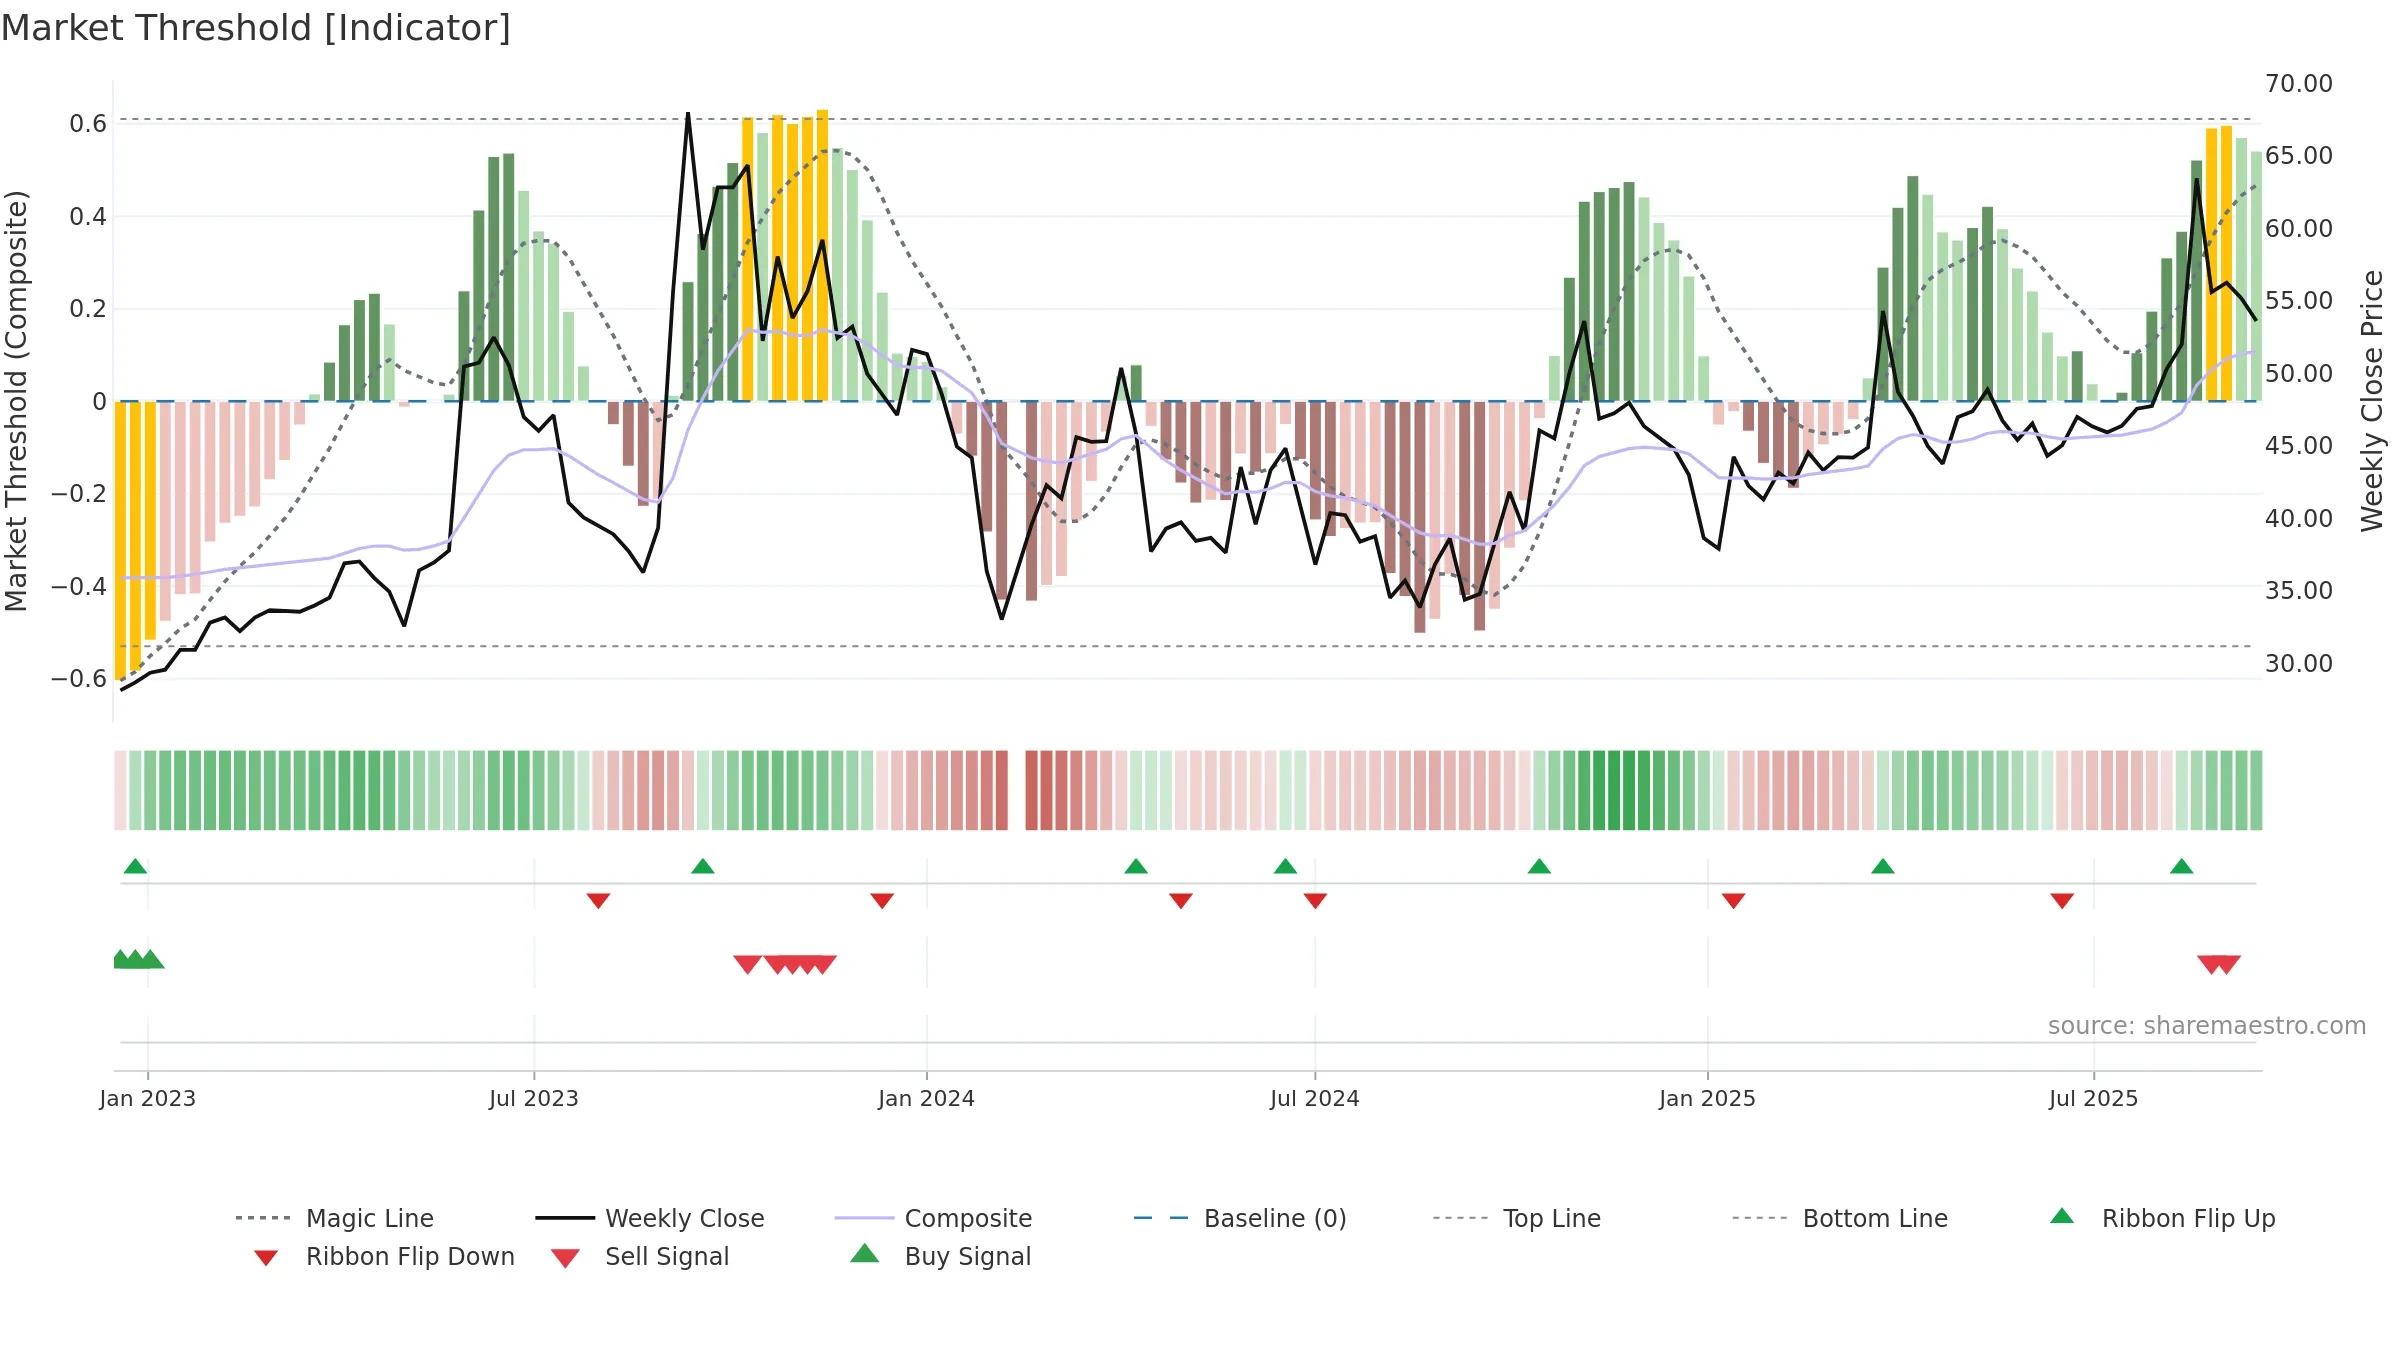
Negative setup. ★★☆☆☆ confidence. Price window: 12. Trend: Strong Uptrend; gauge 77. In combination, liquidity diverges from price.
- High gauge with rising momentum (strong uptrend)
- Momentum is bullish and rising
- Constructive moving-average stack
- Solid multi-week performance
- Price is not above key averages
- Liquidity diverges from price
- High return volatility raises whipsaw risk
Why: Price window 12.27% over 8w. Close is -15.51% below the prior-window high. Return volatility 4.10%. Volume trend falling. Liquidity divergence with price. Trend state strong uptrend. MA stack constructive. Momentum bullish and rising.
Tip: Most metrics include a hover tooltip where they appear in the report.