First Hotel Company Ltd.
2706 TPE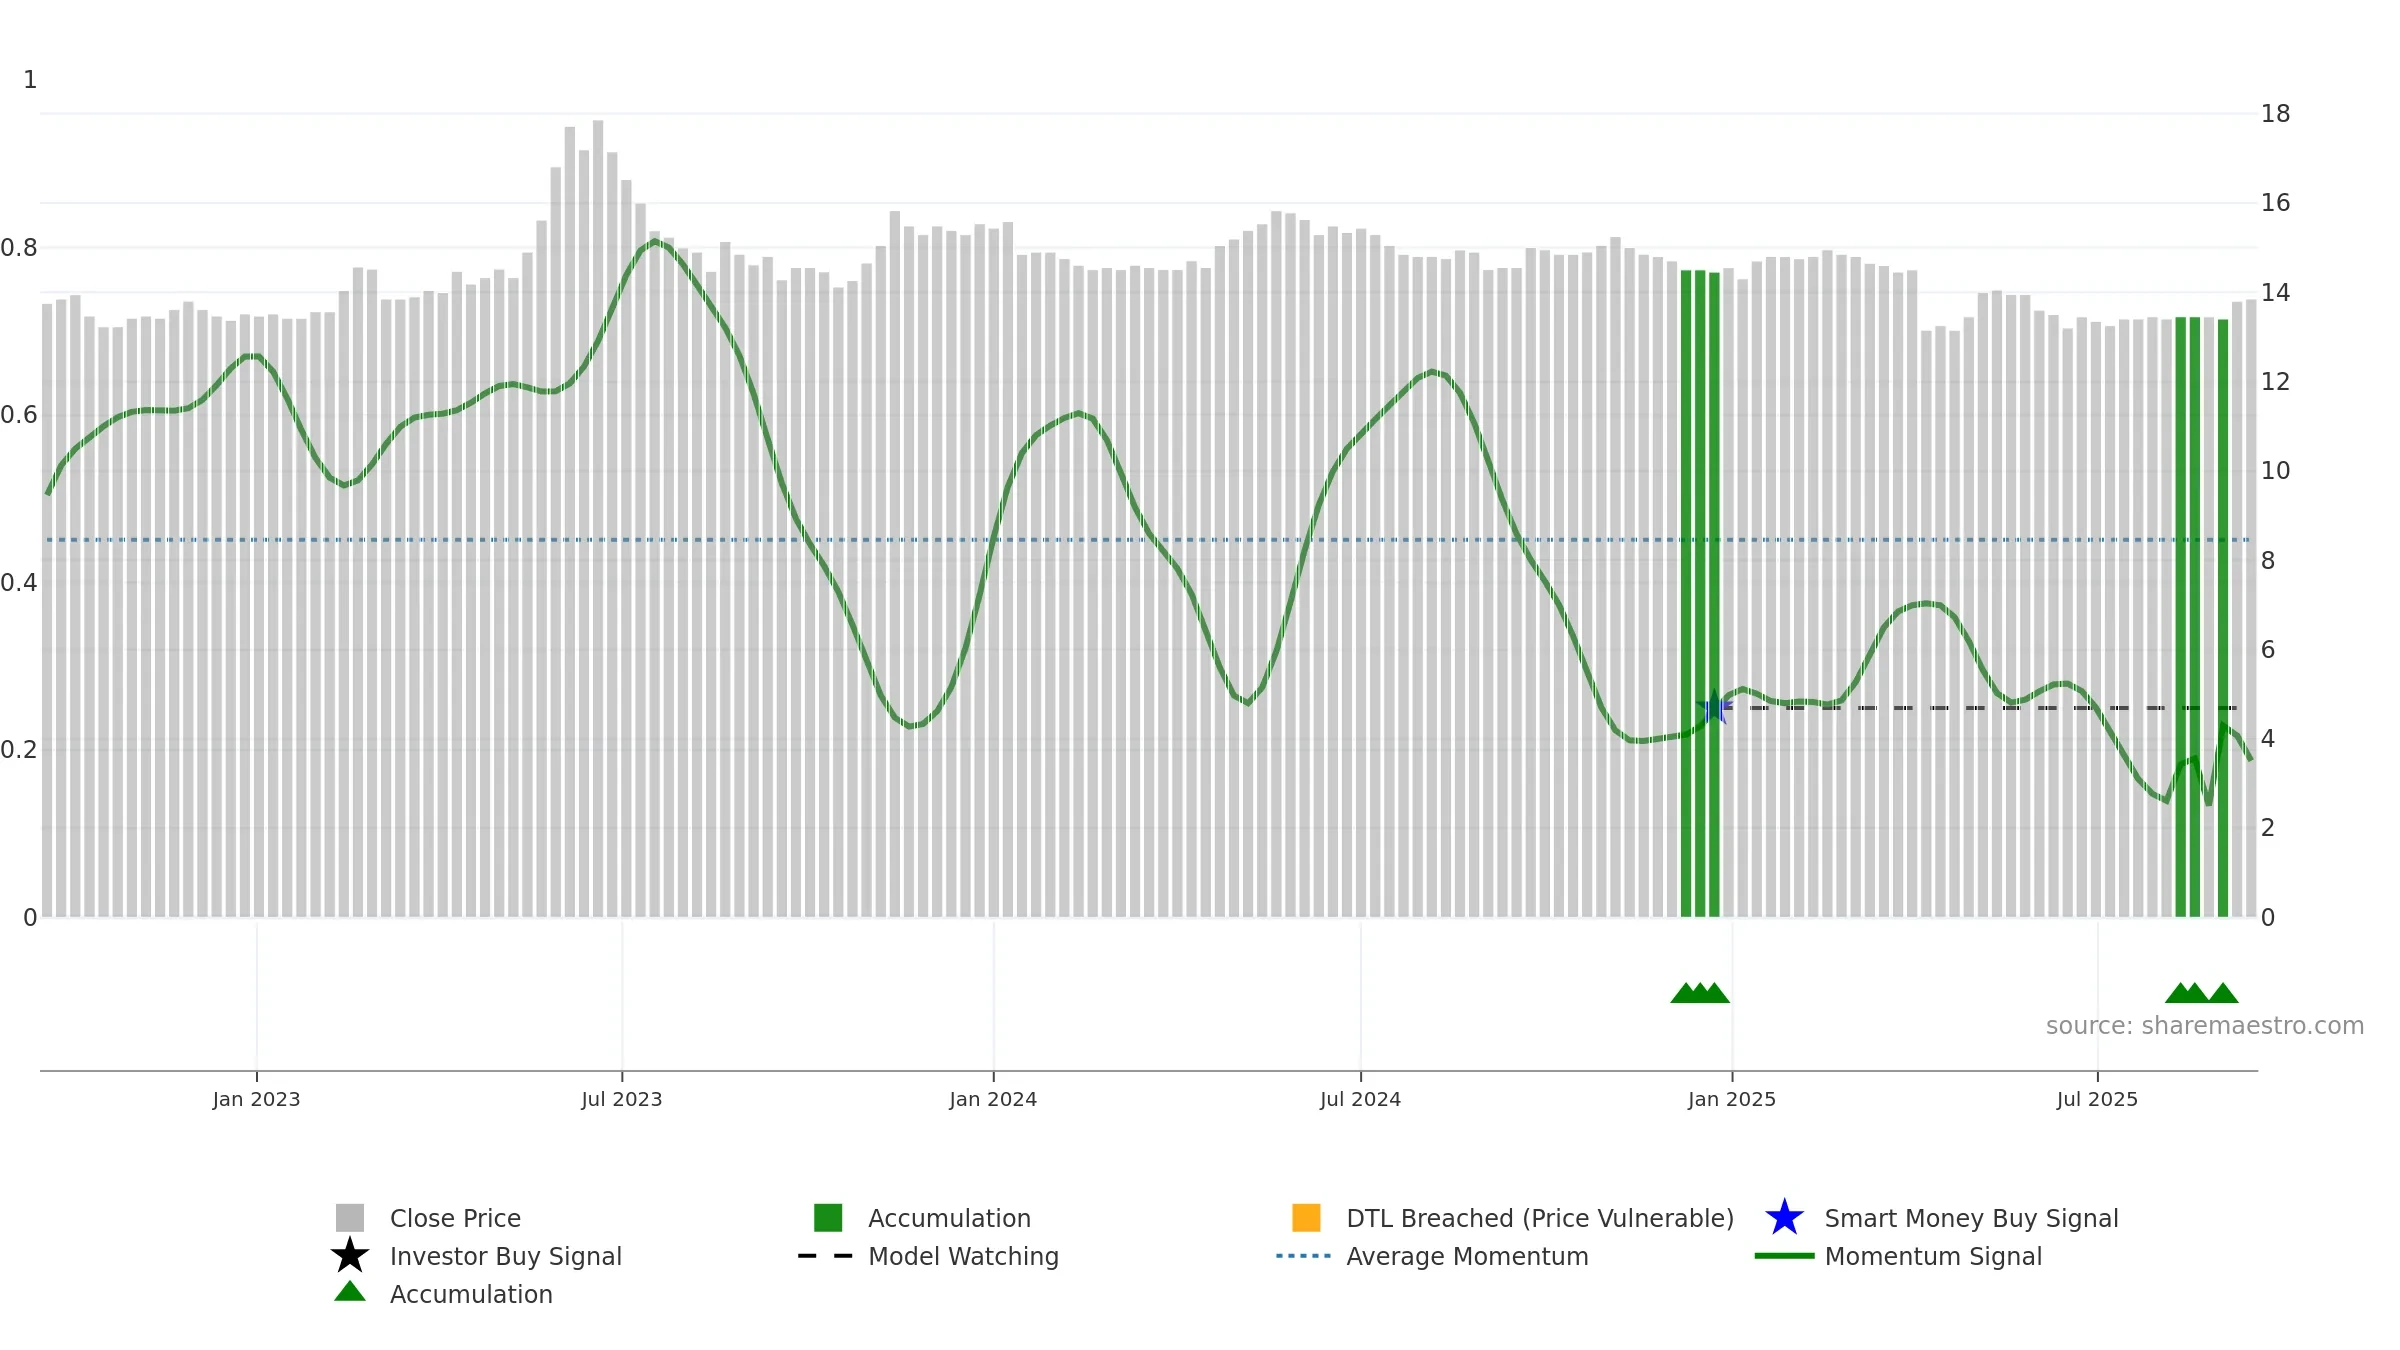
Weekly Report
First Hotel Company Ltd. closed at 13.8500 (0.73% WoW) . Data window ends Mon, 15 Sep 2025.
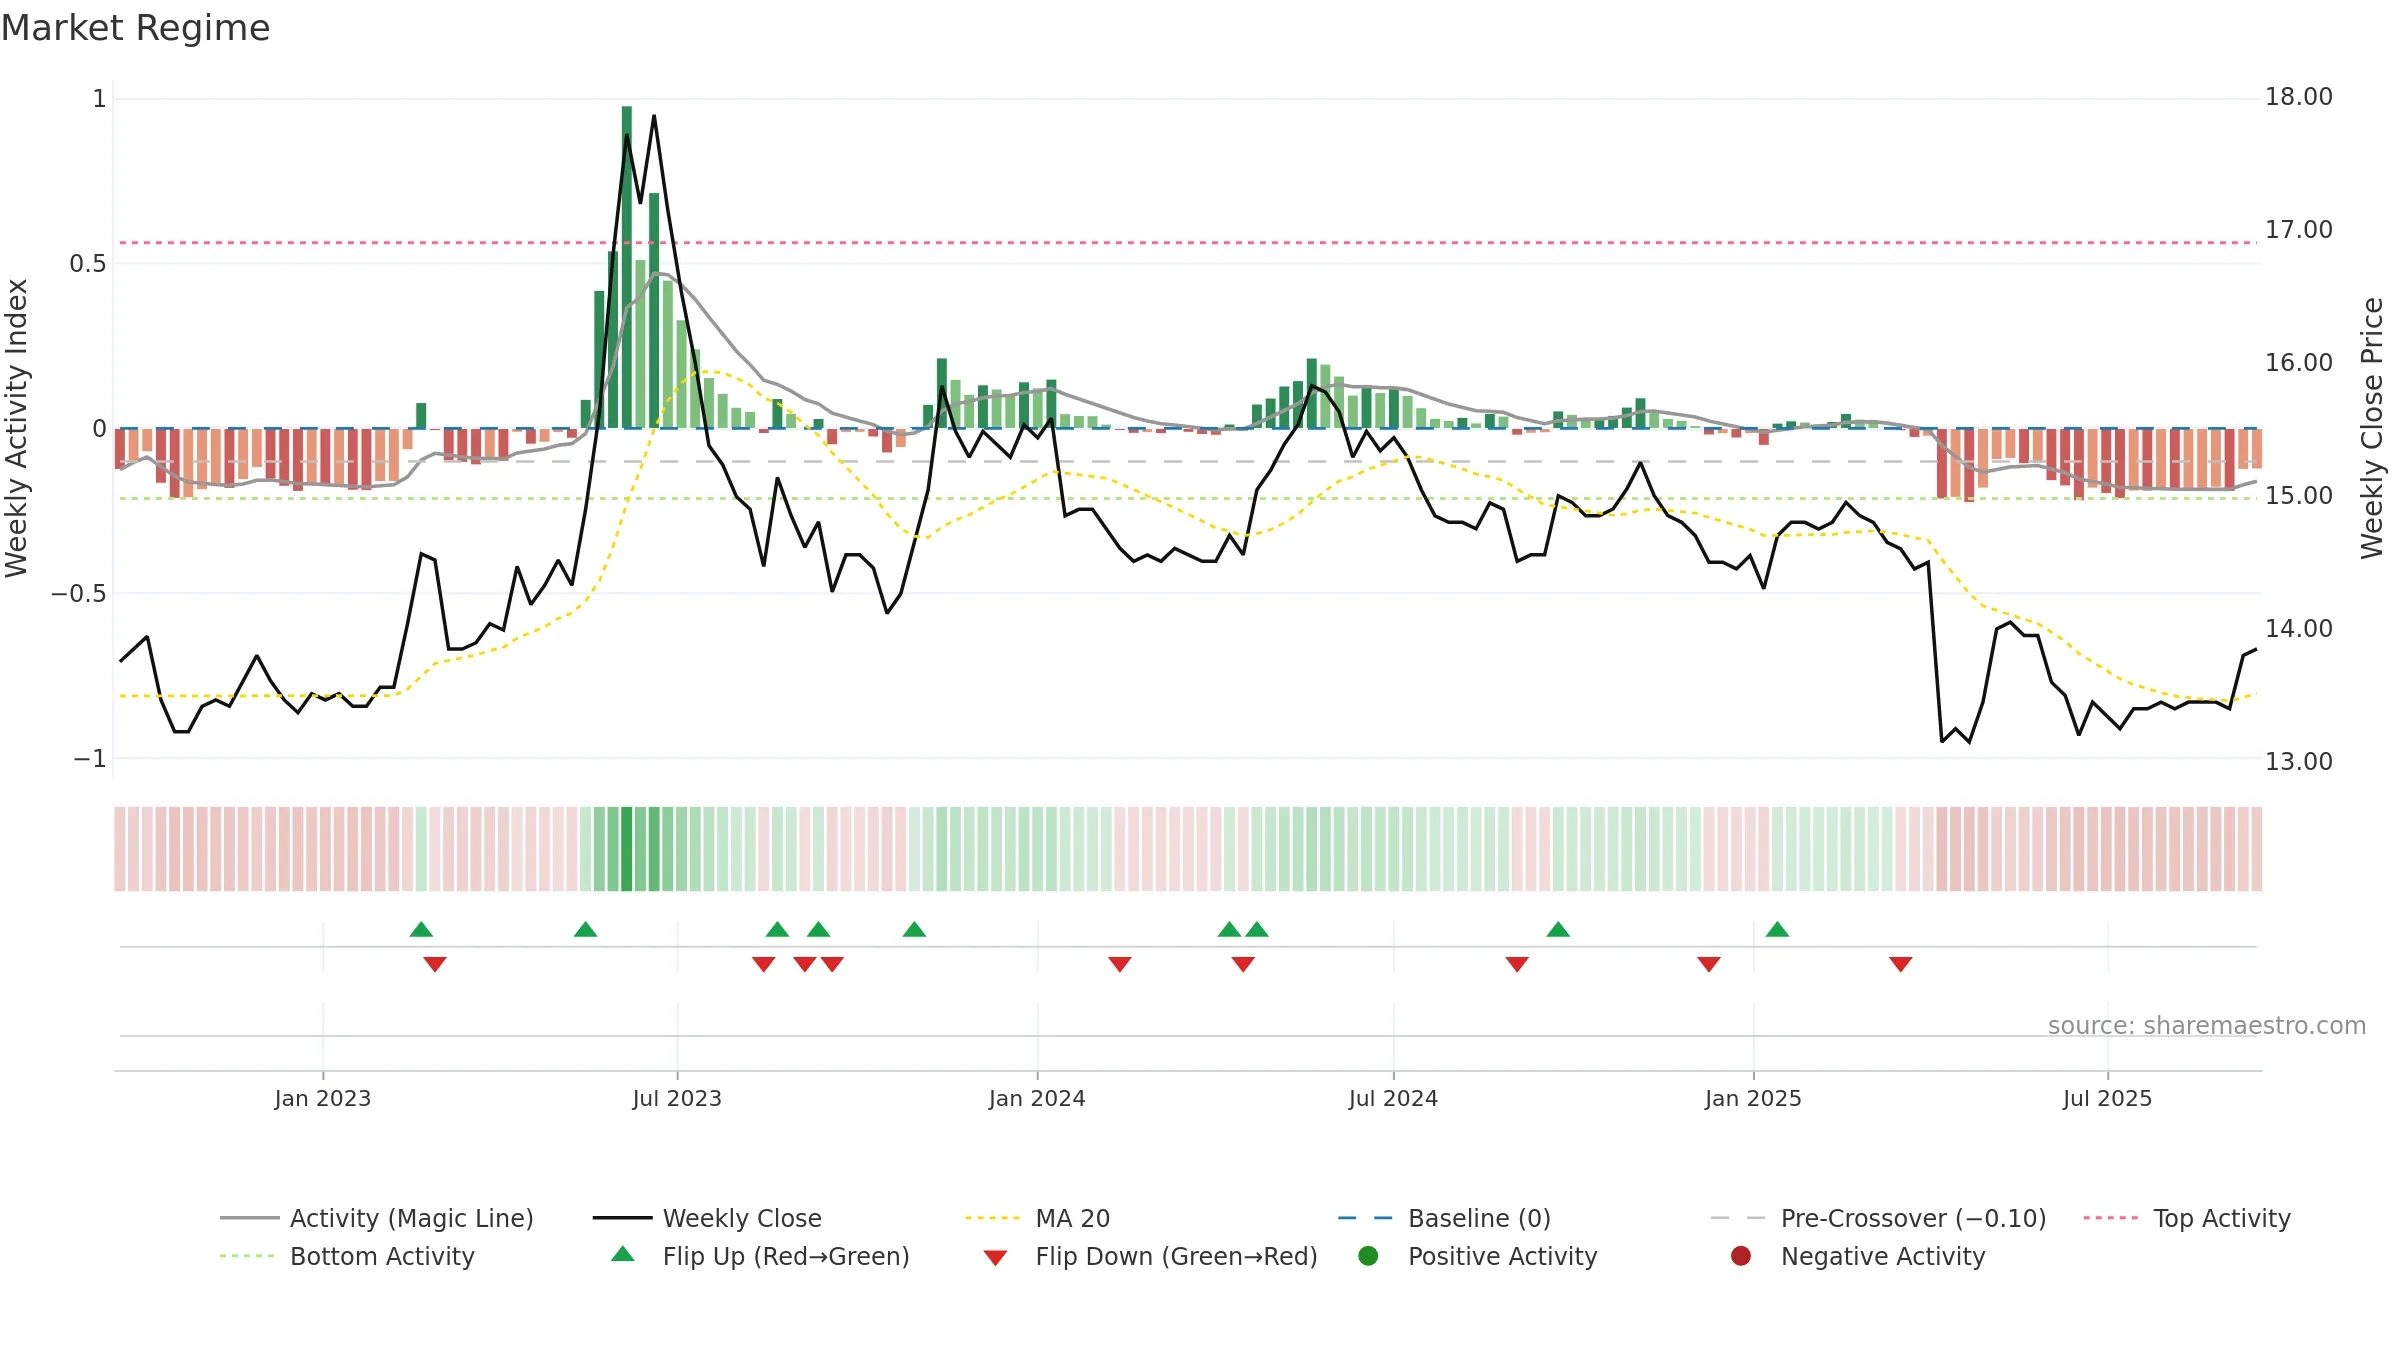
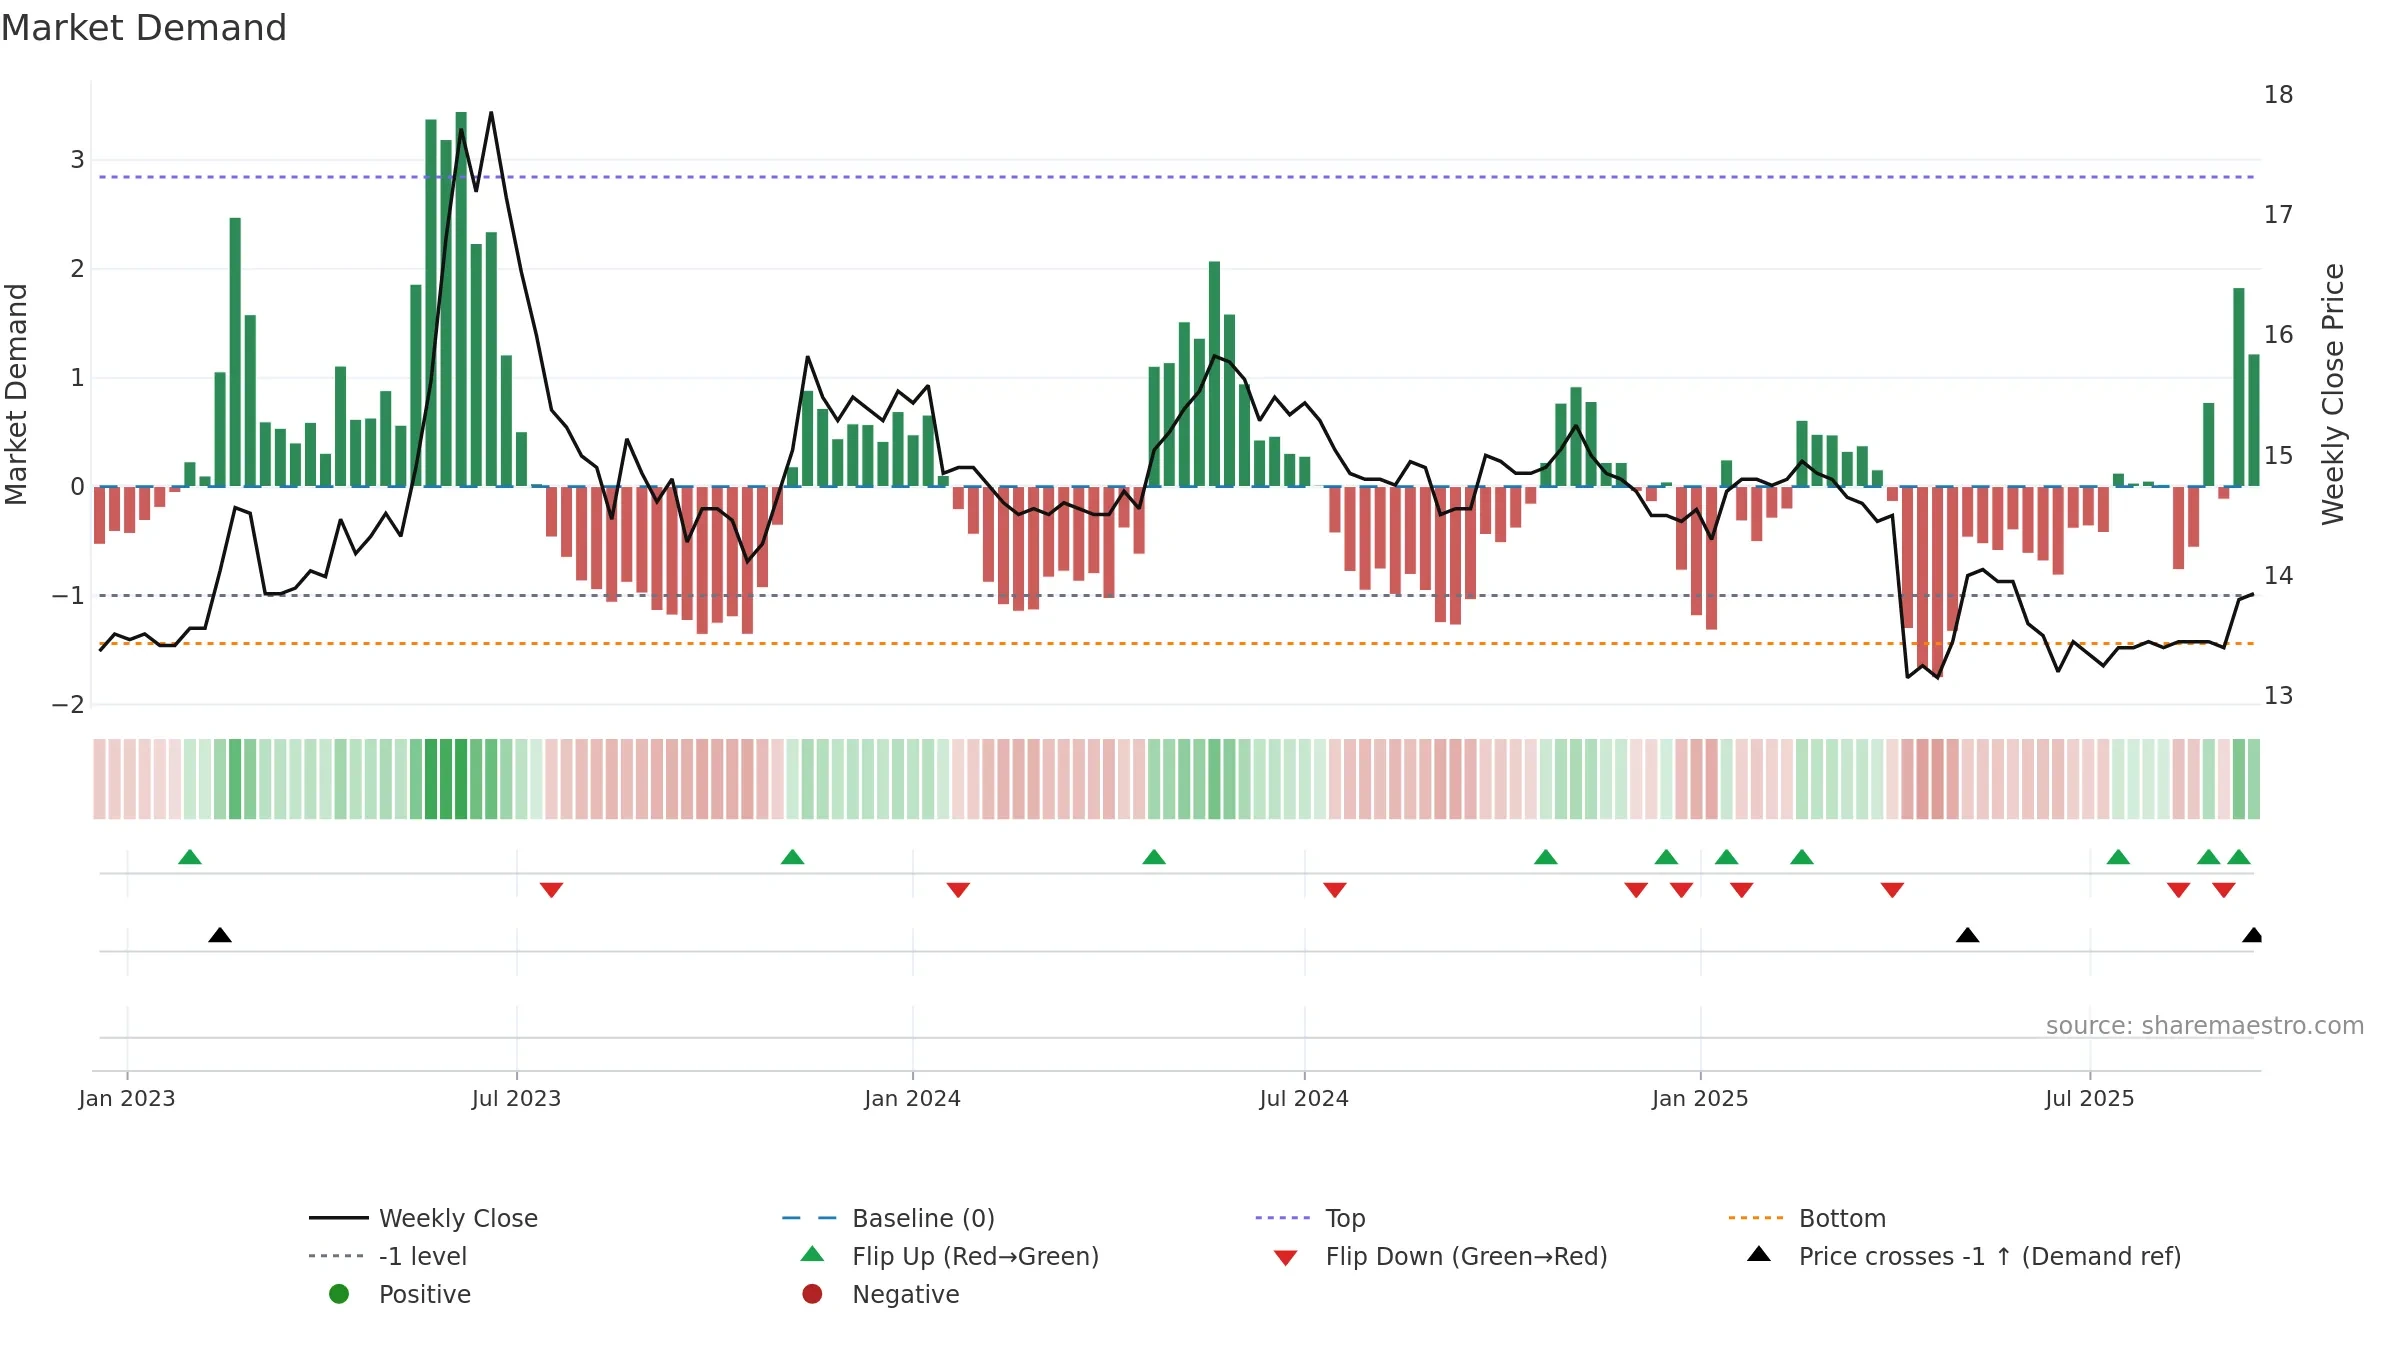
How to read this — Price slope is upward, indicating persistent buying over the window. Low weekly volatility favours steadier follow-through. Volume and price are moving in the same direction — a constructive confirmation. Returns are negatively correlated with volume — strength may come on lighter activity. Distance to baseline is narrowing — reverting closer to its fair-value track. Price holds above key averages, indicating constructive participation.
Up-slope supports buying interest; pullbacks may be contained if activity stays firm.
Gauge maps the trend signal to a 0–100 scale.
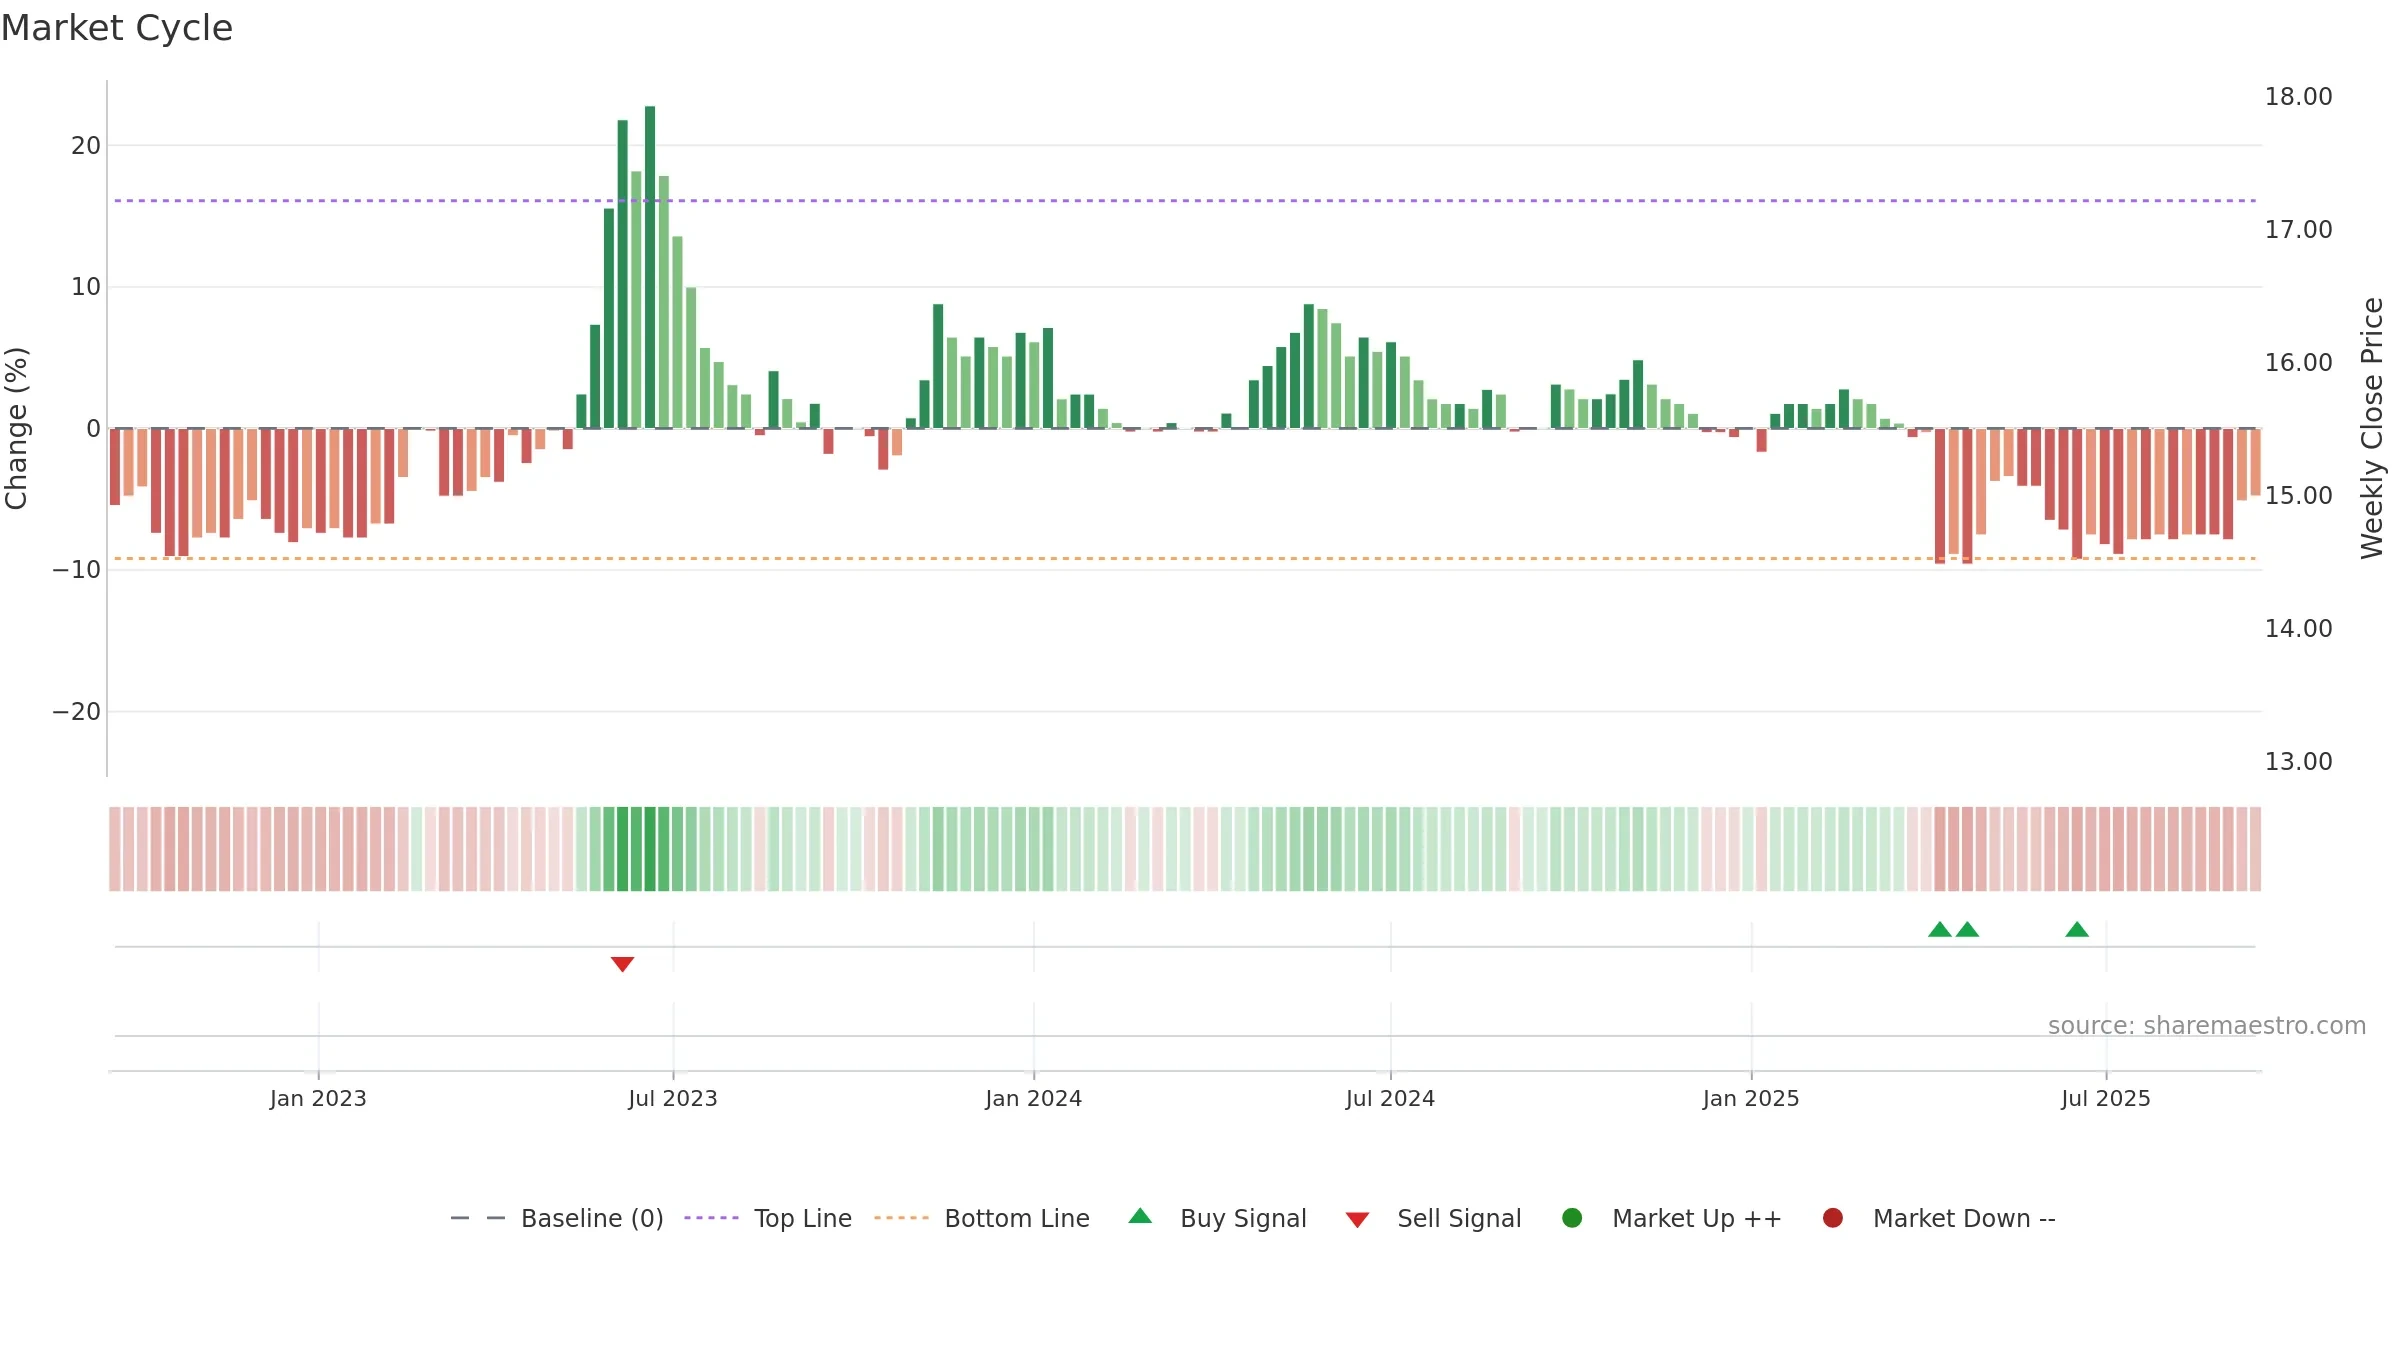
How to read this — Range-bound conditions; conviction is limited until a break or acceleration emerges.
Wait for a directional break or improving acceleration.
The flag is positive: favourable upside skew with supportive conditions.
Conclusion
Neutral setup. ★★★☆☆ confidence. Price window: 2. Trend: Range / Neutral; gauge 18. In combination, liquidity confirms the move.
- Price holds above 8w & 26w averages
- Liquidity confirms the price trend
- Low return volatility supports durability
- Momentum is weak/falling
Why: Price window 2.97% over 8w. Return volatility 0.40%. Volume trend rising. Liquidity convergence with price. Trend state range / neutral. Low-regime (≤0.25) upticks 3/7 (43.0%) • Distributing. Momentum bearish and rising. Valuation stance positive.
Tip: Most metrics include a hover tooltip where they appear in the report.