Grafton Group plc
GFTU LSE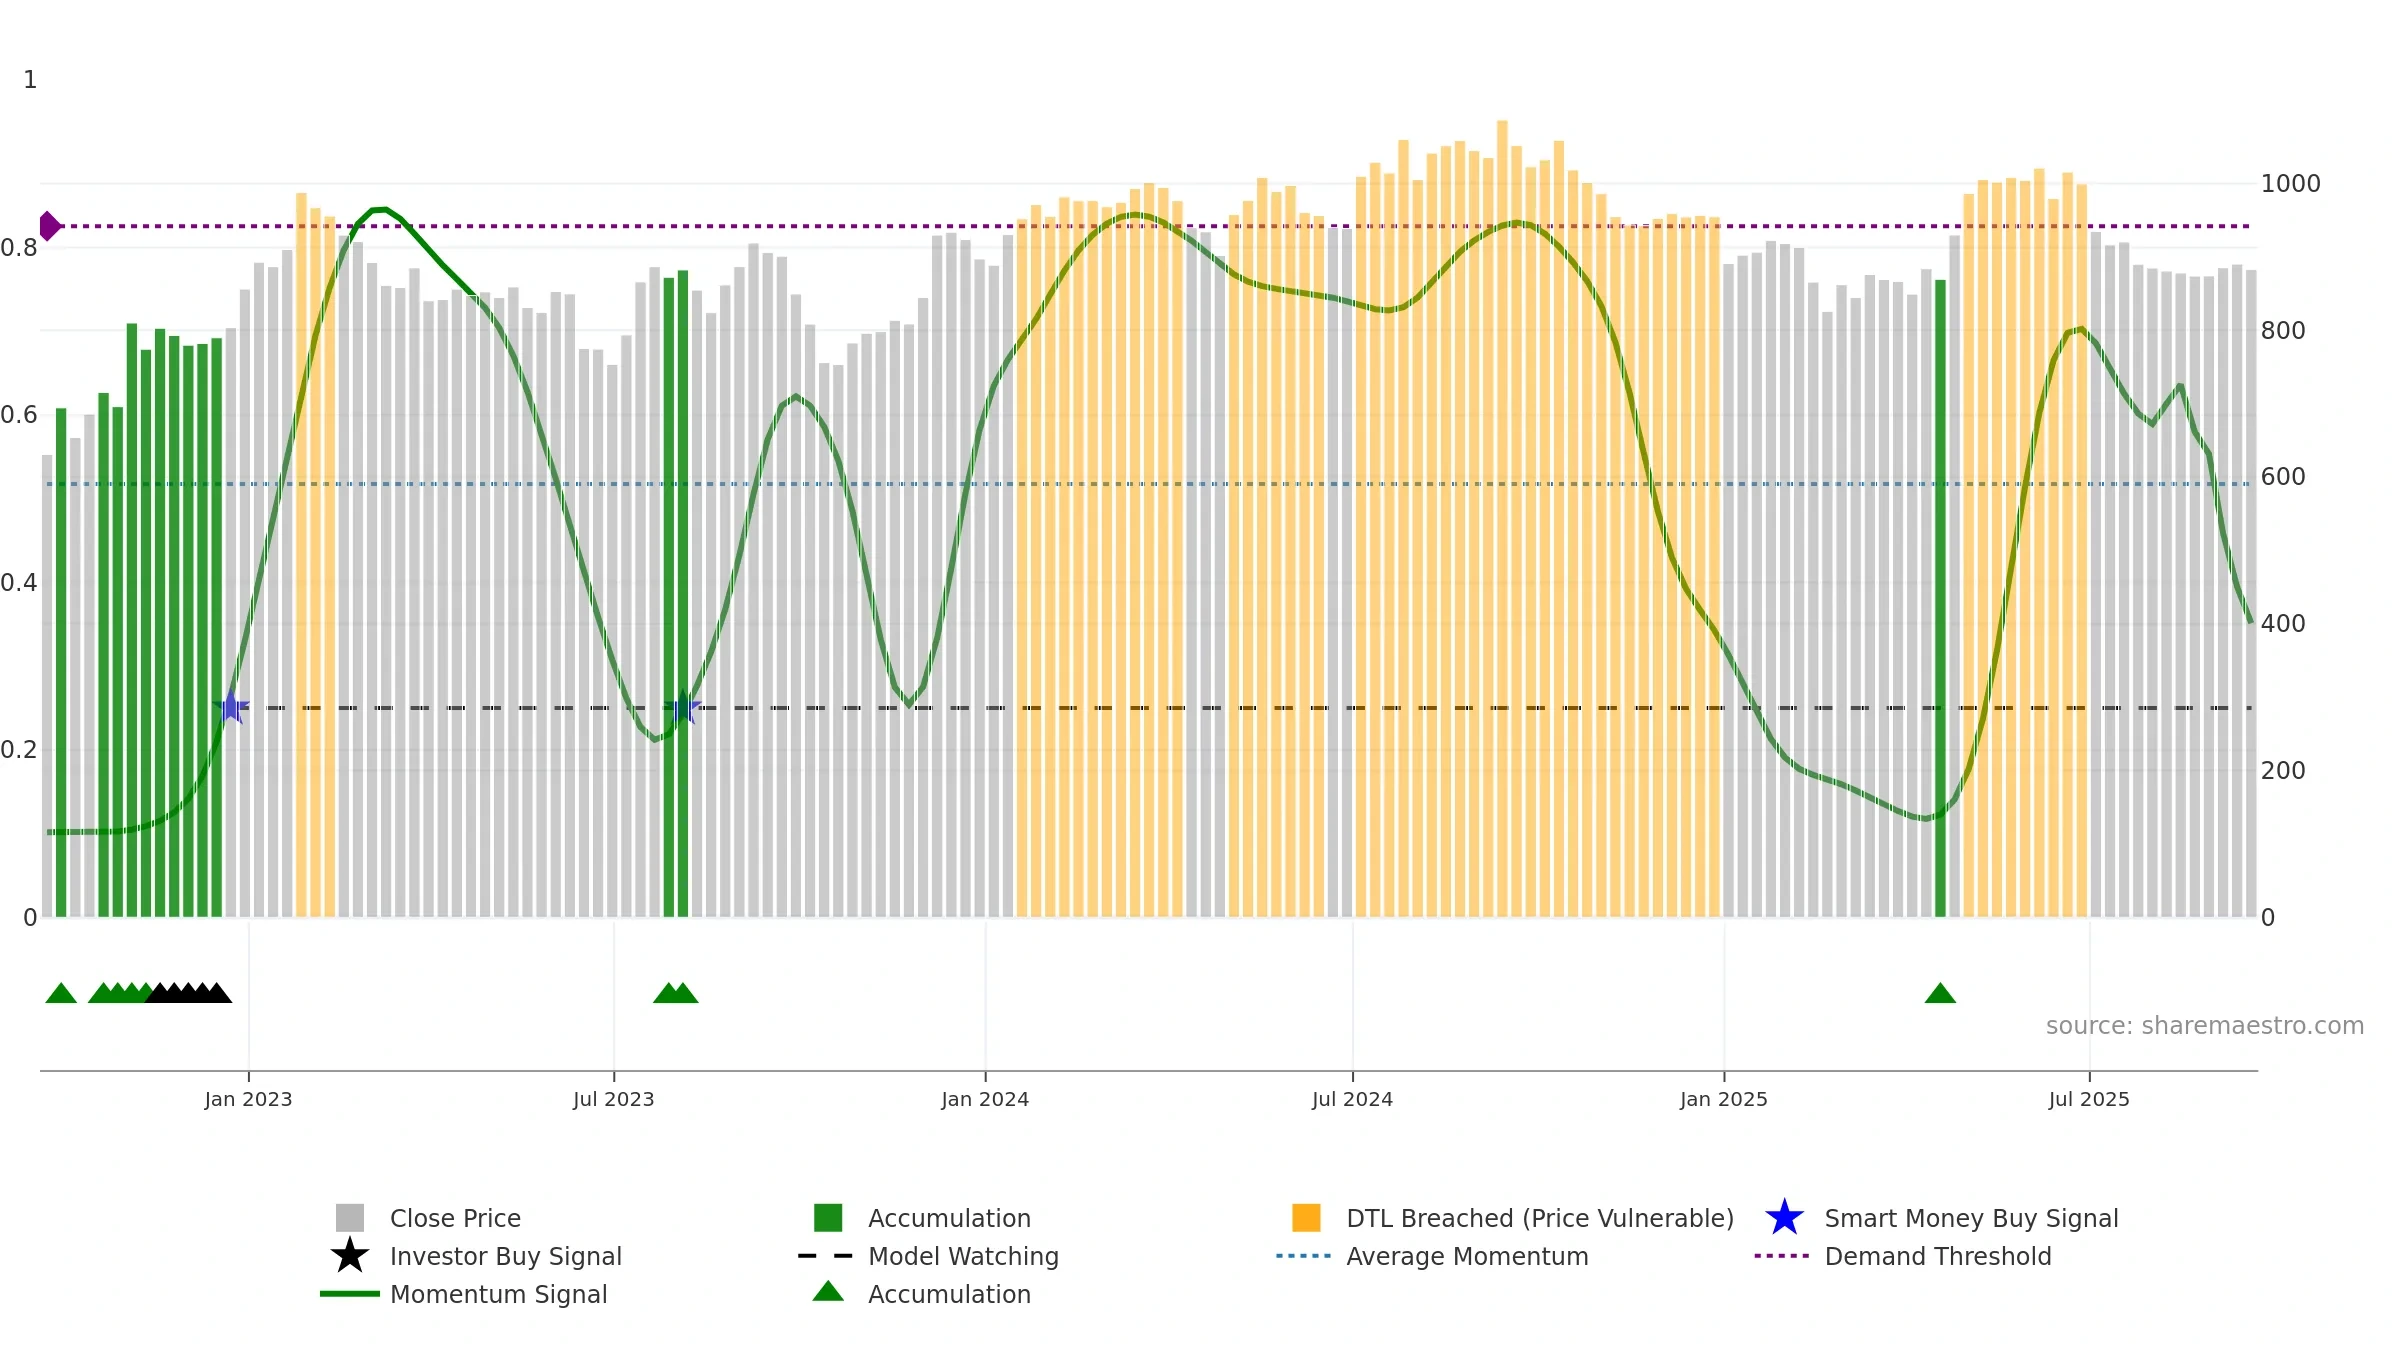
Weekly Report
Grafton Group plc closed at 882.9000 (-1.90% WoW) . Data window ends Fri, 19 Sep 2025.
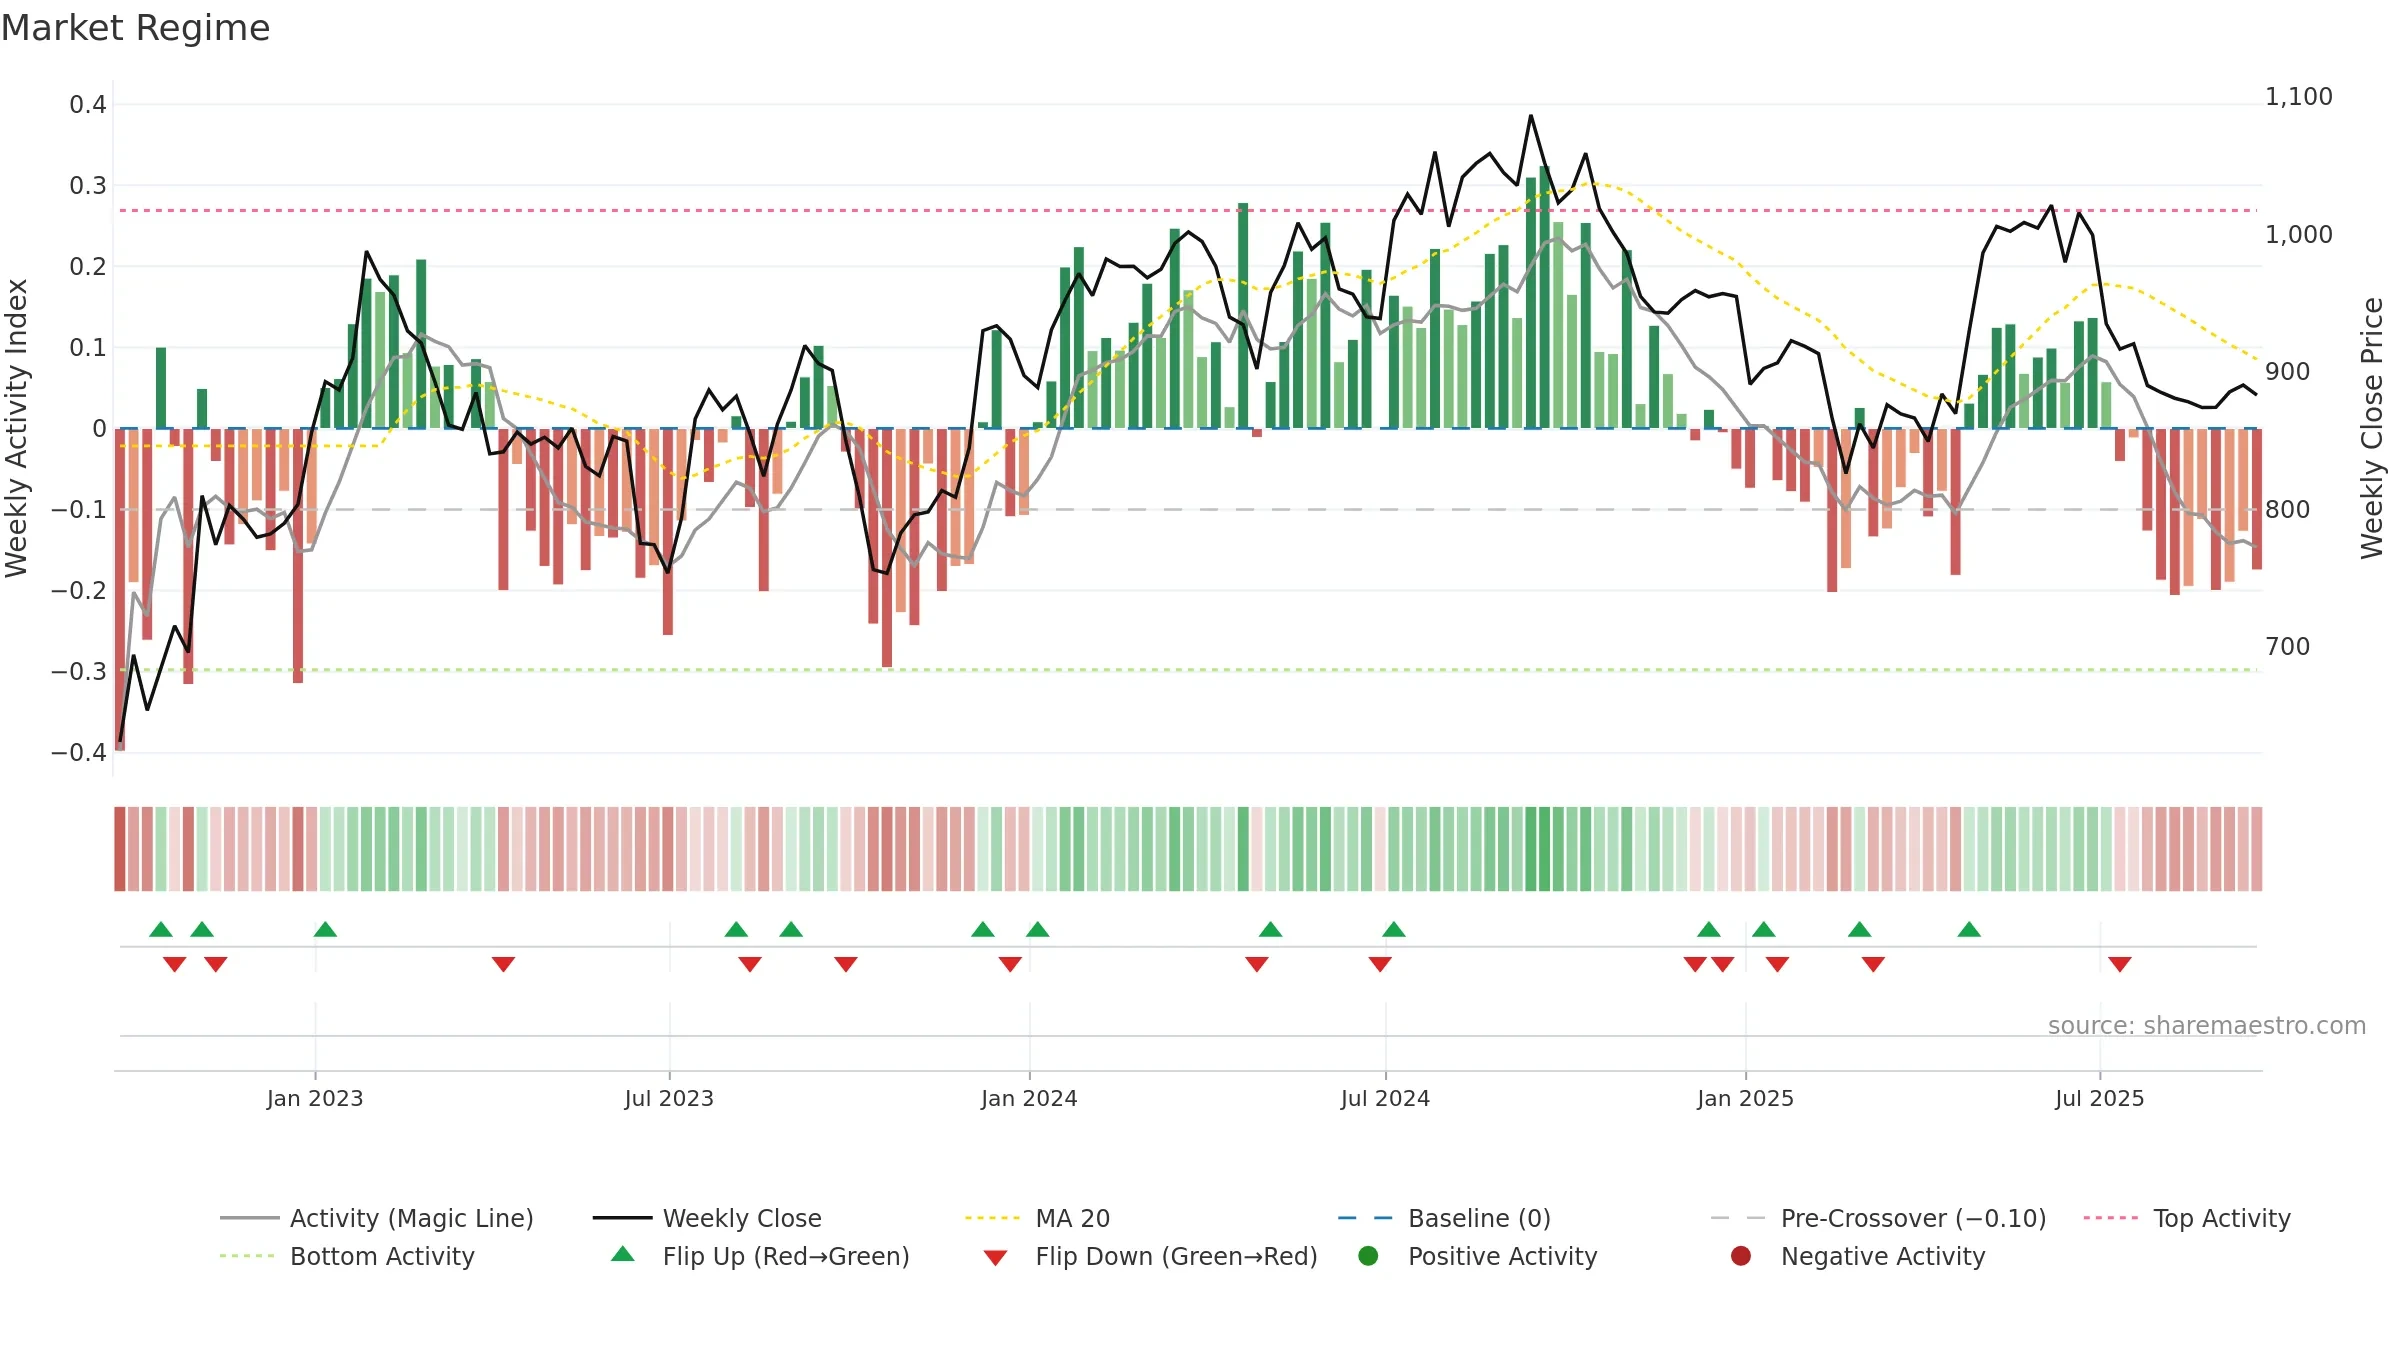
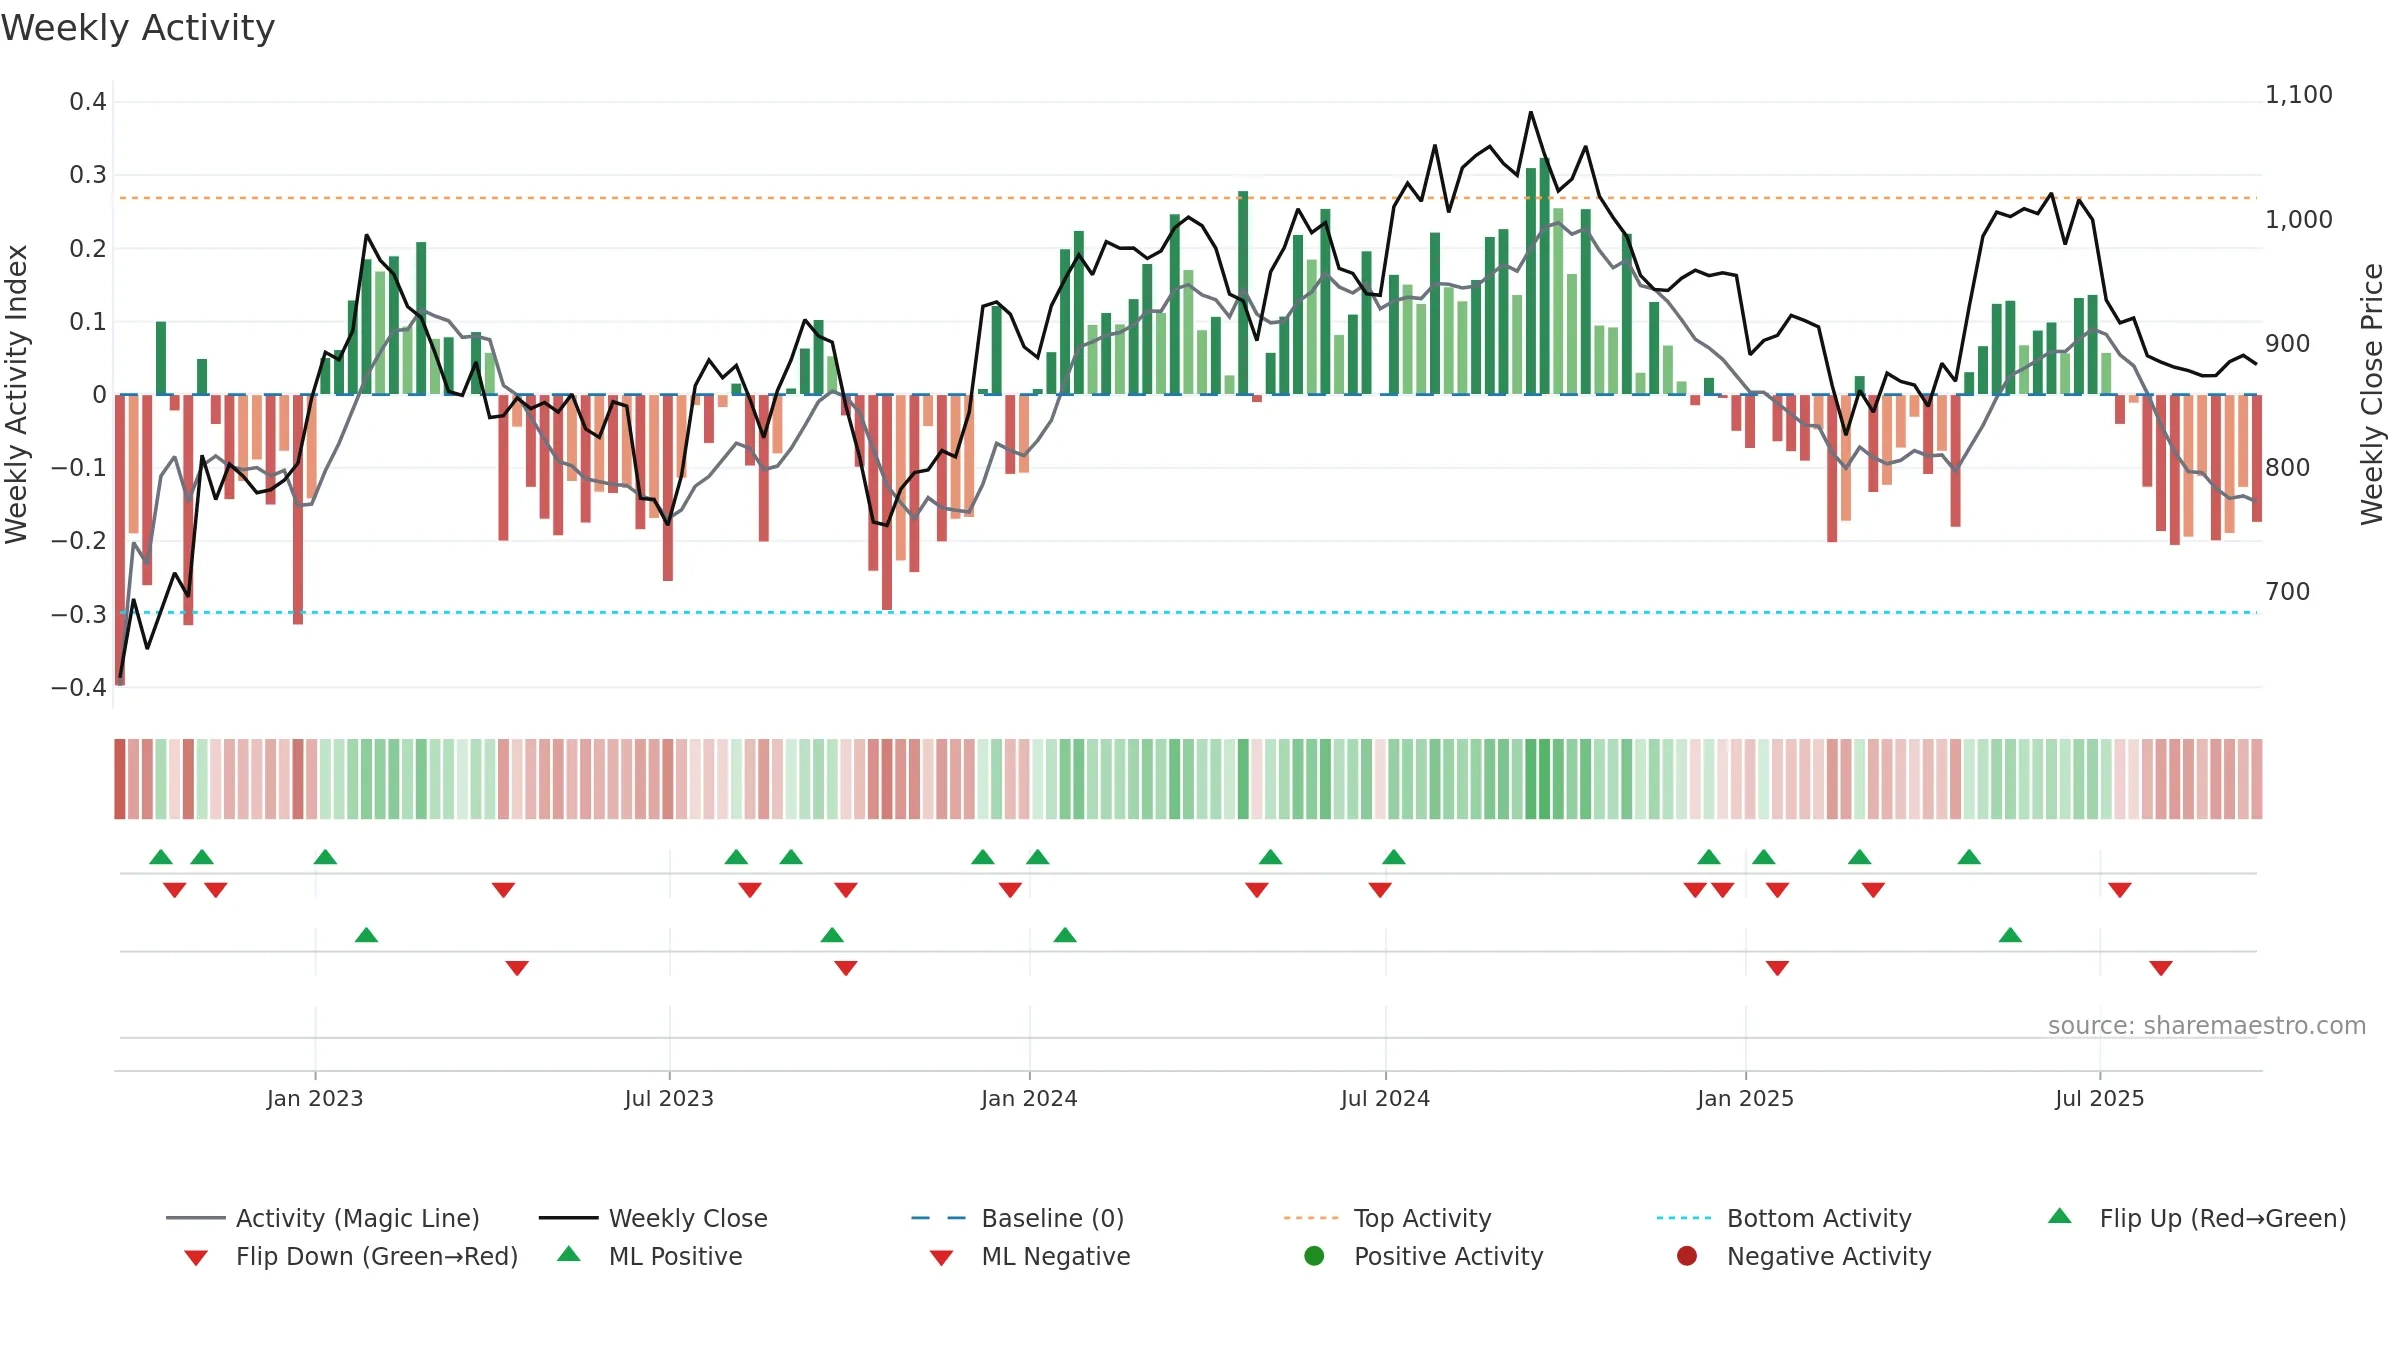
How to read this — Price slope is upward, indicating persistent buying over the window. Low weekly volatility favours steadier follow-through. Volume and price are moving in the same direction — a constructive confirmation. Returns are negatively correlated with volume — strength may come on lighter activity. Fresh short-term crossover improves near-term tone.
Up-slope supports buying interest; pullbacks may be contained if activity stays firm.
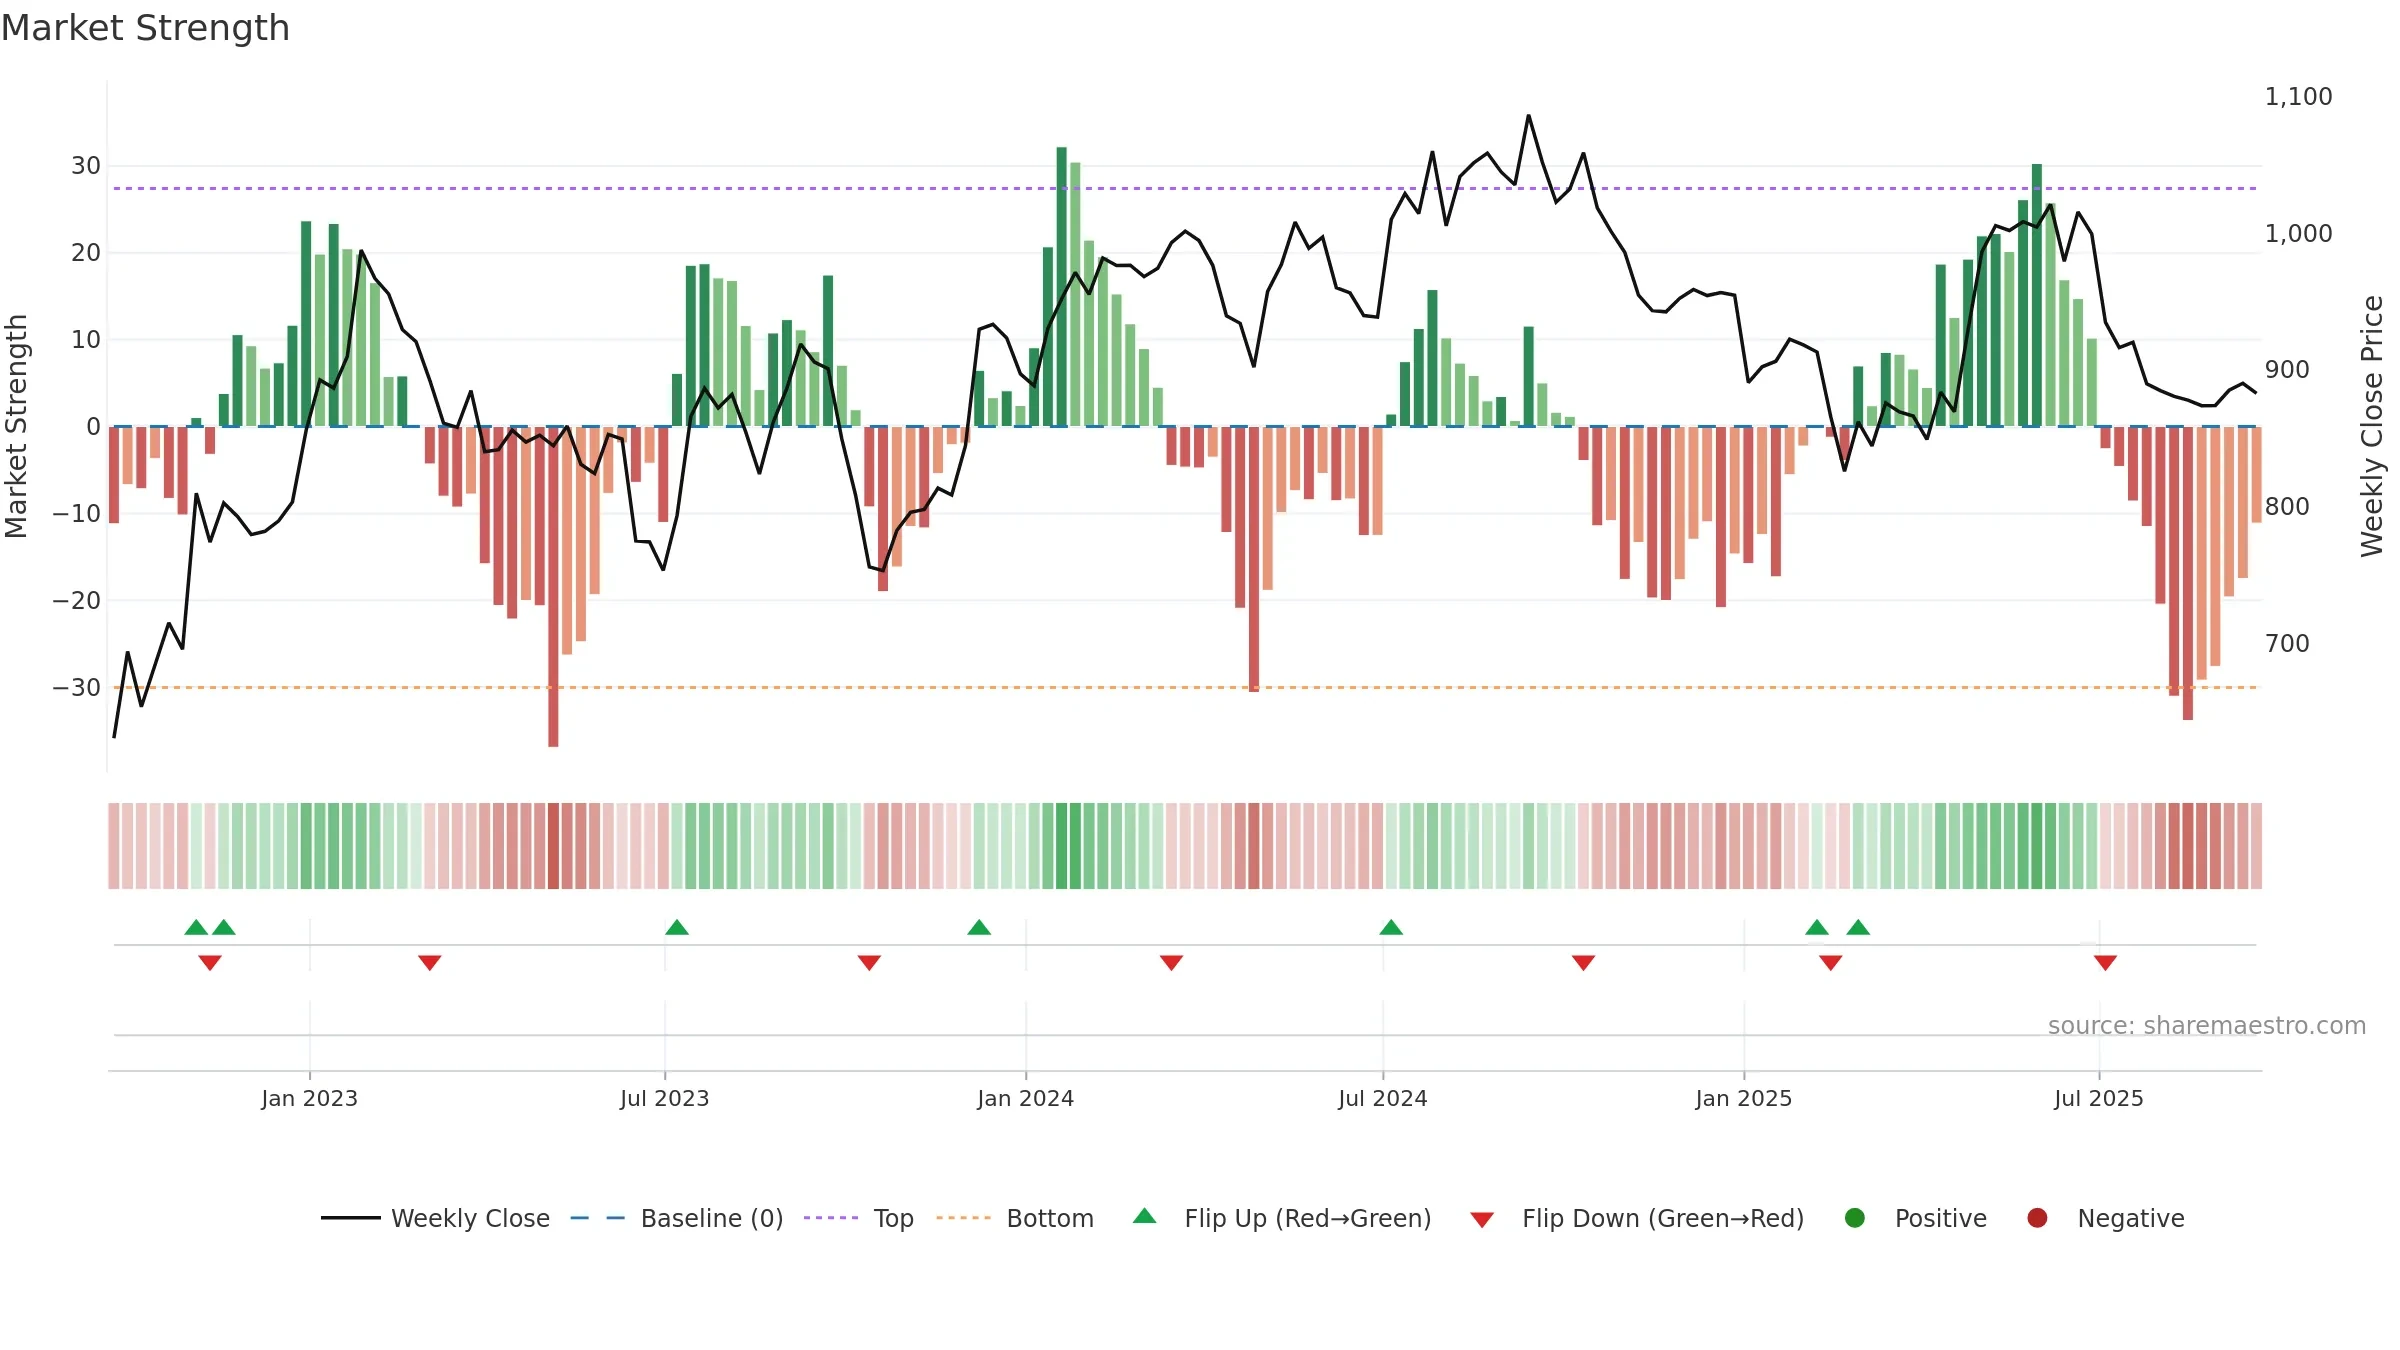
Gauge maps the trend signal to a 0–100 scale.
How to read this — Bearish zone with falling momentum — sellers in control. Loss of the ~0.50 midline after strength suggests regime shift. Sub-0.40 print confirms downside control.
Bias remains lower; rallies are suspect unless gauge reclaims 0.50/0.60.
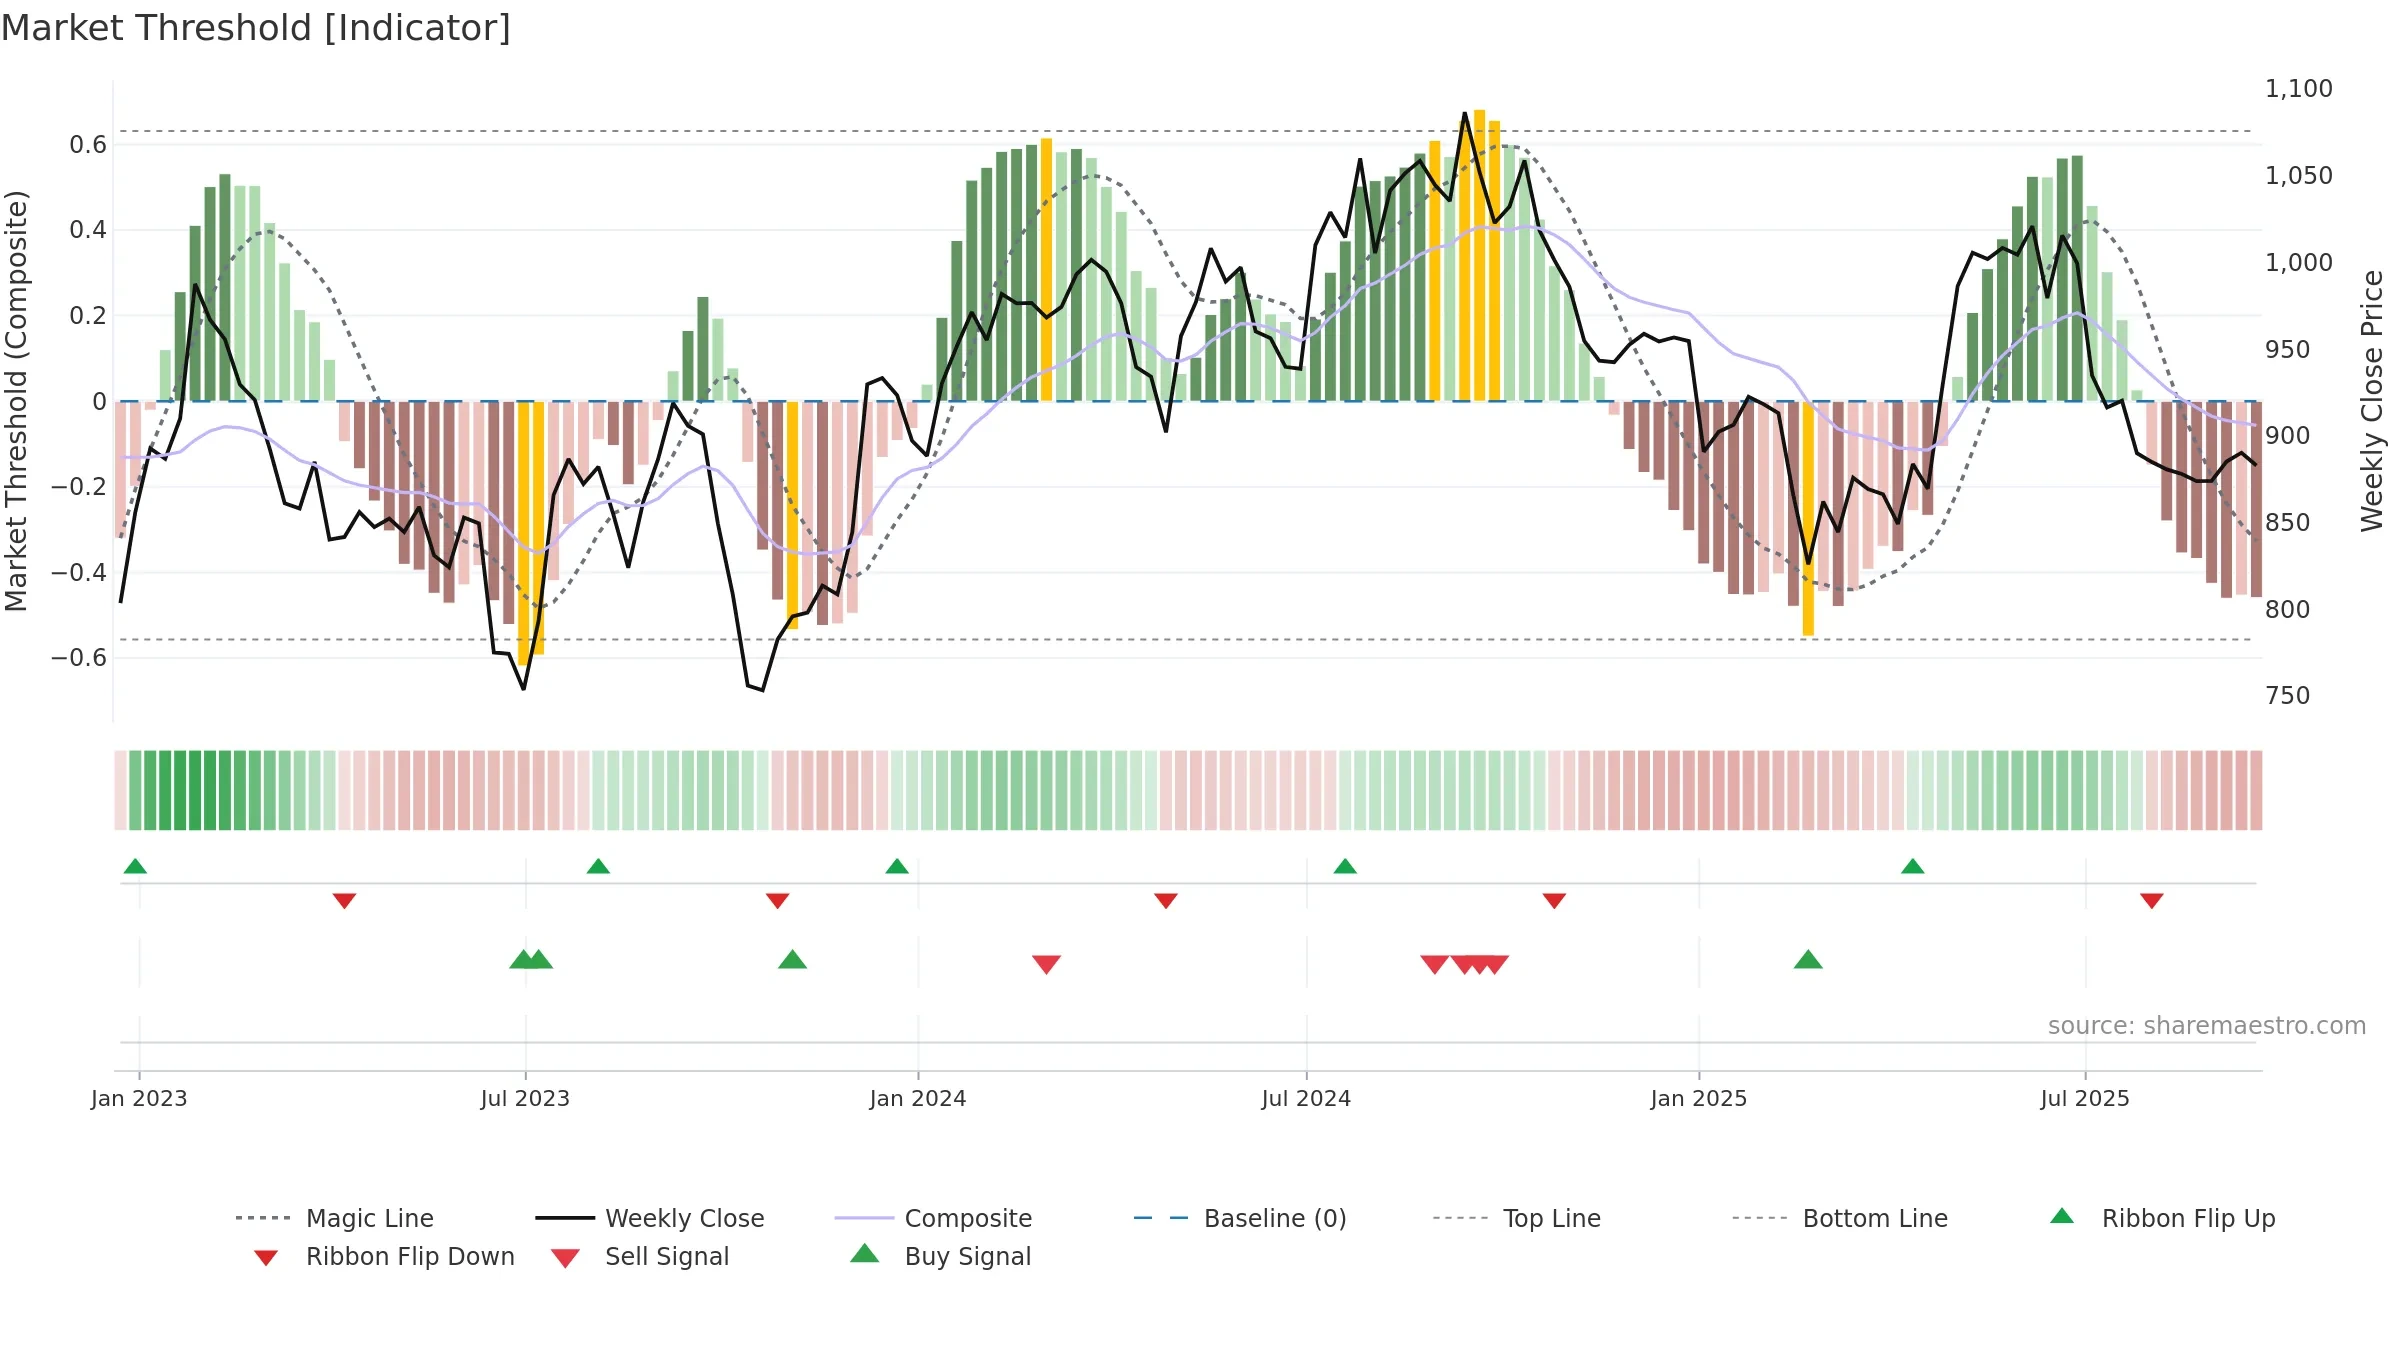
The flag is positive: favourable upside skew with supportive conditions.
Conclusion
Negative setup. ★★☆☆☆ confidence. Price window: -0. Trend: Downtrend Confirmed; gauge 35. In combination, liquidity confirms the move.
- Liquidity confirms the price trend
- Low return volatility supports durability
- Bearish control with falling momentum
- Momentum is weak/falling
- Price is not above key averages
- Negative multi-week performance
Why: Price window -0.23% over 8w. Close is -0.83% below the prior-window high. Return volatility 1.48%. Volume trend rising. Liquidity convergence with price. Trend state downtrend confirmed. 4–8w crossover bullish. Momentum bearish and falling. Valuation stance positive.
Tip: Most metrics include a hover tooltip where they appear in the report.