Nordson Corporation
NDSN NASDAQ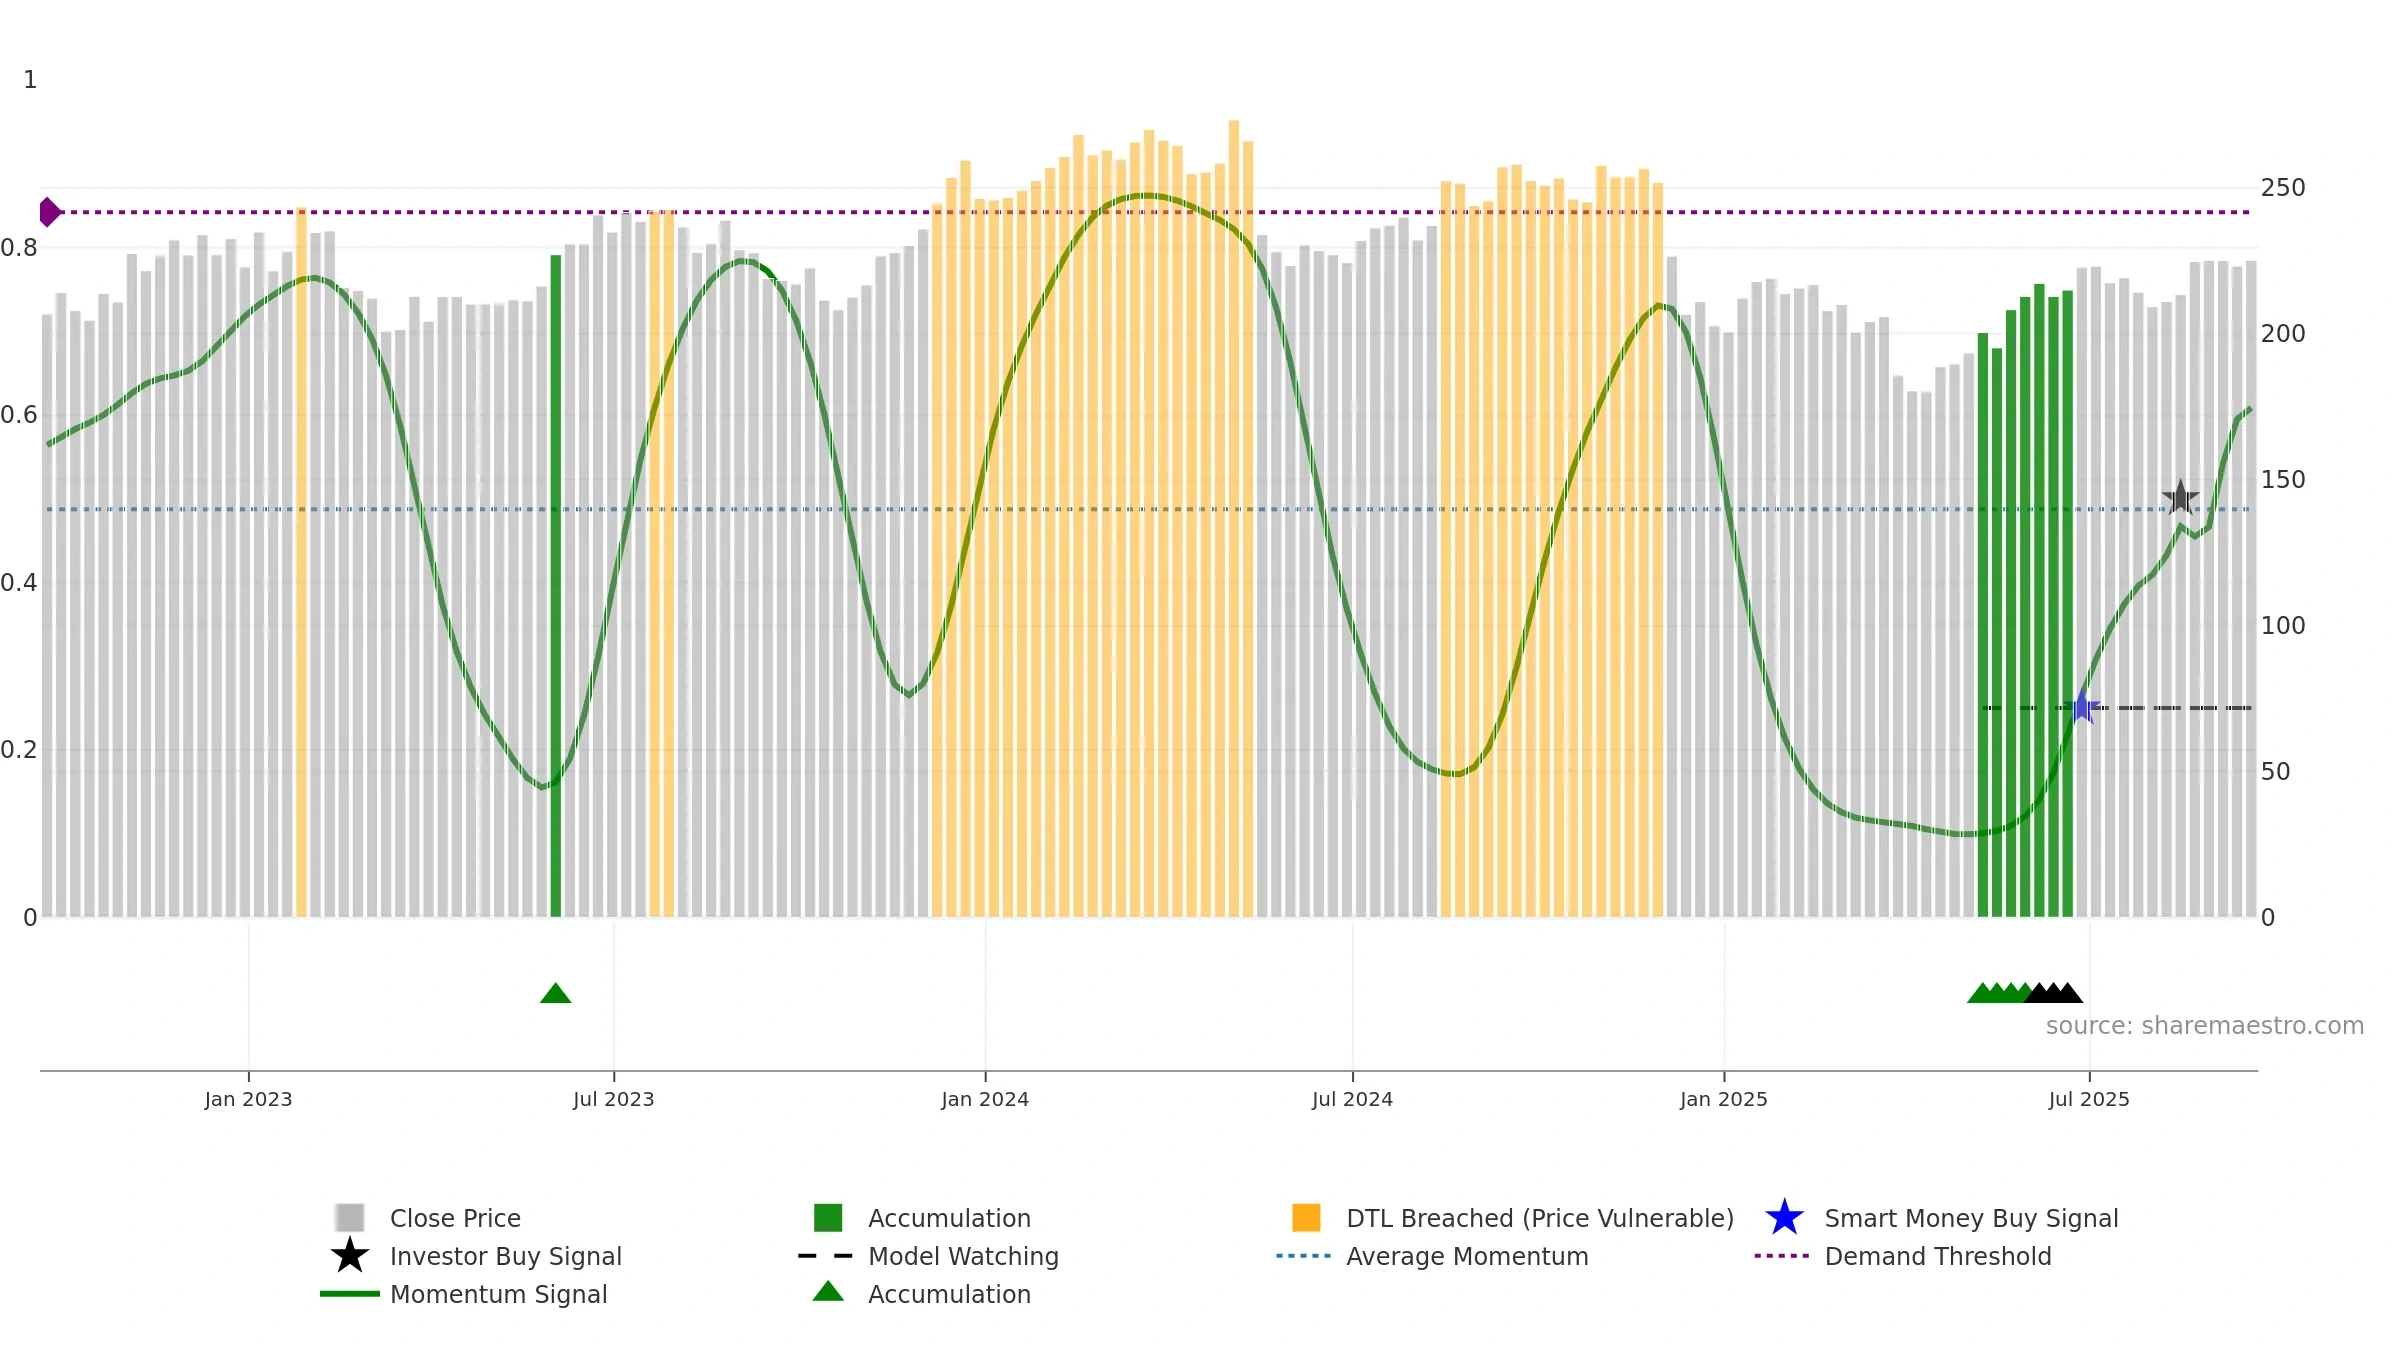
Weekly Summary
Nordson Corporation closed at 225.0800 (-1.36% WoW) . Data window ends Fri, 19 Sep 2025.
How to read this — Price slope is upward, indicating persistent buying over the window. Low weekly volatility favours steadier follow-through. Volume trend diverges from price — watch for fatigue or rotation. Returns are positively correlated with volume — strength tends to arrive on higher activity. Constructive MA stack supports the up-drift; pullbacks may find support at the 8–13 week region. Price holds above key averages, indicating constructive participation.
Up-slope supports buying interest; pullbacks may be contained if activity stays firm. Because liquidity isn’t confirming, prefer evidence of fresh demand before chasing moves.
Gauge maps the trend signal to a 0–100 scale.
How to read this — High gauge and rising momentum — buyers in control.
Bias remains higher; pullbacks could be buyable if participation holds.

Relative strength is Negative
(< 0%, underperforming).
Latest MRS: -7.44% (week ending Fri, 19 Sep 2025).
Slope: Rising over 8w.
Notes:
- Below zero line indicates relative weakness vs benchmark.
- MRS slope rising over ~8 weeks.
Price is above fair value; upside may be capped without catalysts.
Conclusion
Positive setup. ★★★★⯪ confidence. Trend: Strong Uptrend · 7.57% over window · vol 1.11% · liquidity divergence · posture above
- High gauge with rising momentum (strong uptrend)
- Momentum is bullish and rising
- Price holds above 8–26 week averages
- Constructive moving-average stack
- Liquidity diverges from price
Why: Price window 7.57% over w. Return volatility 1.11%. Volume trend falling. Liquidity divergence with price. Trend state strong uptrend. MA stack constructive. Momentum bullish and rising. Valuation limited upside without catalysts.
Tip: Most metrics include a hover tooltip where they appear in the report.