Schroder Oriental Income Ord
SOI LSE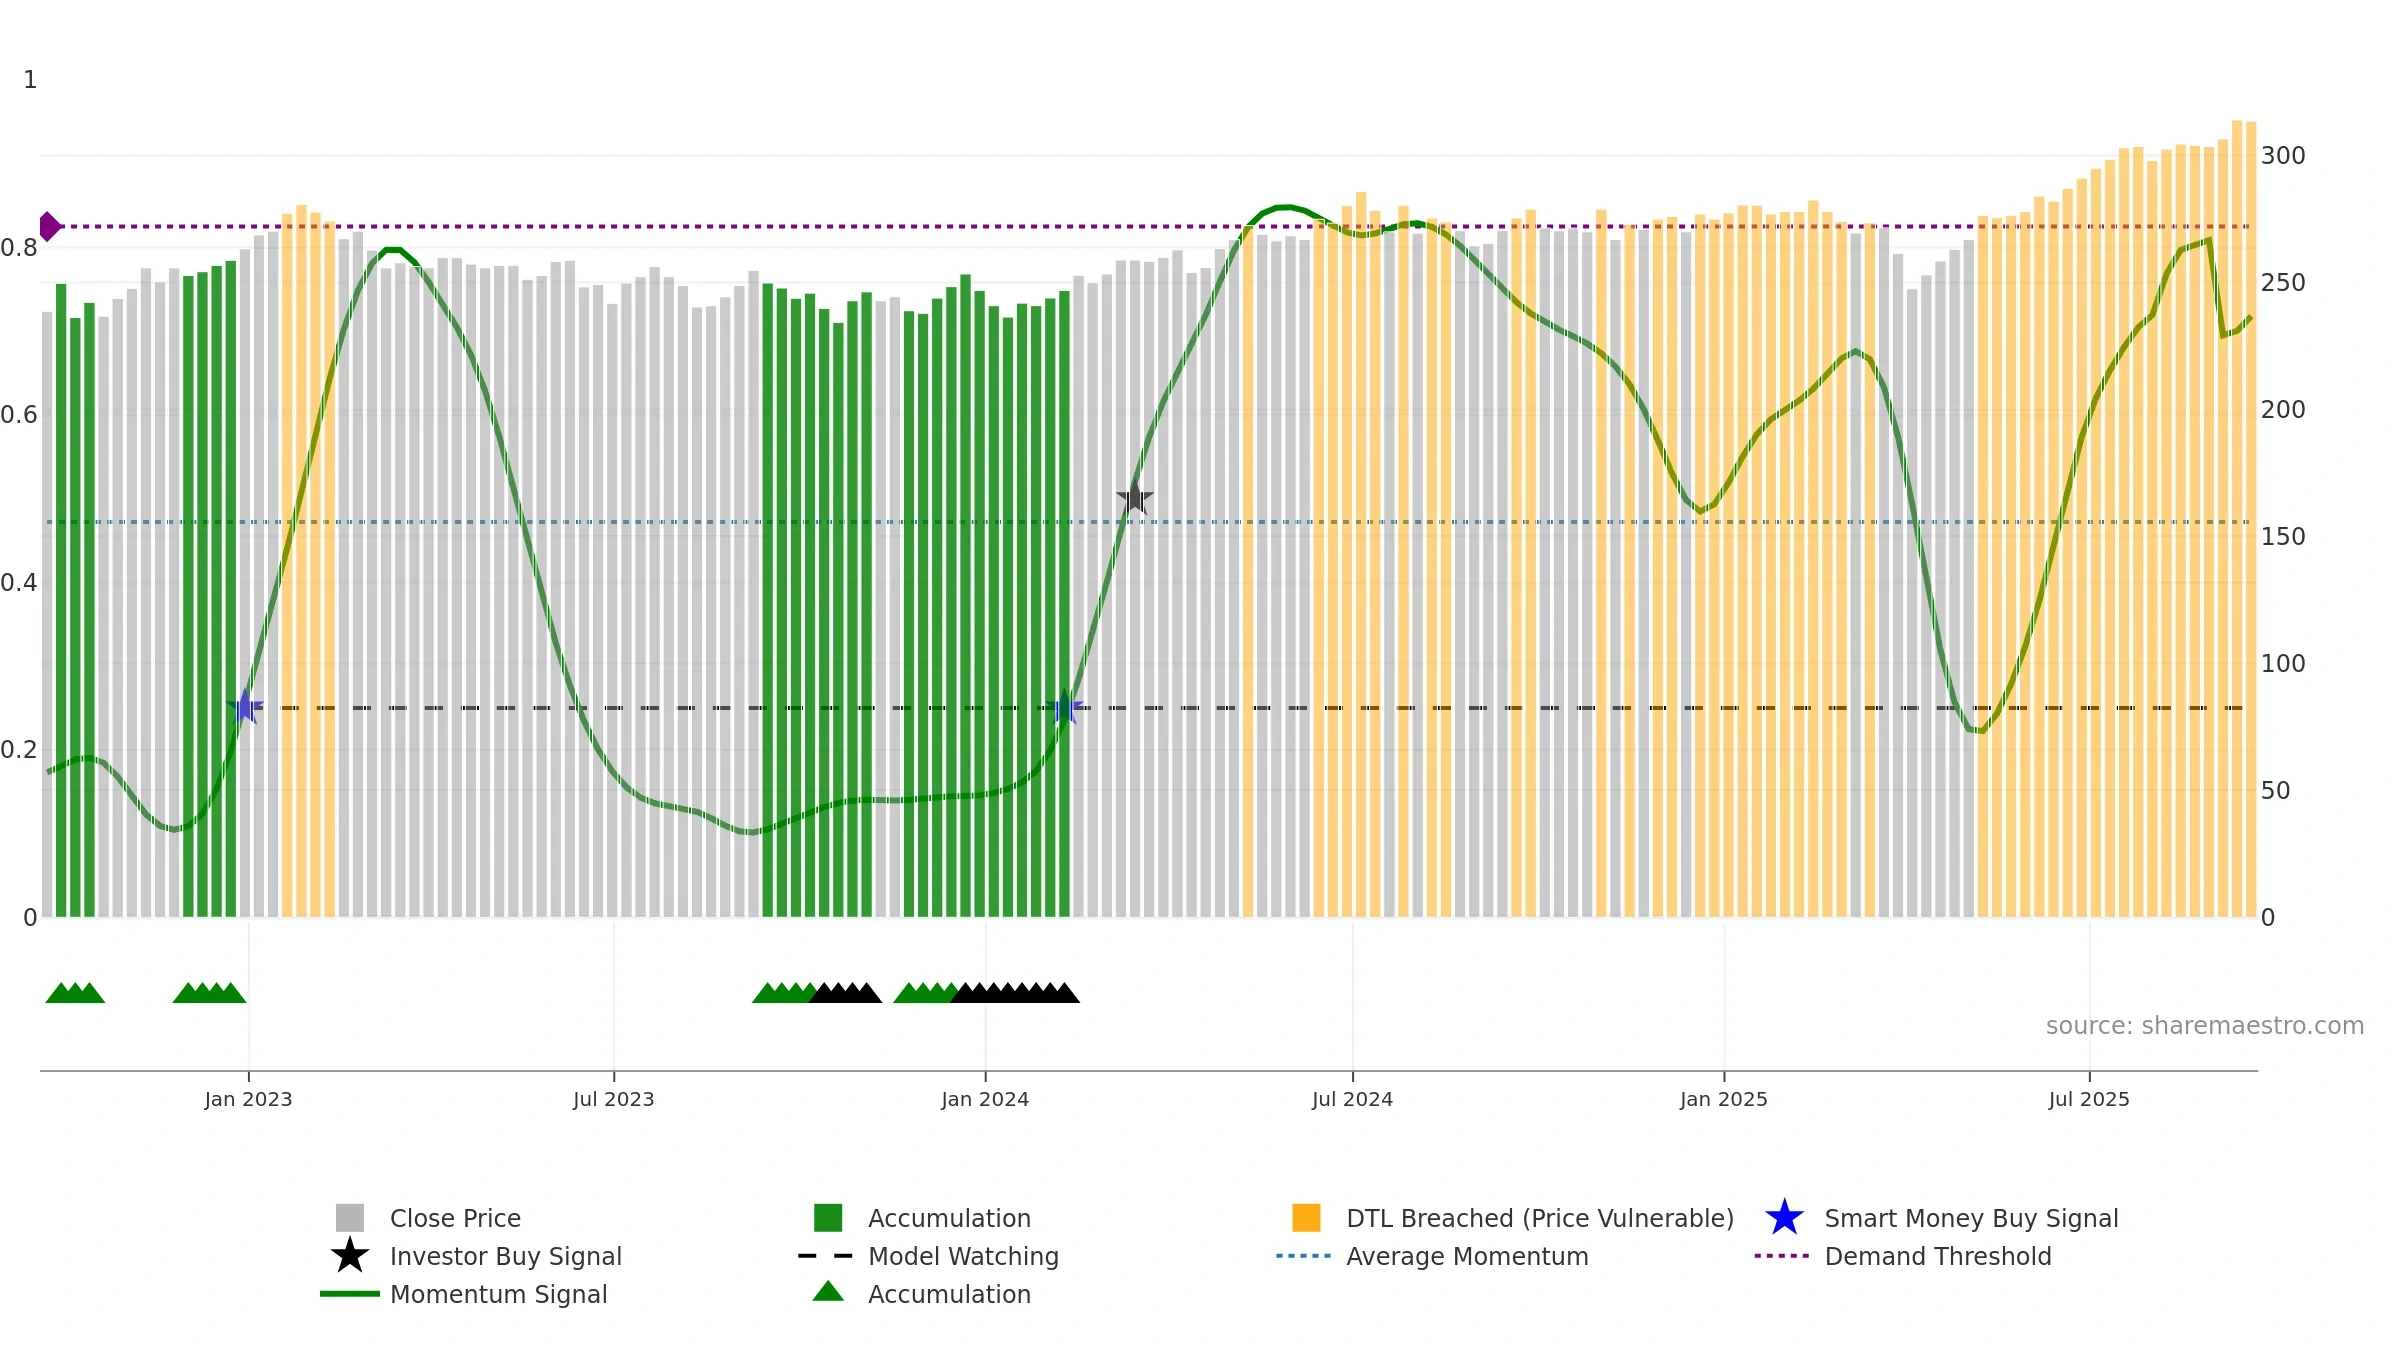
Weekly Report
Schroder Oriental Income Ord closed at 313.5000 (-0.48% WoW) . Data window ends Fri, 19 Sep 2025.
How to read this — Price slope is upward, indicating persistent buying over the window. Low weekly volatility favours steadier follow-through. Volume and price are moving in the same direction — a constructive confirmation. Constructive MA stack supports the up-drift; pullbacks may find support at the 8–13 week region. Price holds above key averages, indicating constructive participation.
Up-slope supports buying interest; pullbacks may be contained if activity stays firm.
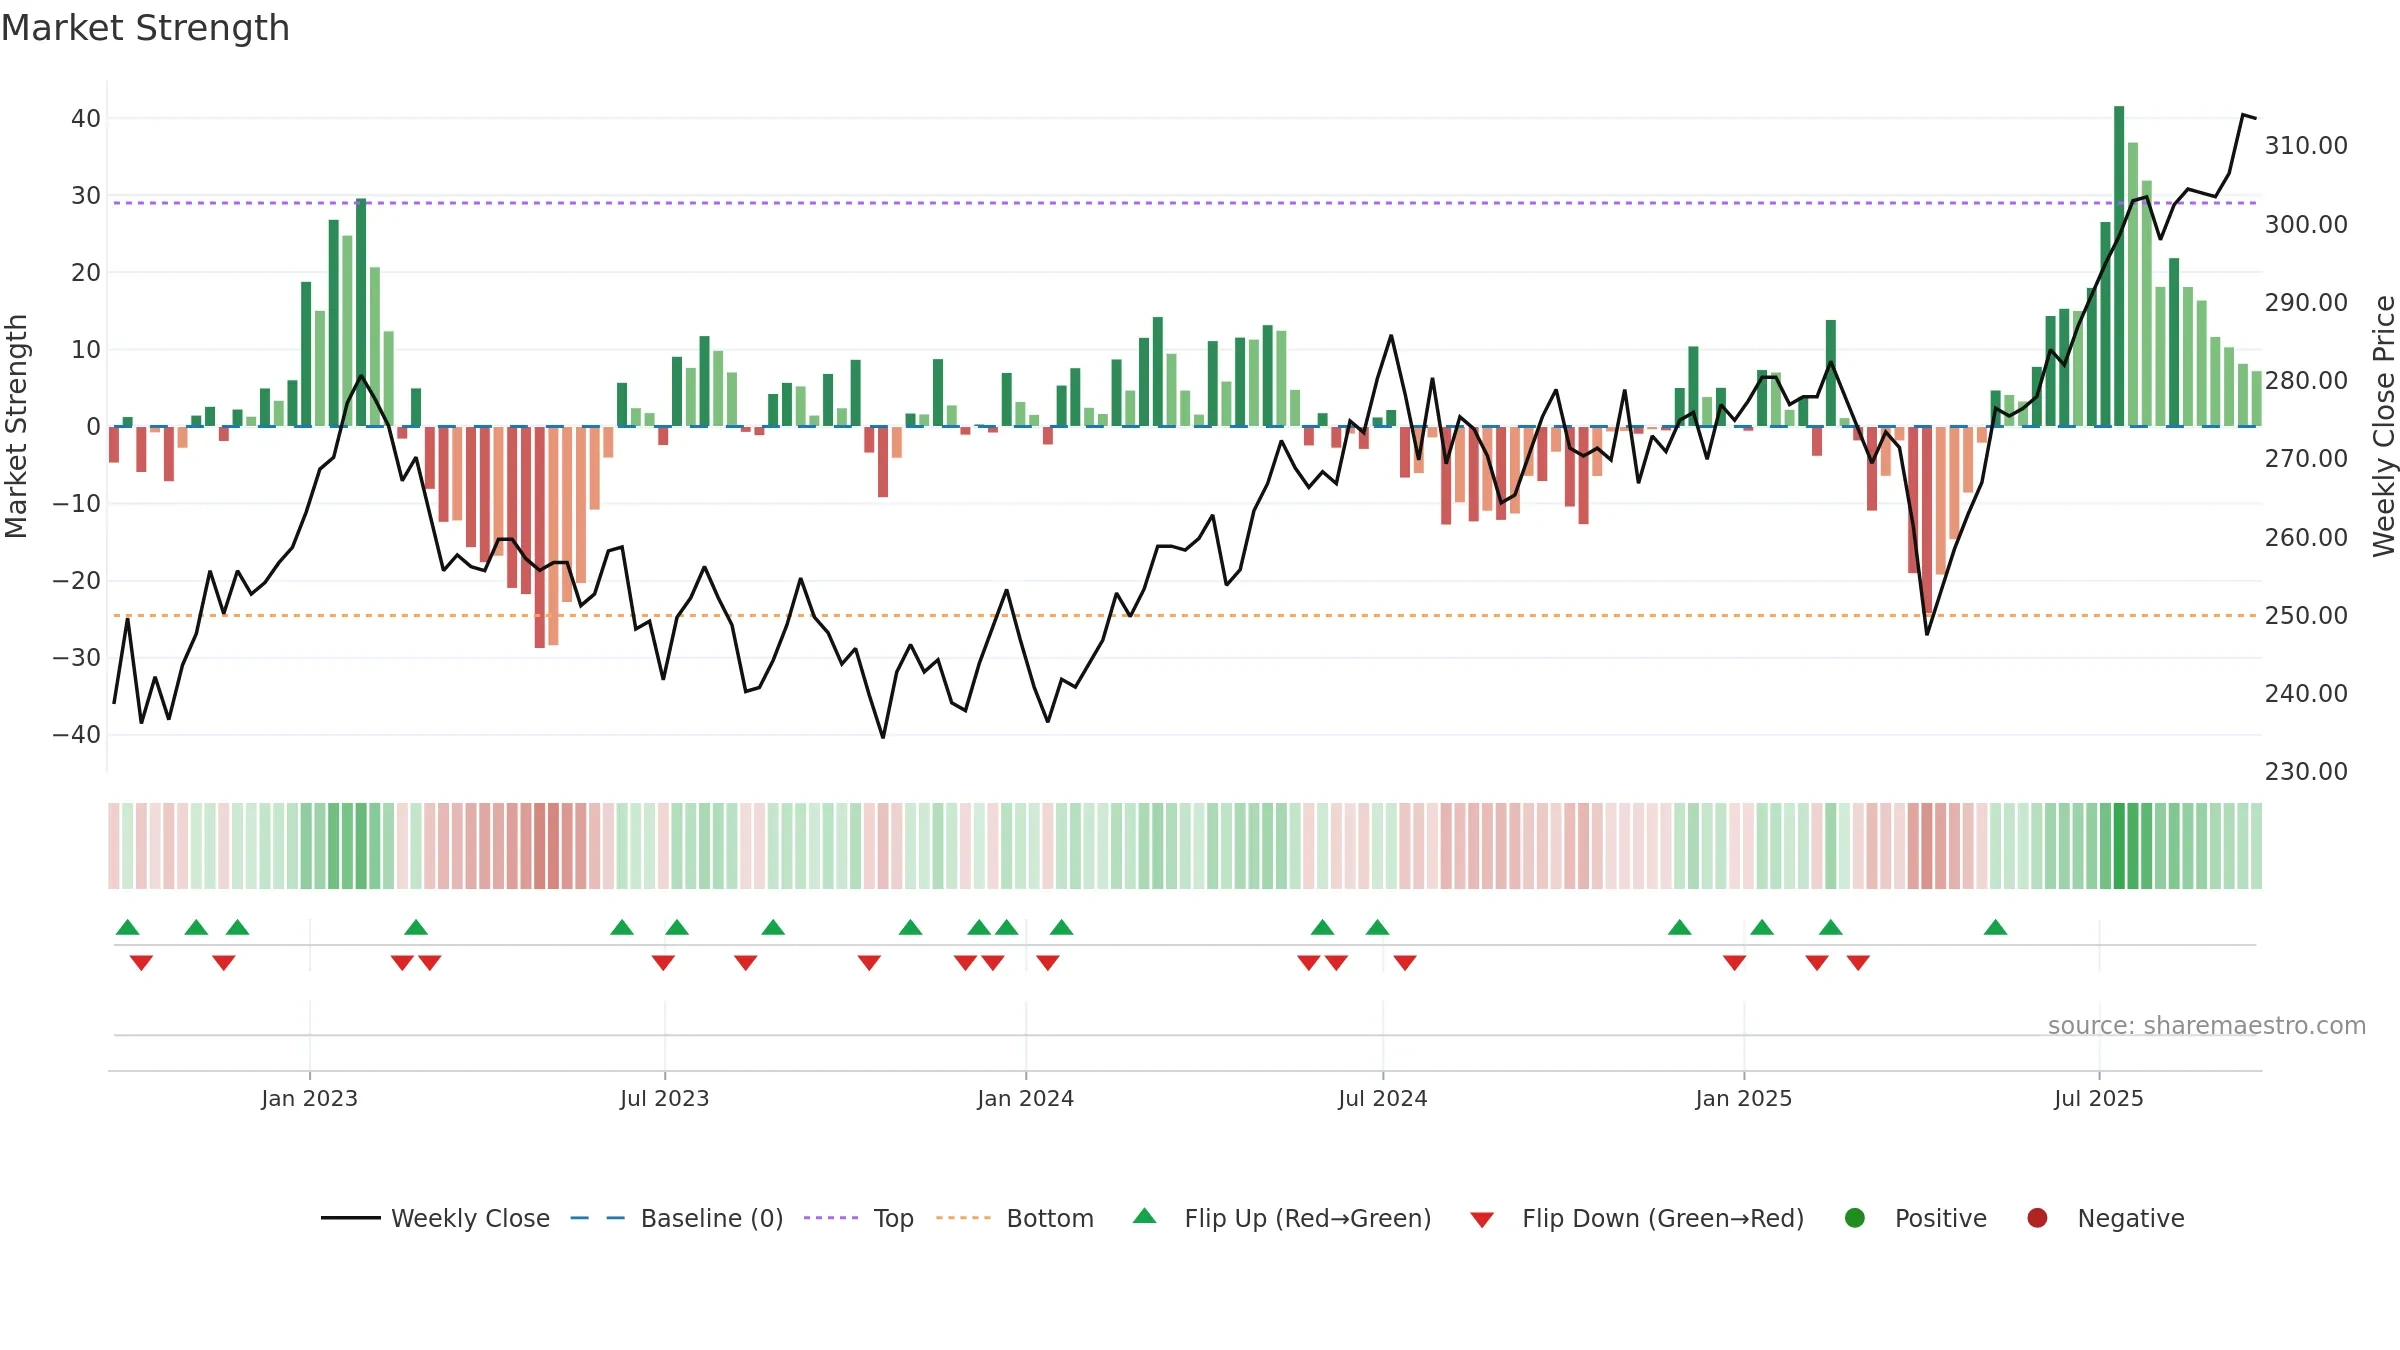
Gauge maps the trend signal to a 0–100 scale.
How to read this — Gauge is elevated but momentum is rolling over; topping risk is rising. Notable breakdown from ≥0.80 weakens trend quality.
Stay alert: protect gains or seek confirmation before adding risk.
Conclusion
Negative setup. ★★☆☆☆ confidence. Price window: 5. Trend: Uptrend at Risk; gauge 71. In combination, liquidity confirms the move.
- Price holds above 8w & 26w averages
- Constructive moving-average stack
- Liquidity confirms the price trend
- Low return volatility supports durability
- High-level but rolling over (topping risk)
- Momentum is weak/falling
- Sellers active at elevated levels (distribution)
- Recent breakdown from ≥0.80 weakens trend quality
Why: Price window 5.20% over 8w. Return volatility 0.52%. Volume trend rising. Liquidity convergence with price. Trend state uptrend at risk. High-regime (0.80–1.00) downticks 1/2 (50.0%) • Accumulating. MA stack constructive. Momentum bullish and falling.
Tip: Most metrics include a hover tooltip where they appear in the report.