SUI Group Holdings Limited
MCVT NASDAQ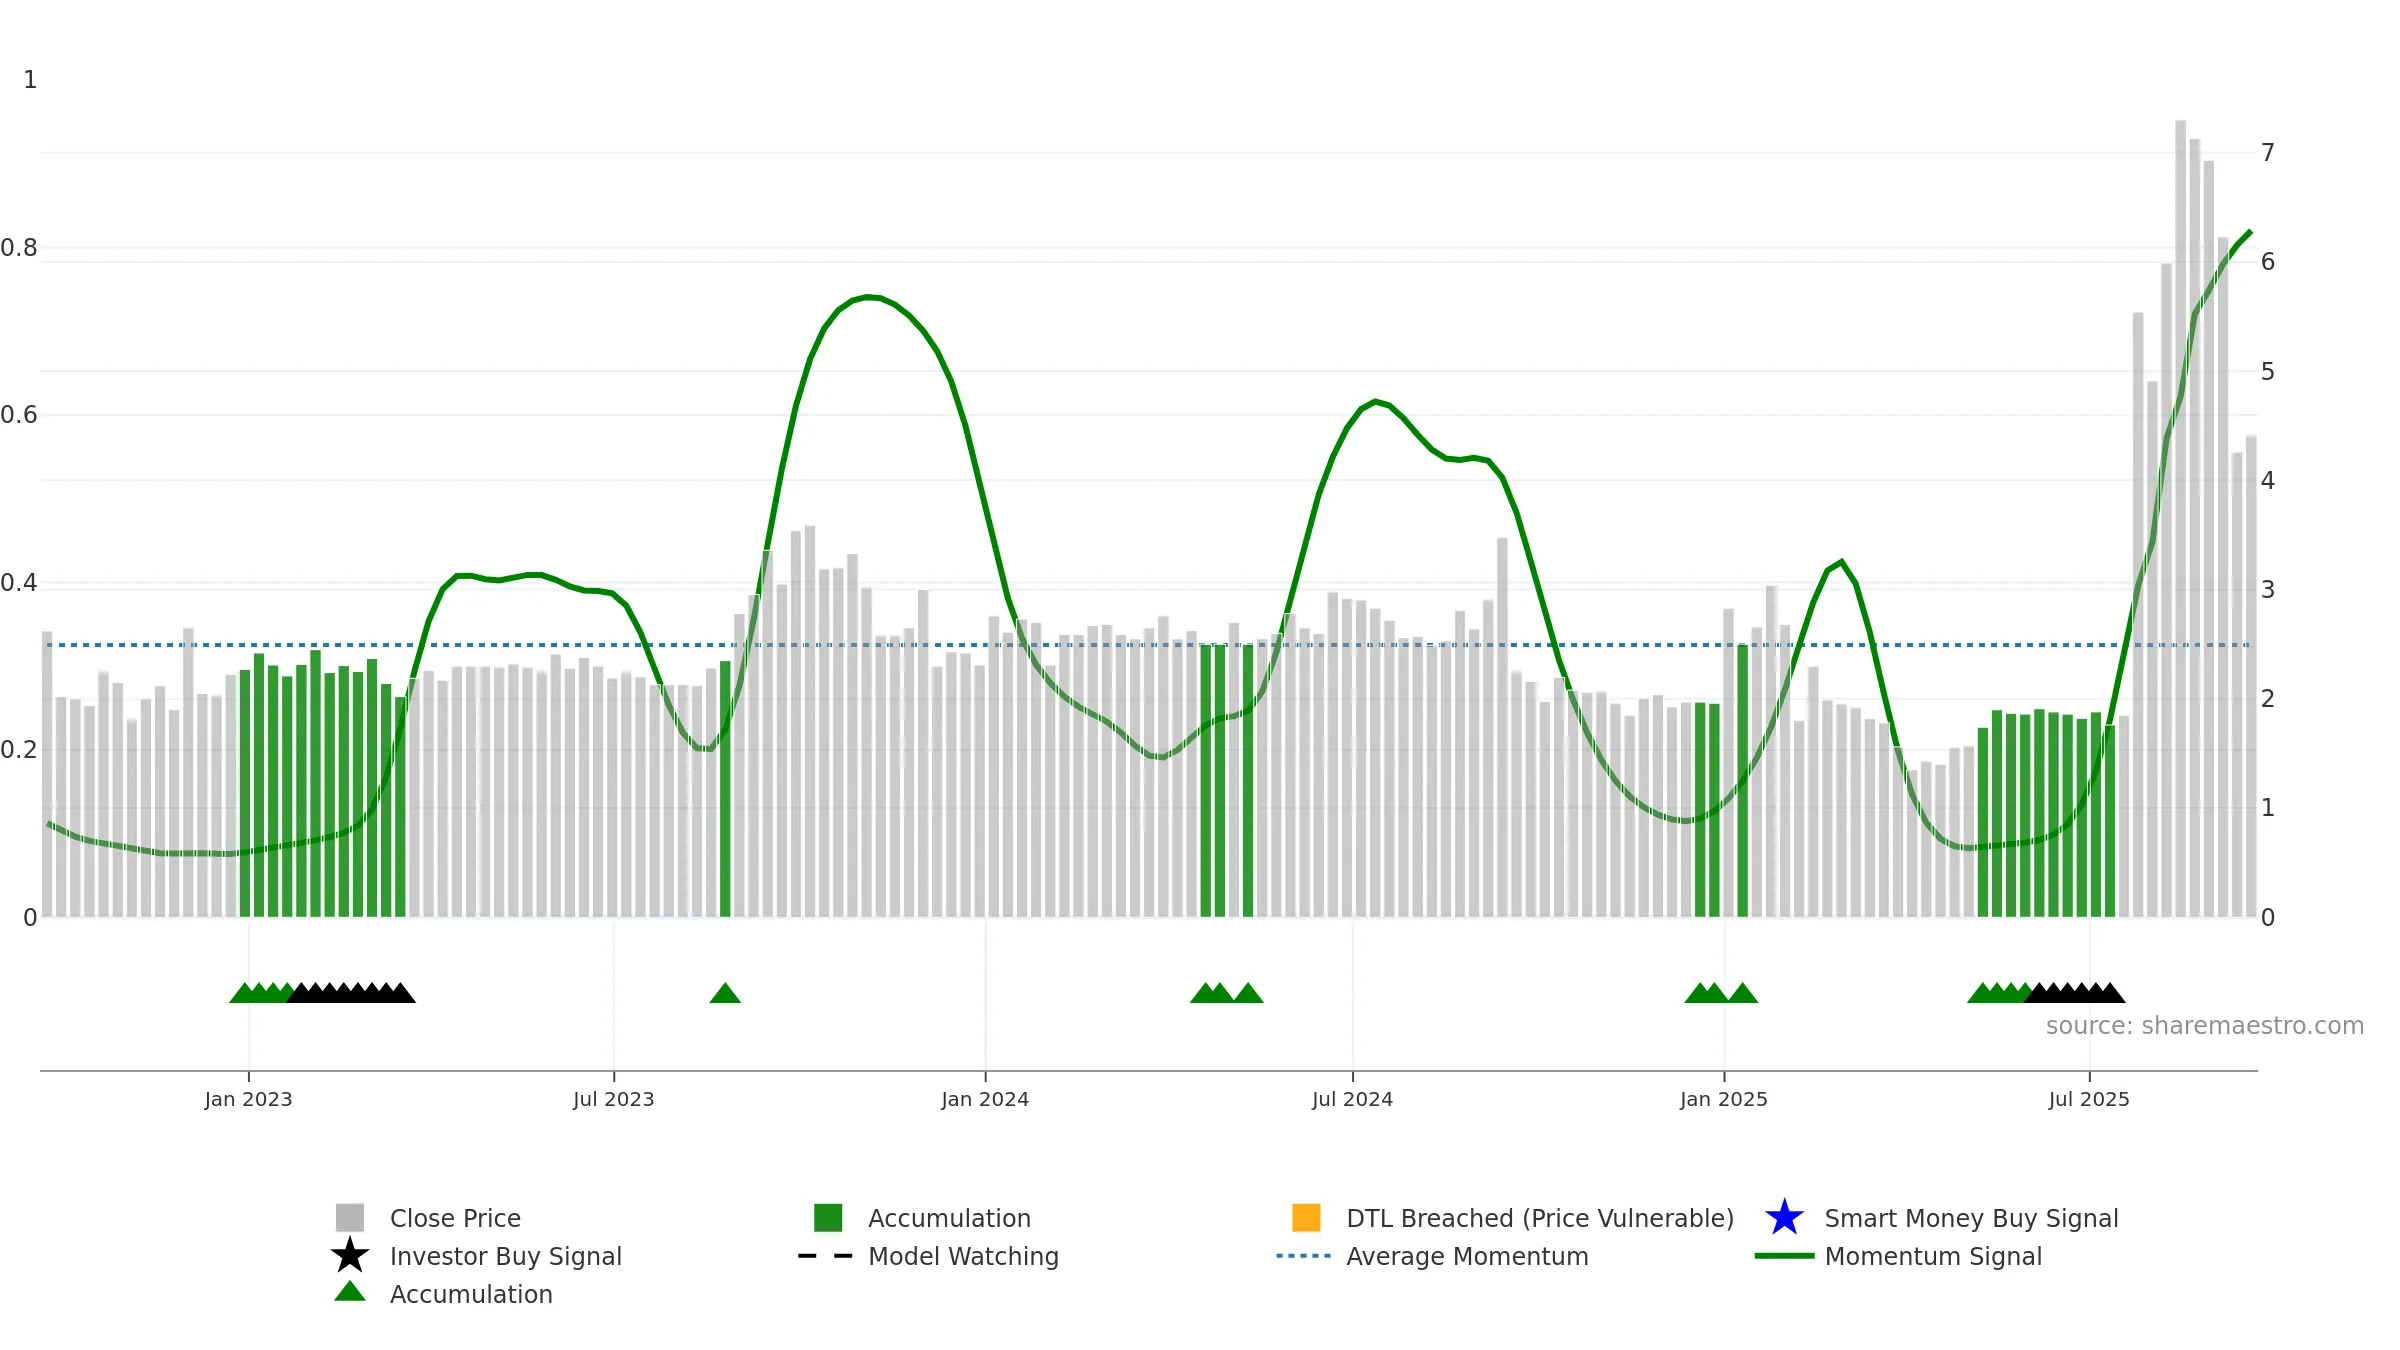
Weekly Report
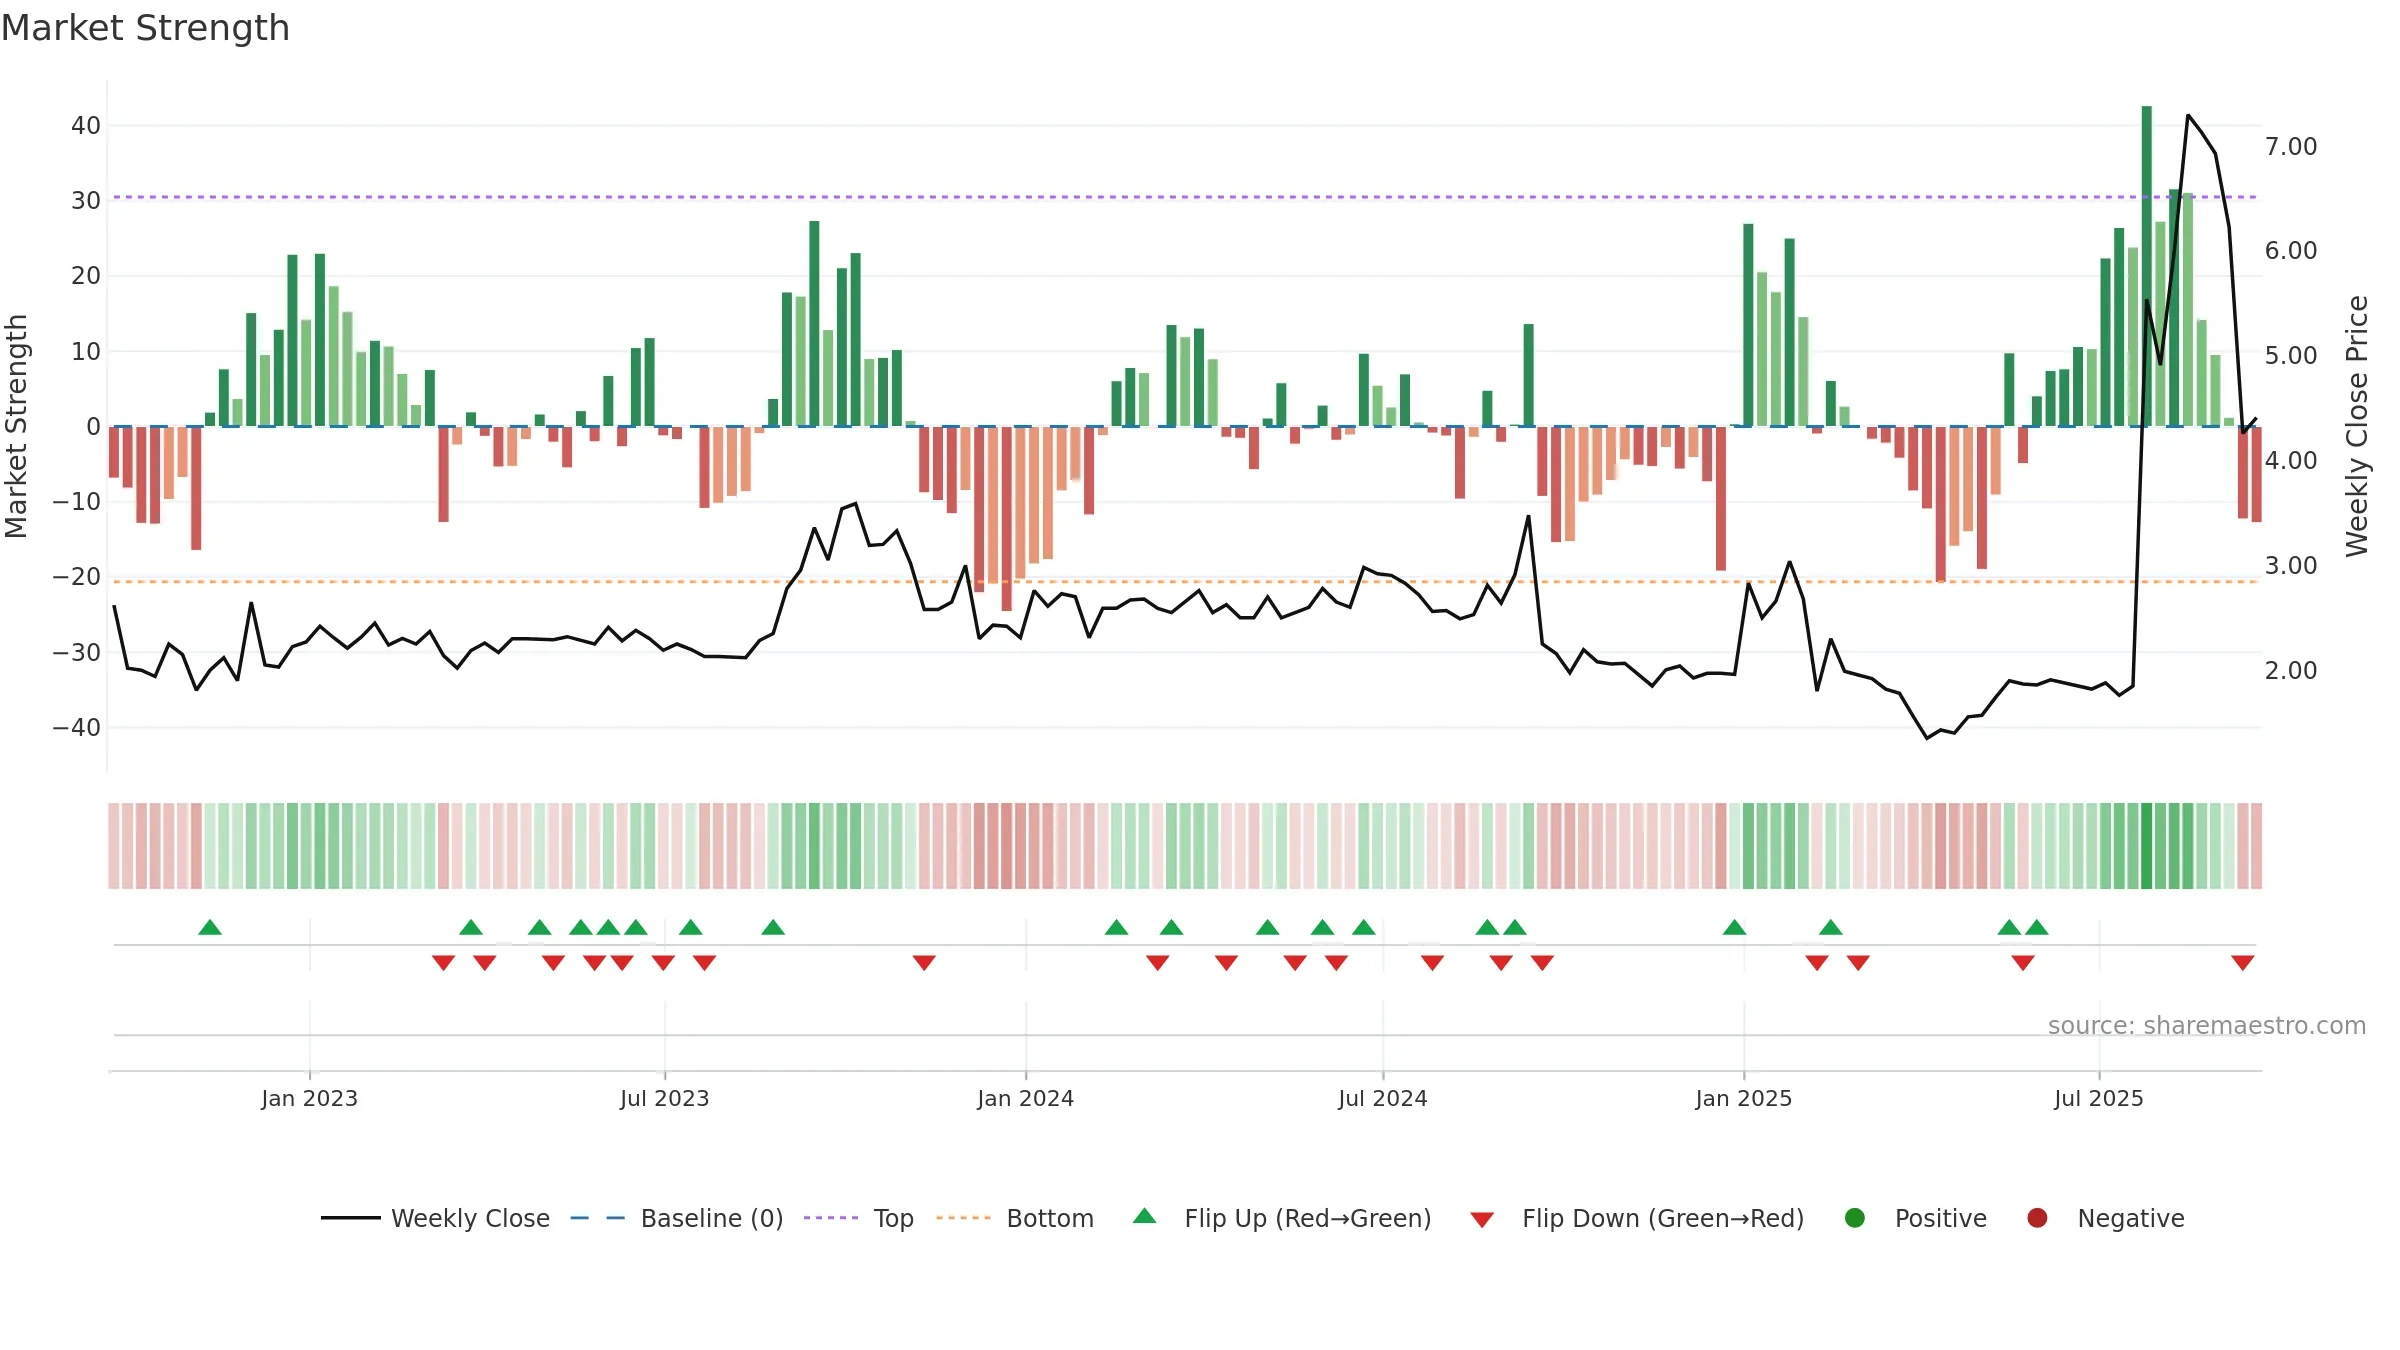
SUI Group Holdings Limited closed at 4.4100 (-3.50% WoW) . Data window ends Fri, 19 Sep 2025.
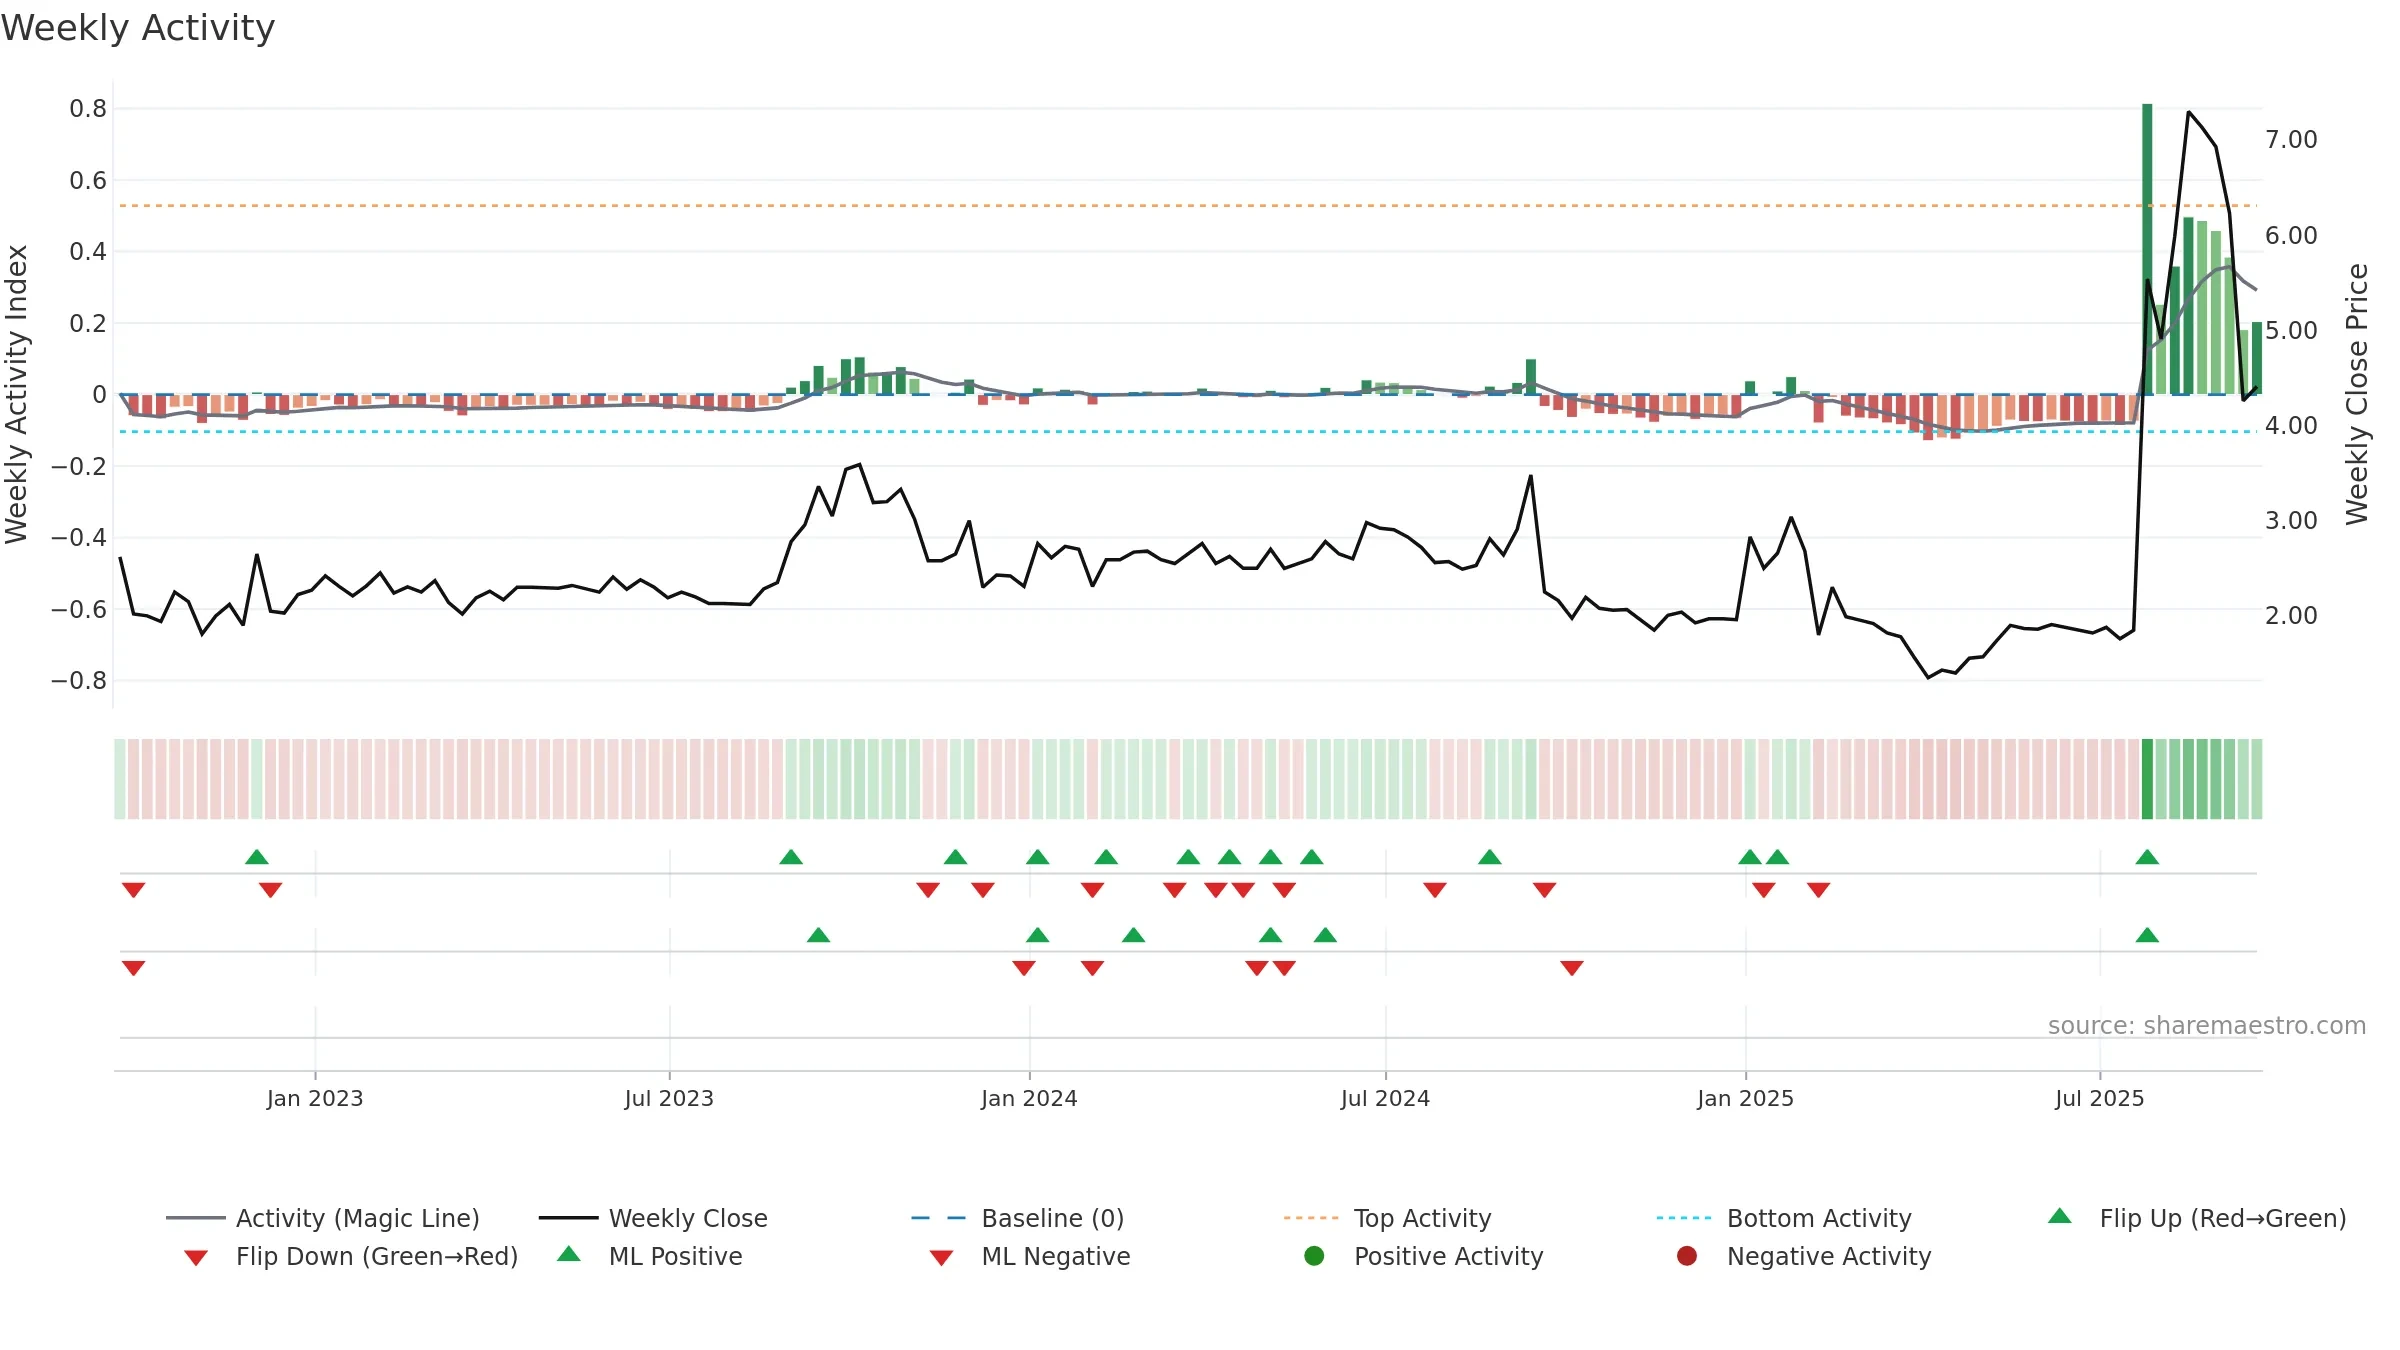
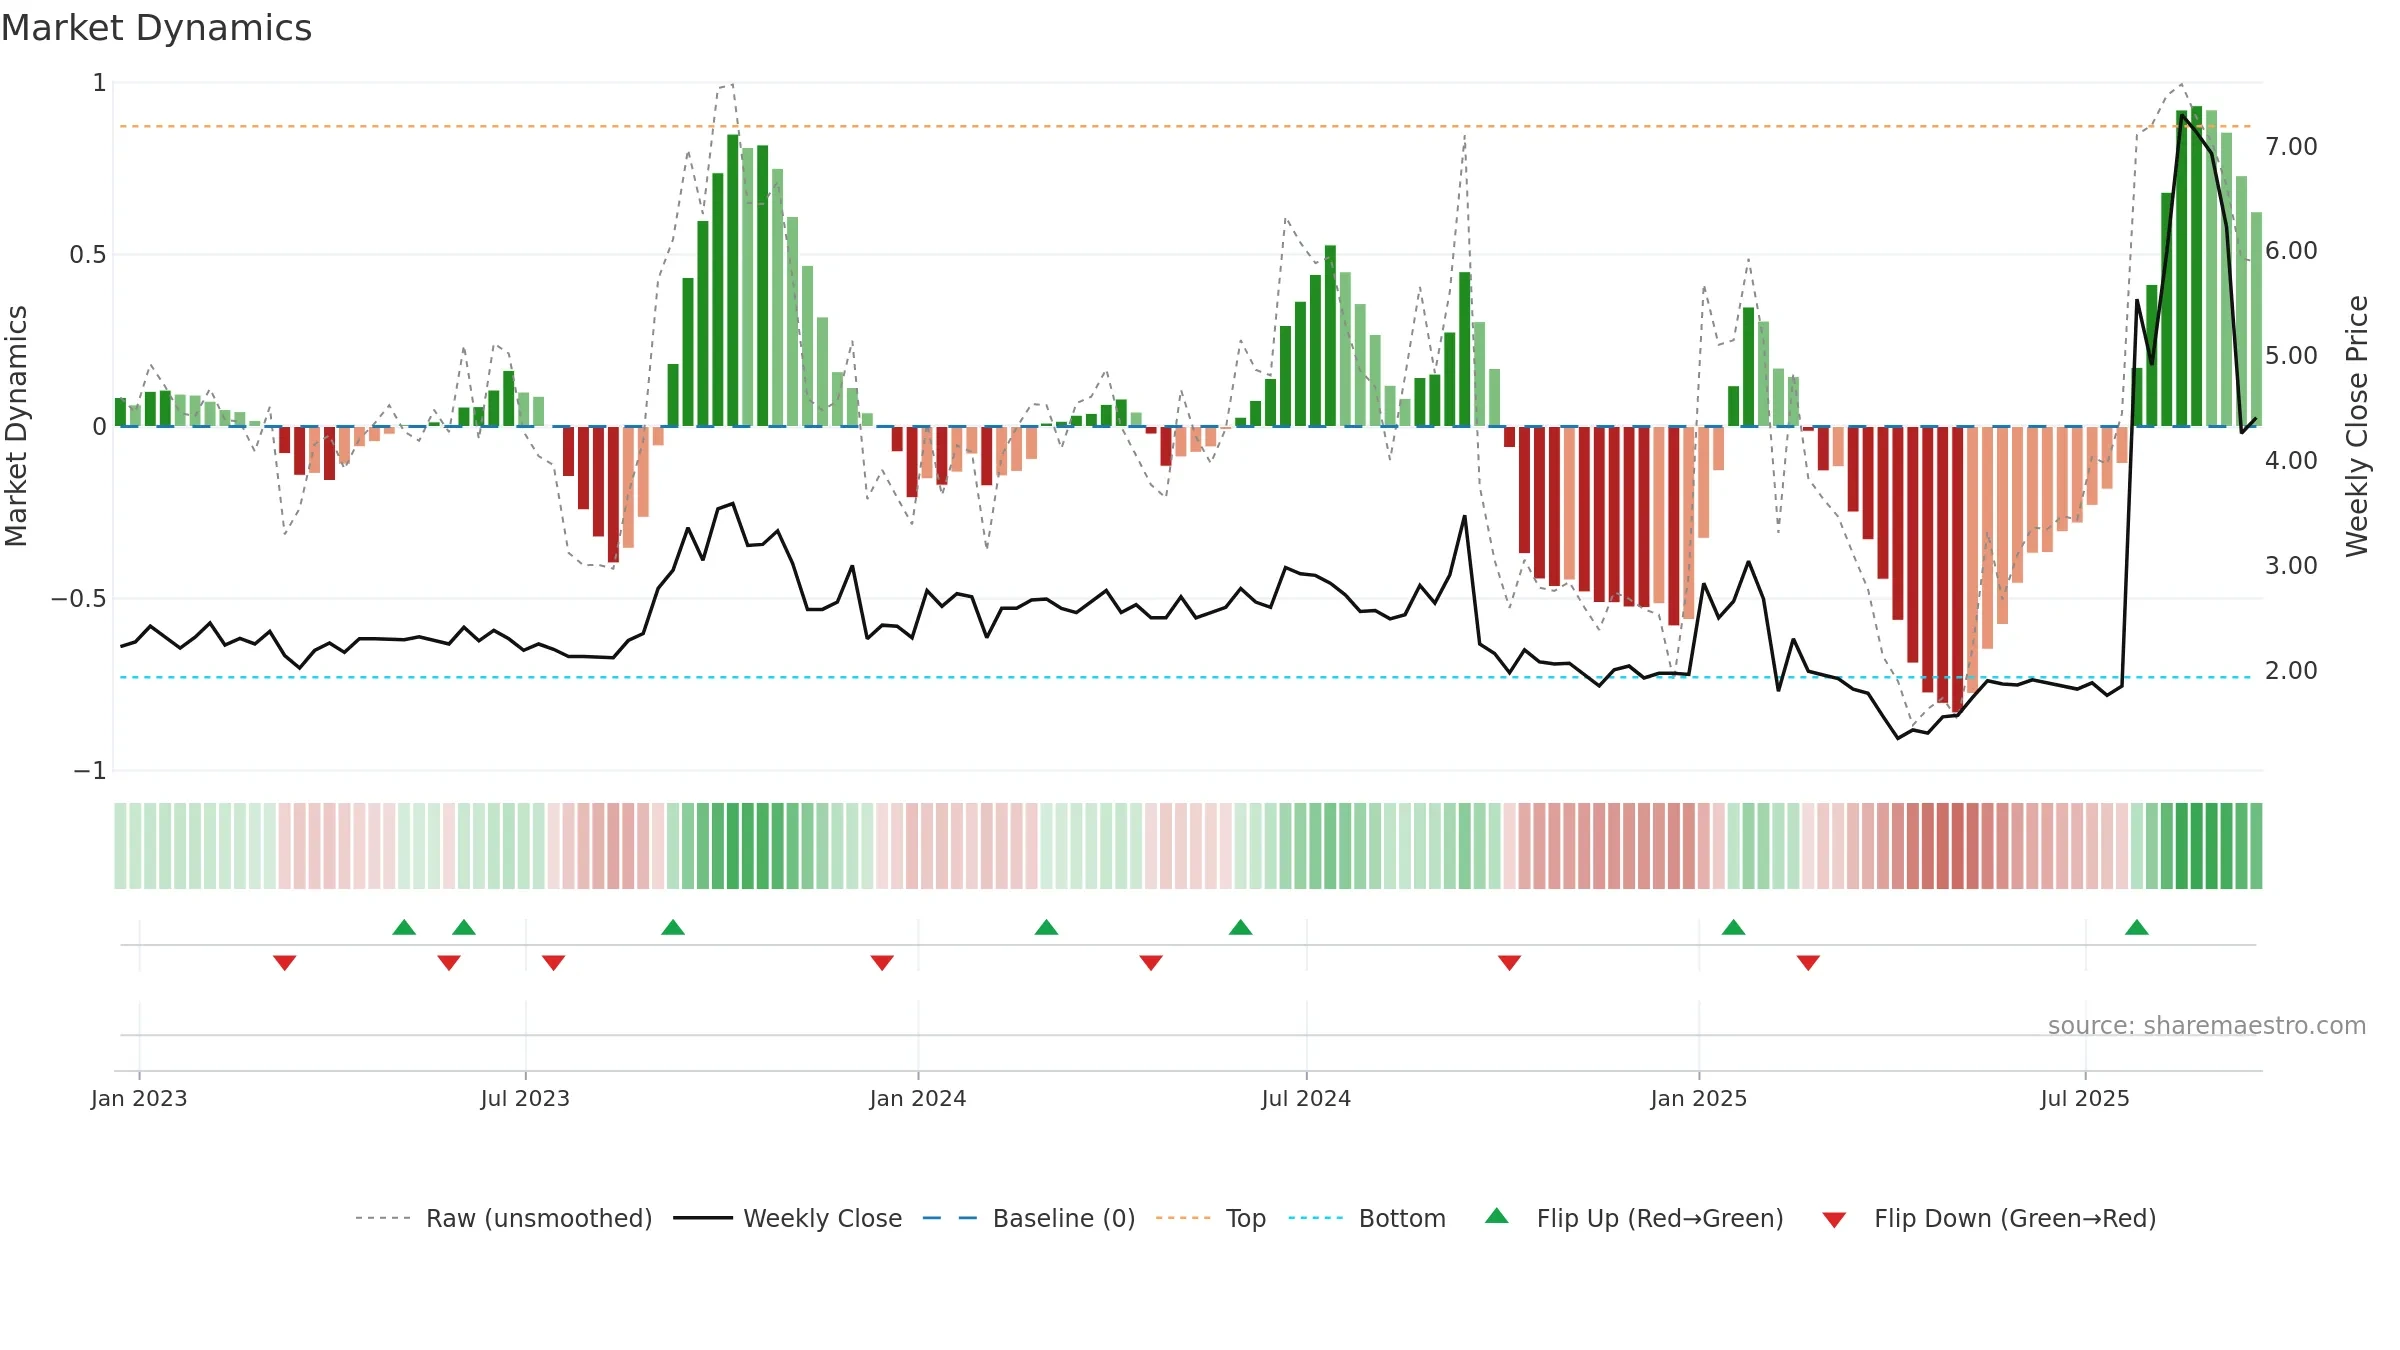
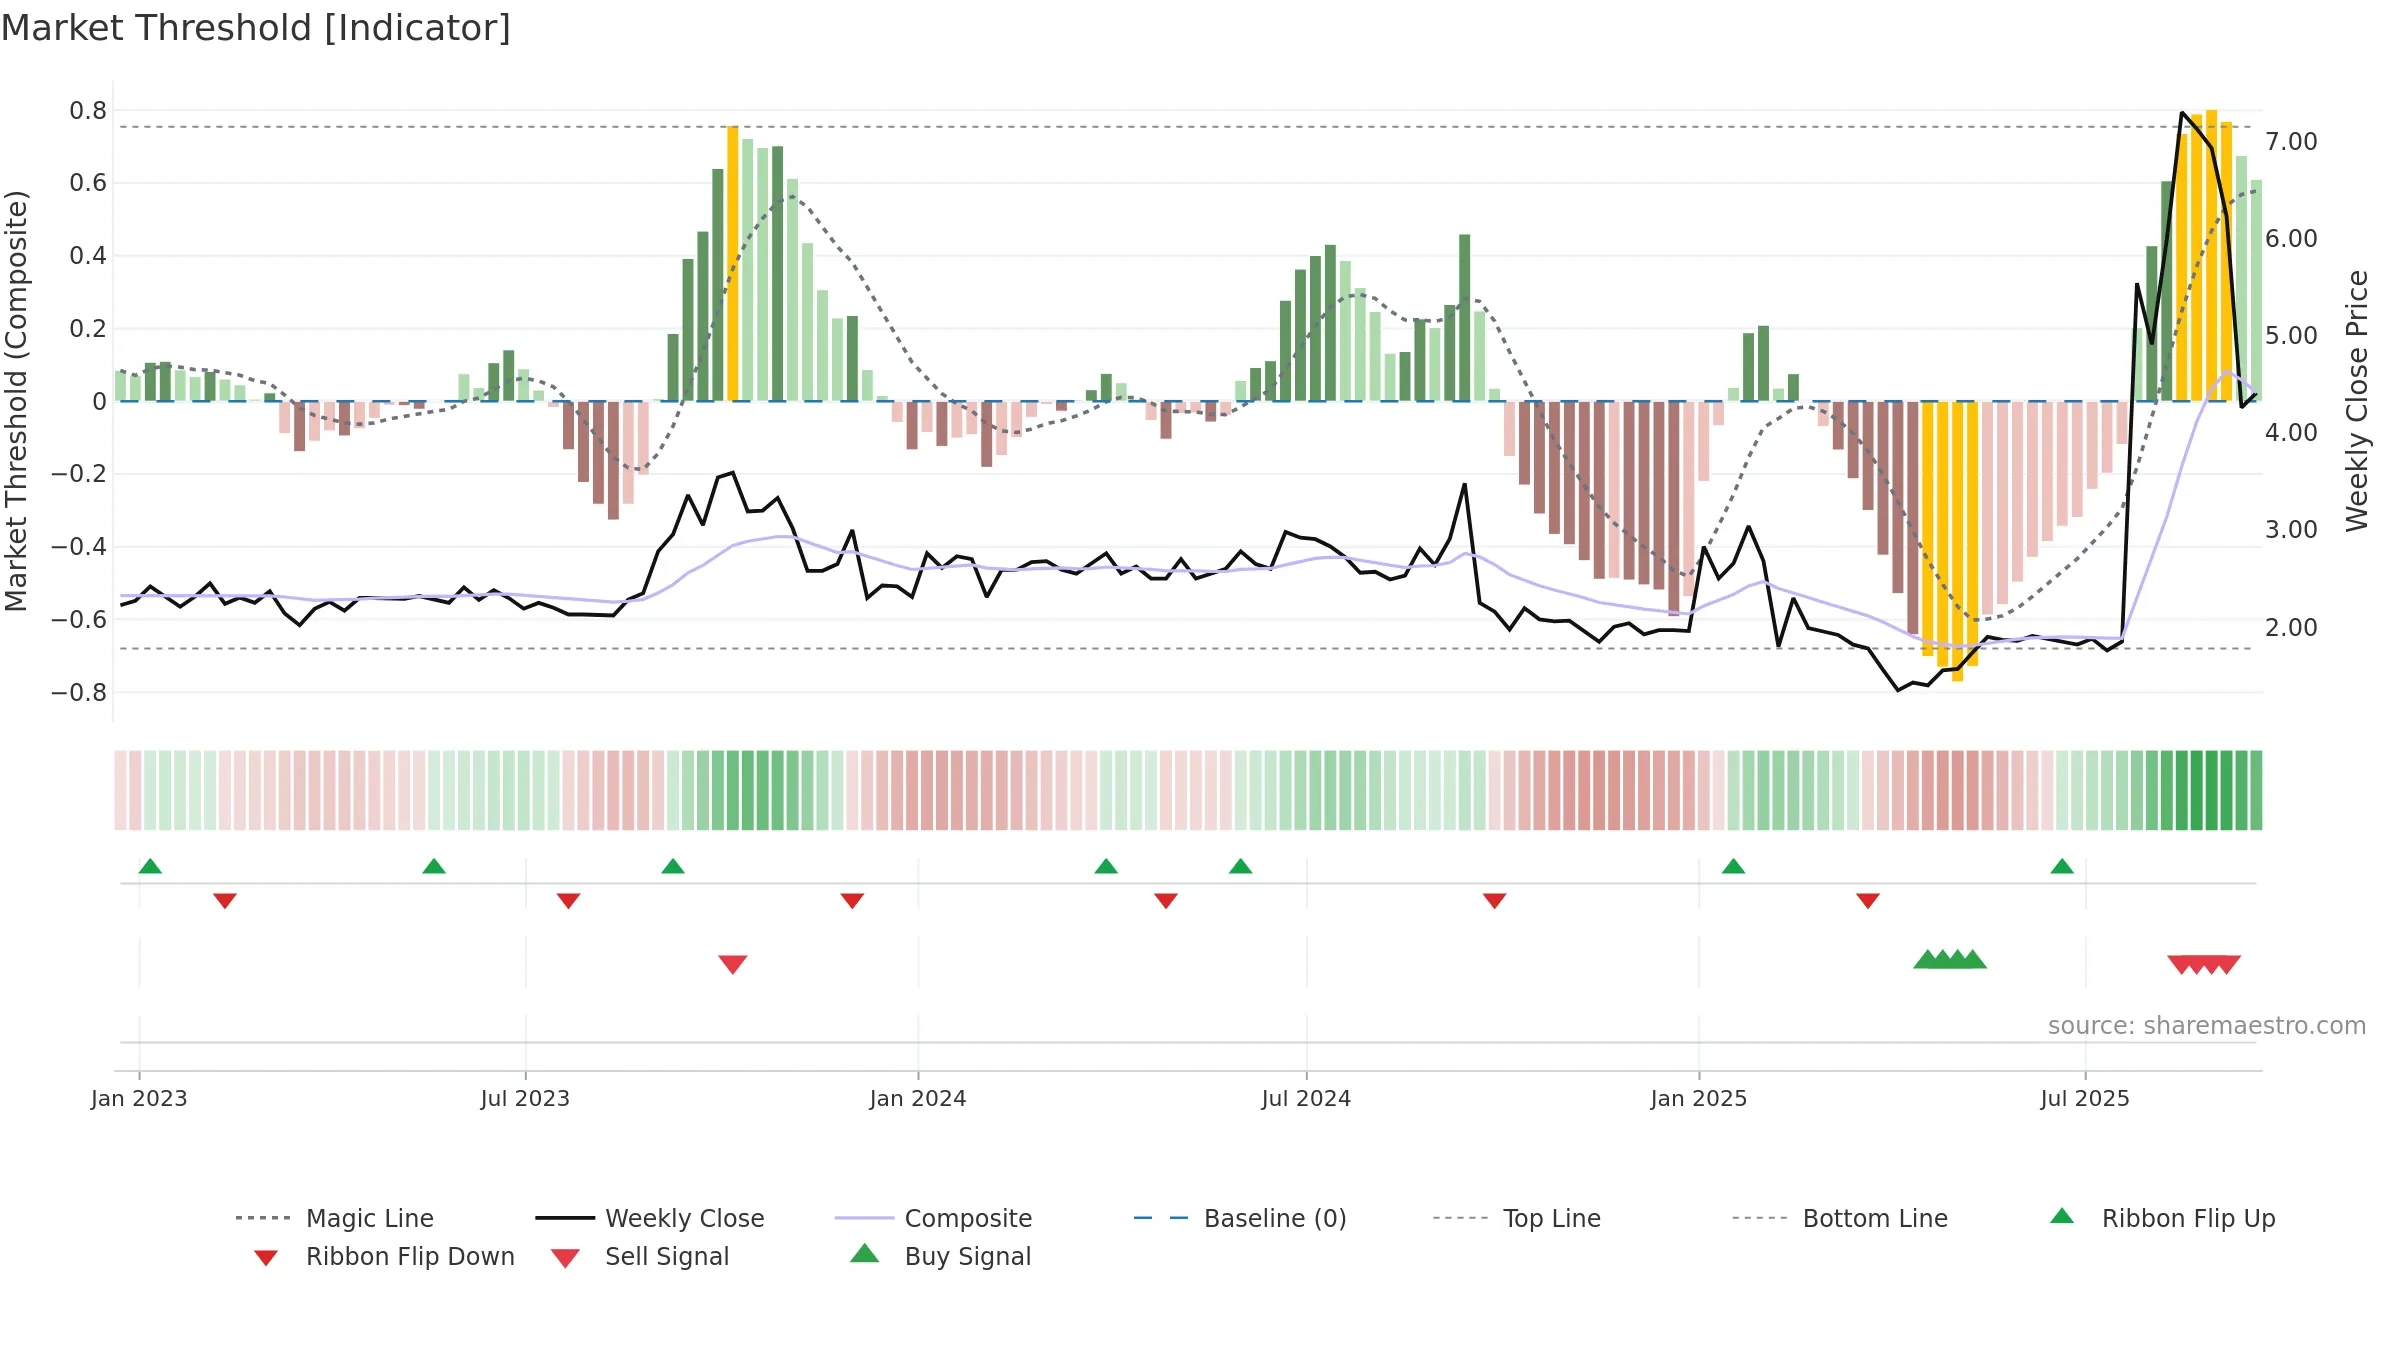
How to read this — Price slope is downward, indicating persistent supply pressure. Elevated weekly volatility increases whipsaw risk. Volume trend diverges from price — watch for fatigue or rotation. Fresh short-term downside crossover weakens near-term tone.
Down-slope argues for patience; rallies can fade sooner unless participation improves. Because liquidity isn’t confirming, prefer evidence of fresh demand before chasing moves.
Gauge maps the trend signal to a 0–100 scale.
How to read this — Range-bound conditions; conviction is limited until a break or acceleration emerges.
Wait for a directional break or improving acceleration.
Price is below fair value; potential upside if momentum constructive.
Conclusion
Negative setup. ★★☆☆☆ confidence. Price window: -10. Trend: Range / Neutral; gauge 82. In combination, liquidity diverges from price.
- Momentum is bullish and rising
- Price is not above key averages
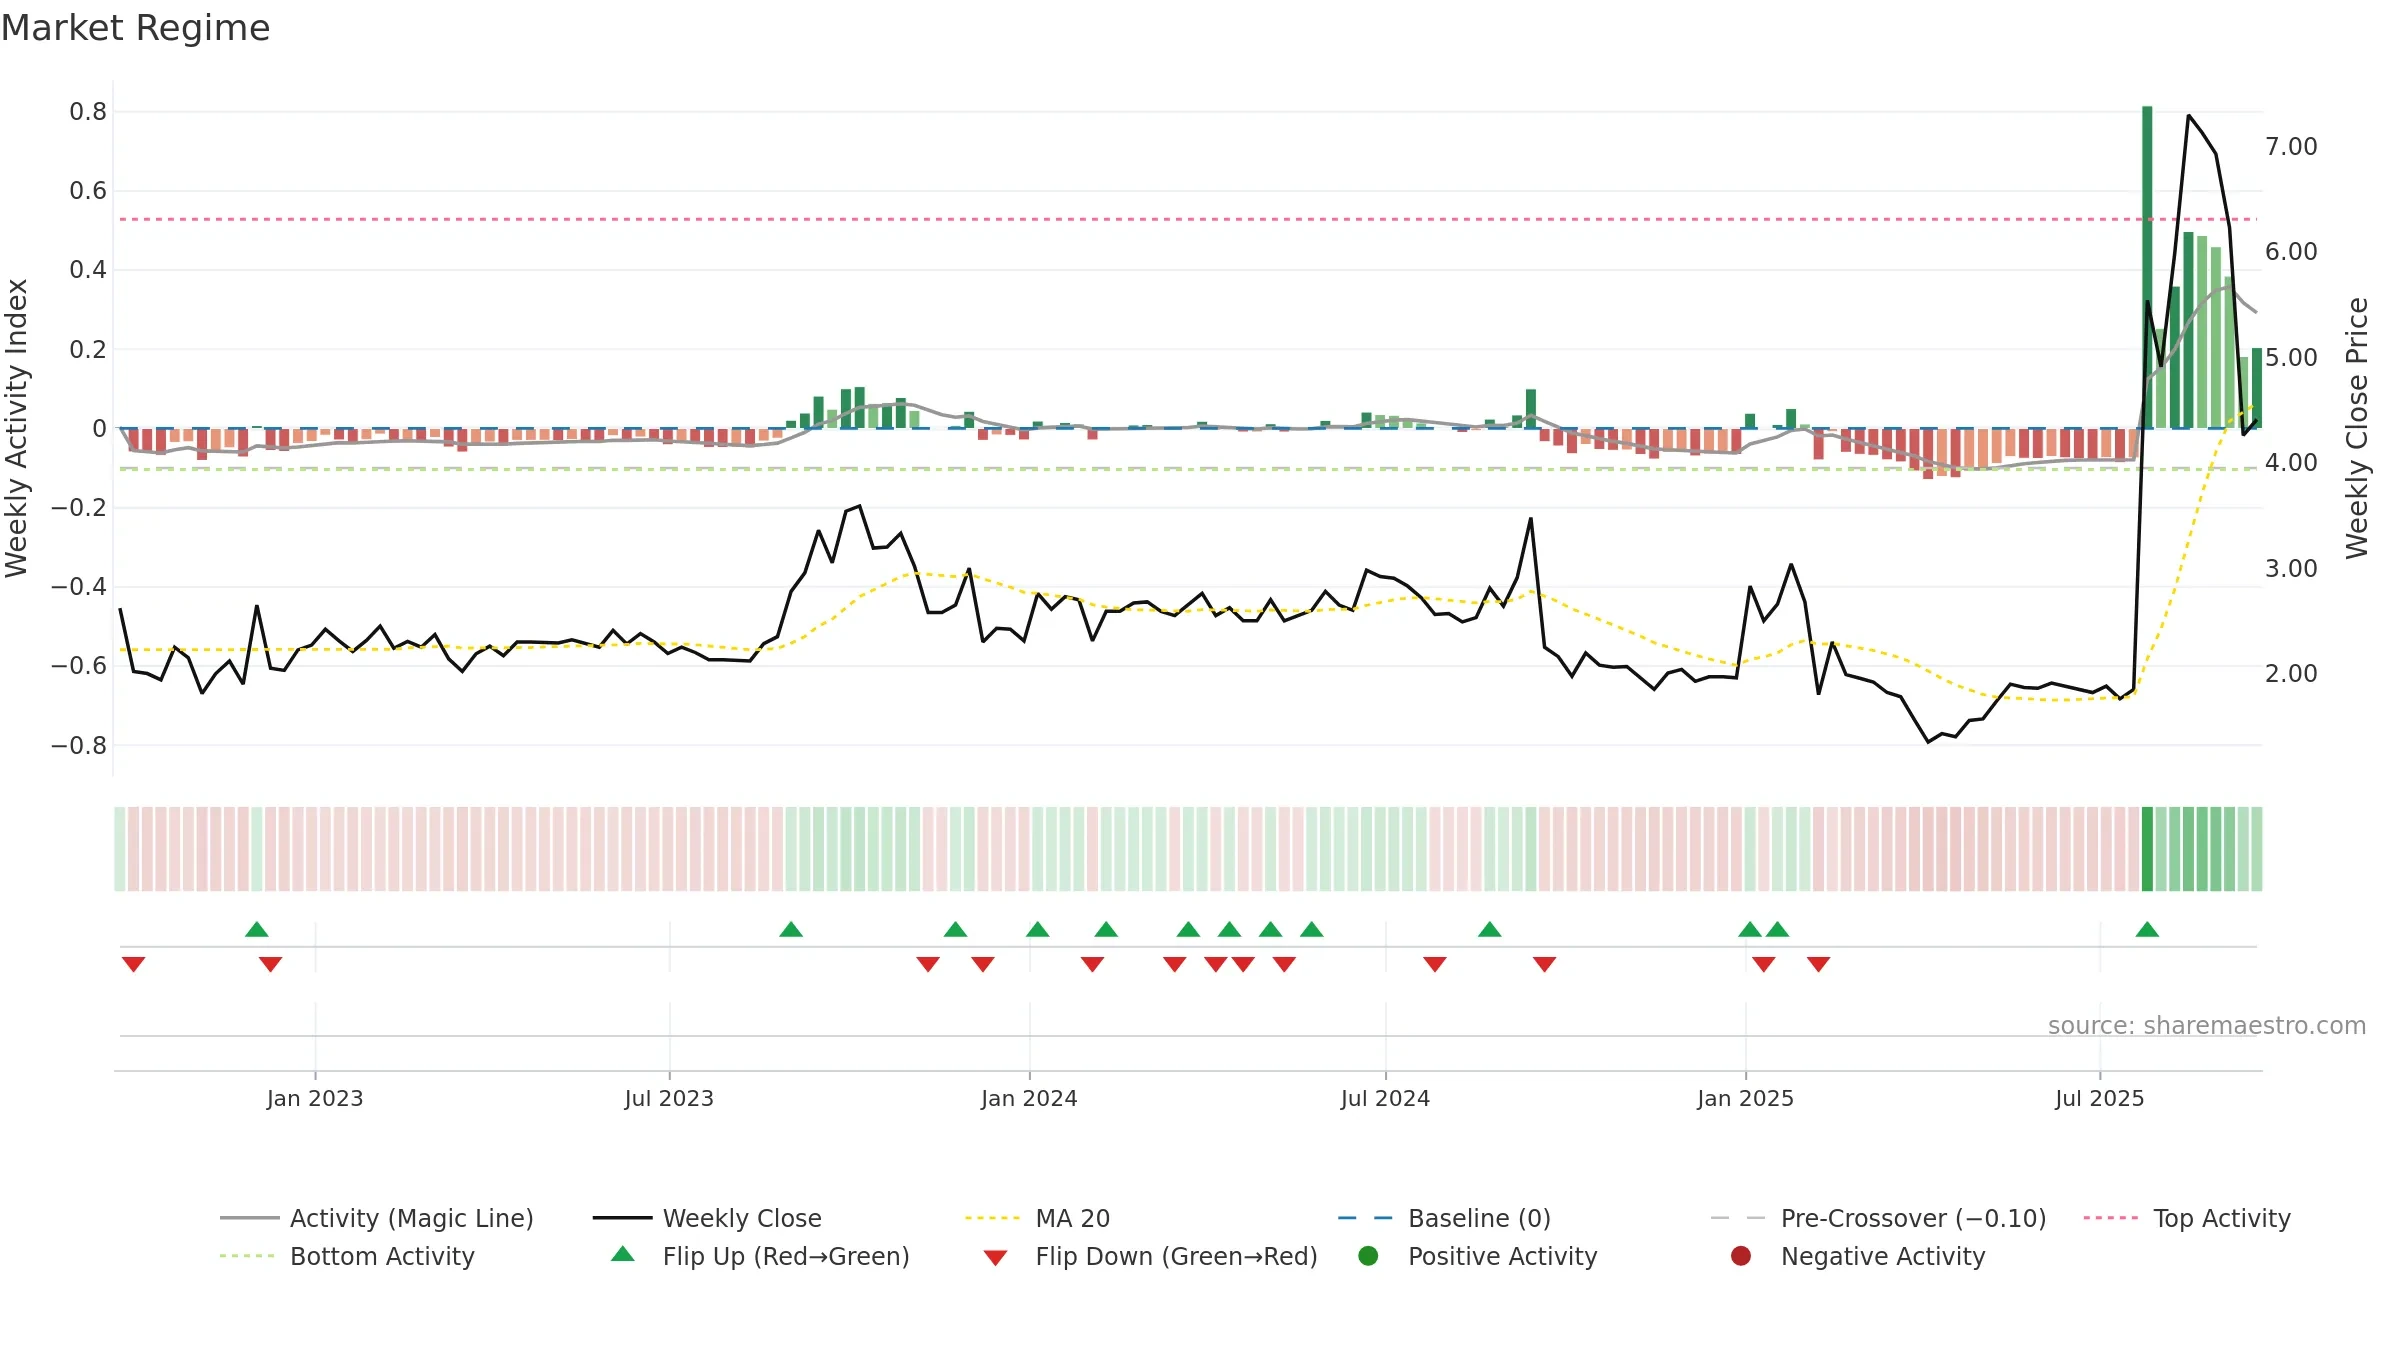
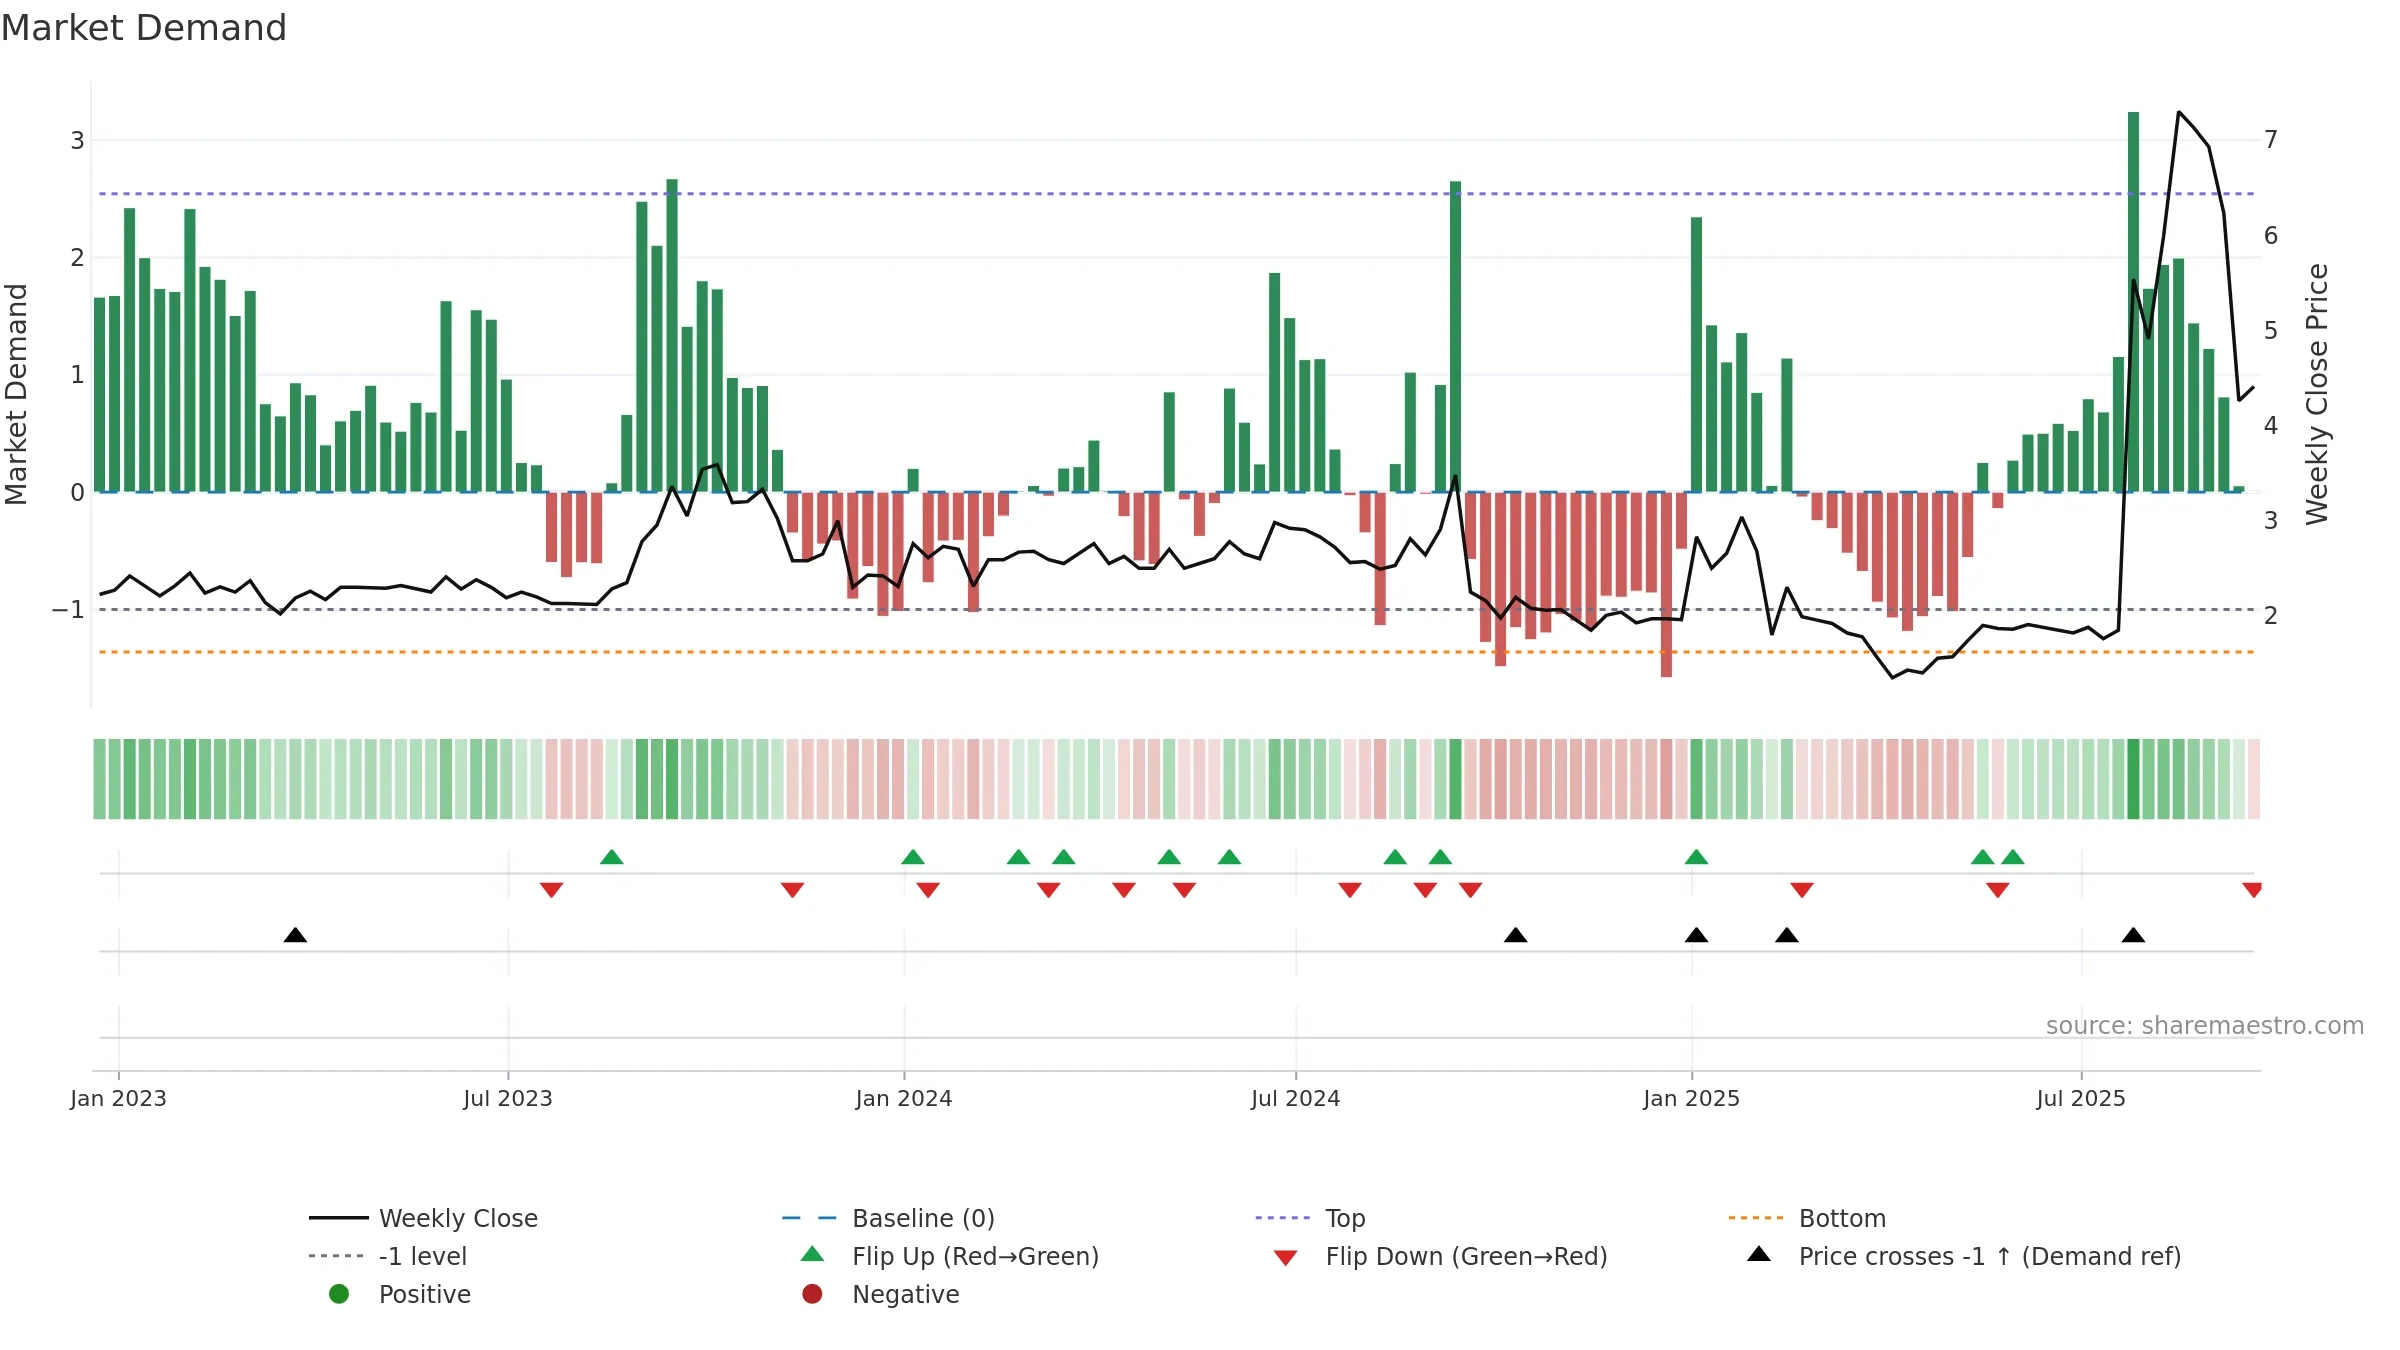
- Liquidity diverges from price
- High return volatility raises whipsaw risk
- Negative multi-week performance
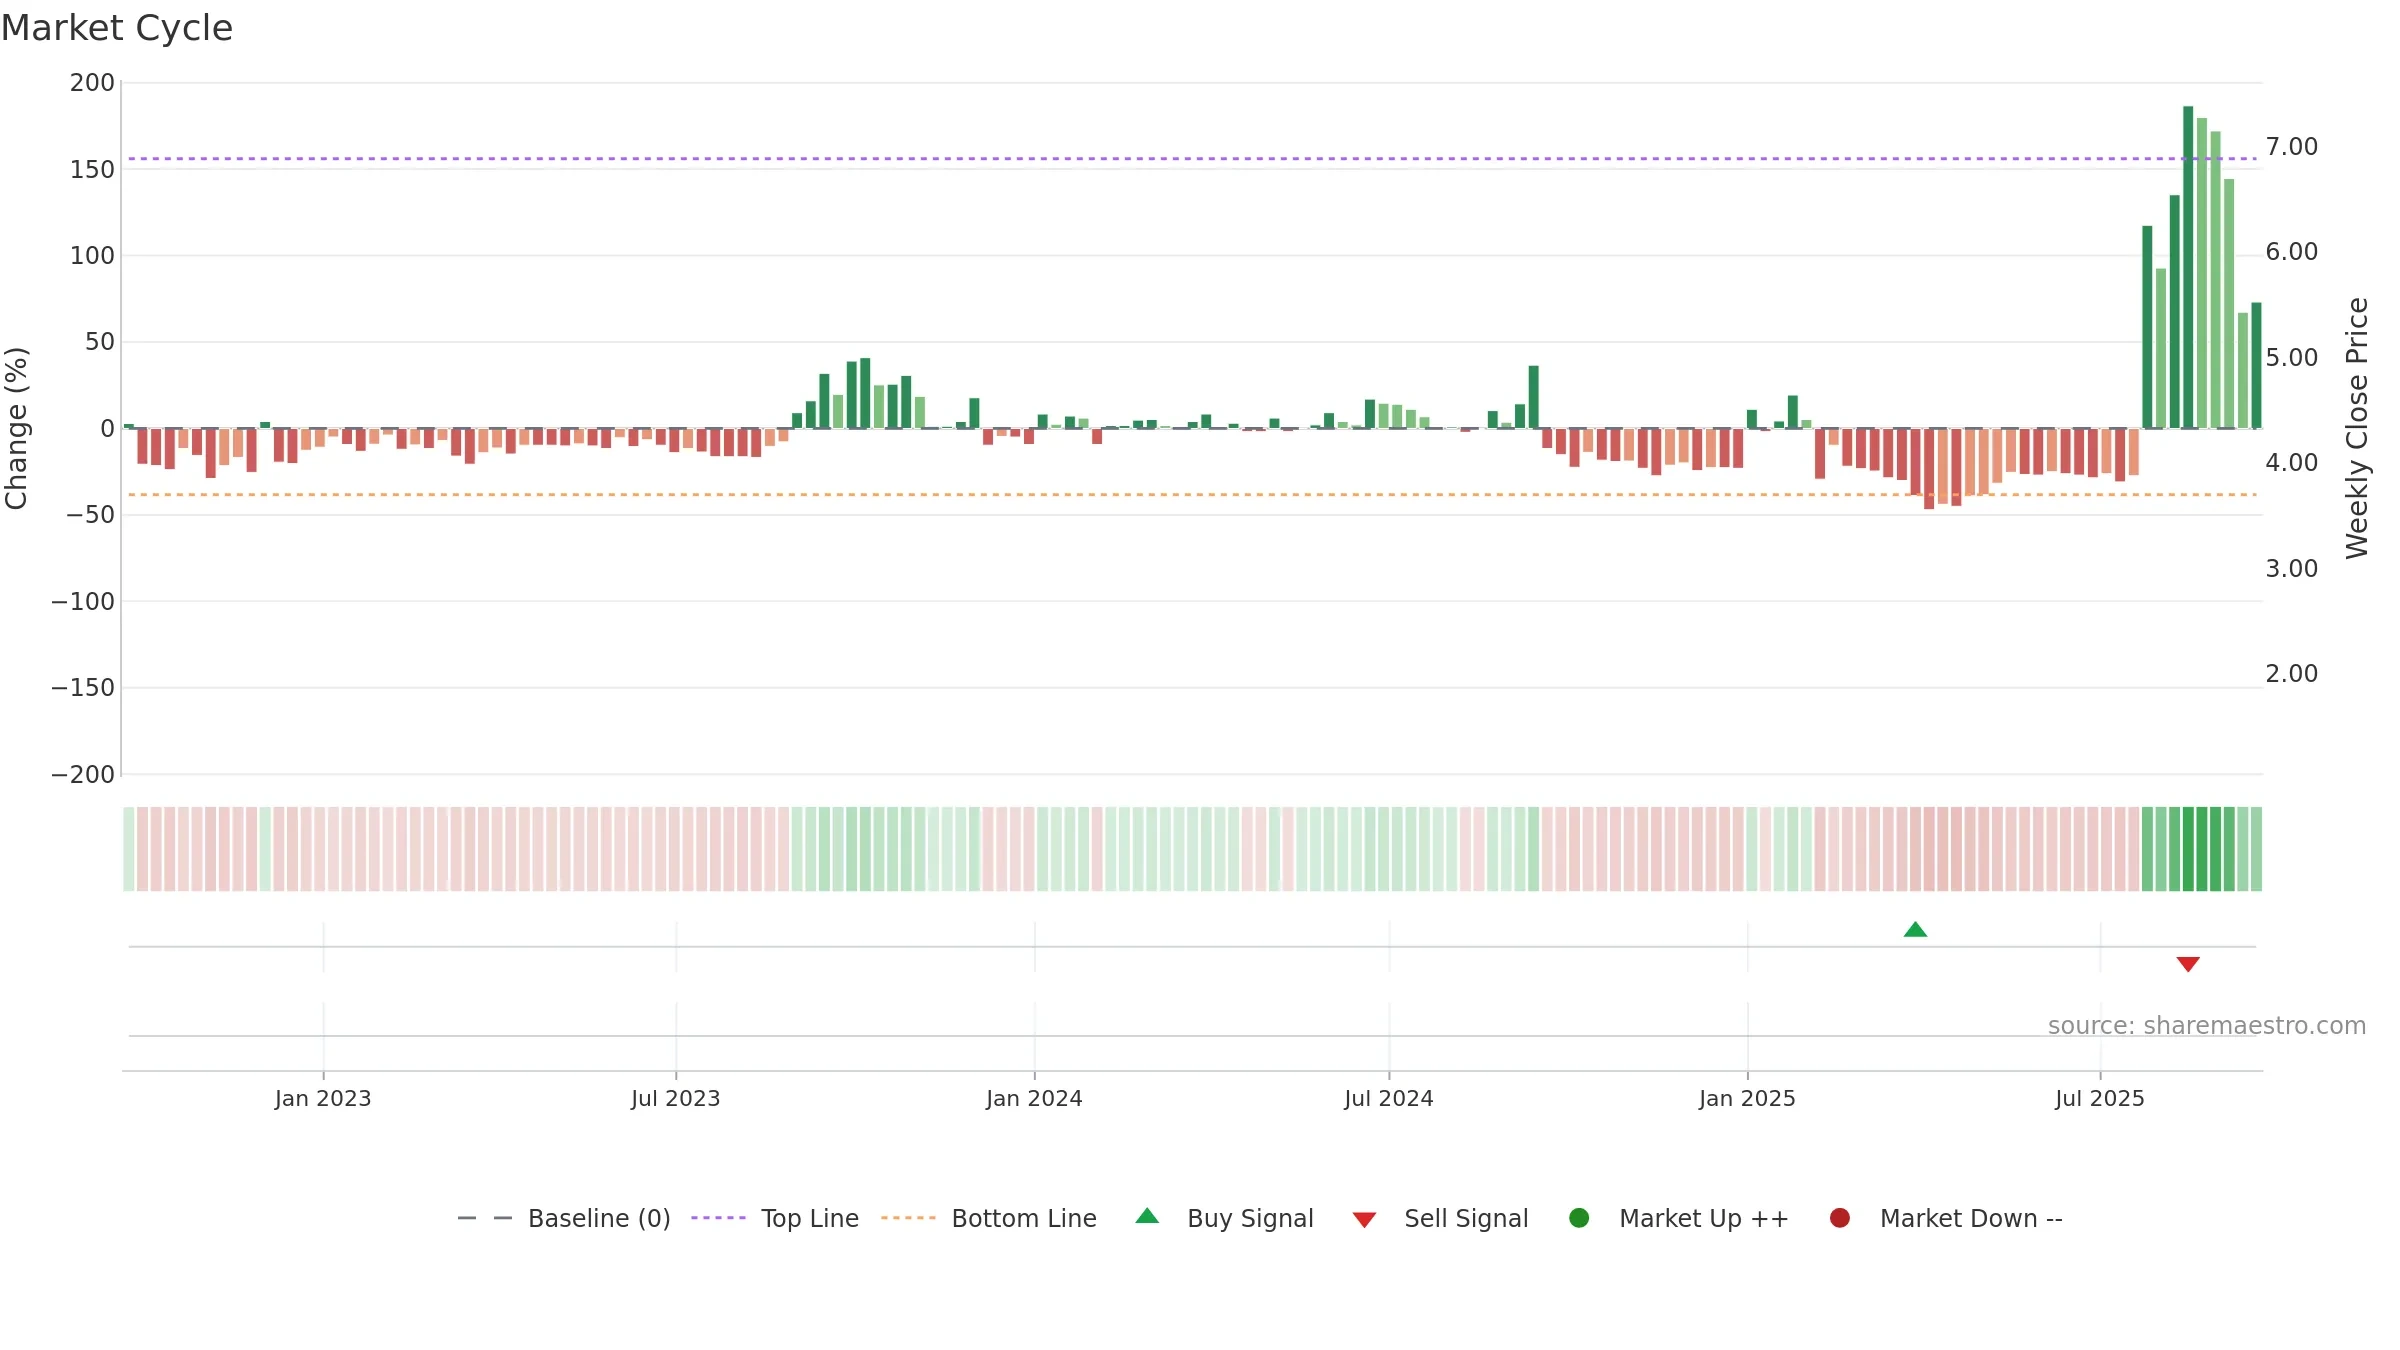
Why: Price window -10.18% over 8w. Close is -39.59% below the prior-window high. Return volatility 11.53%. Volume trend rising. Liquidity divergence with price. Trend state range / neutral. 4–8w crossover bearish. Momentum bullish and rising. Valuation supportive skew.
Tip: Most metrics include a hover tooltip where they appear in the report.