No results found.

ProShares Bitcoin ETF

BITO ETF-US
Week Ending
Mon, 15 Sep 2025
Open
19.8300
Close
19.8300
High
20.3300
Low
19.7000
Trend
0.78636
Sharemaestro [Charts]
BITO weekly Smart Money chart, closing 2025-09-15.
BITO weekly Market Snapshot chart, closing 2025-09-15.
BITO weekly Market Cycle chart, closing 2025-09-15.
BITO weekly Market Demand chart, closing 2025-09-15.
BITO weekly Market Strength chart, closing 2025-09-15.
BITO weekly Market Dynamics chart, closing 2025-09-15.
BITO weekly Market Threshold chart, closing 2025-09-15.

Weekly Report

ProShares Bitcoin ETF (BITO) Week Ending: Mon, 15 Sep 2025 ★★☆☆☆
Price
Weekly Close

ProShares Bitcoin ETF closed at 19.8300 (0.00% WoW) . Data window ends Mon, 15 Sep 2025.

Price Window2.25% over 8w
Return Volatility4.07%
Volume TrendRising
Vs 8-week High-8.07%
Accumulation Weeks1
Distribution Weeks1
MA StackMixed
4–8 CrossoverNone
Price vs MAsMixed
Baseline Deviation0.85% (narrowing)
Interpretation

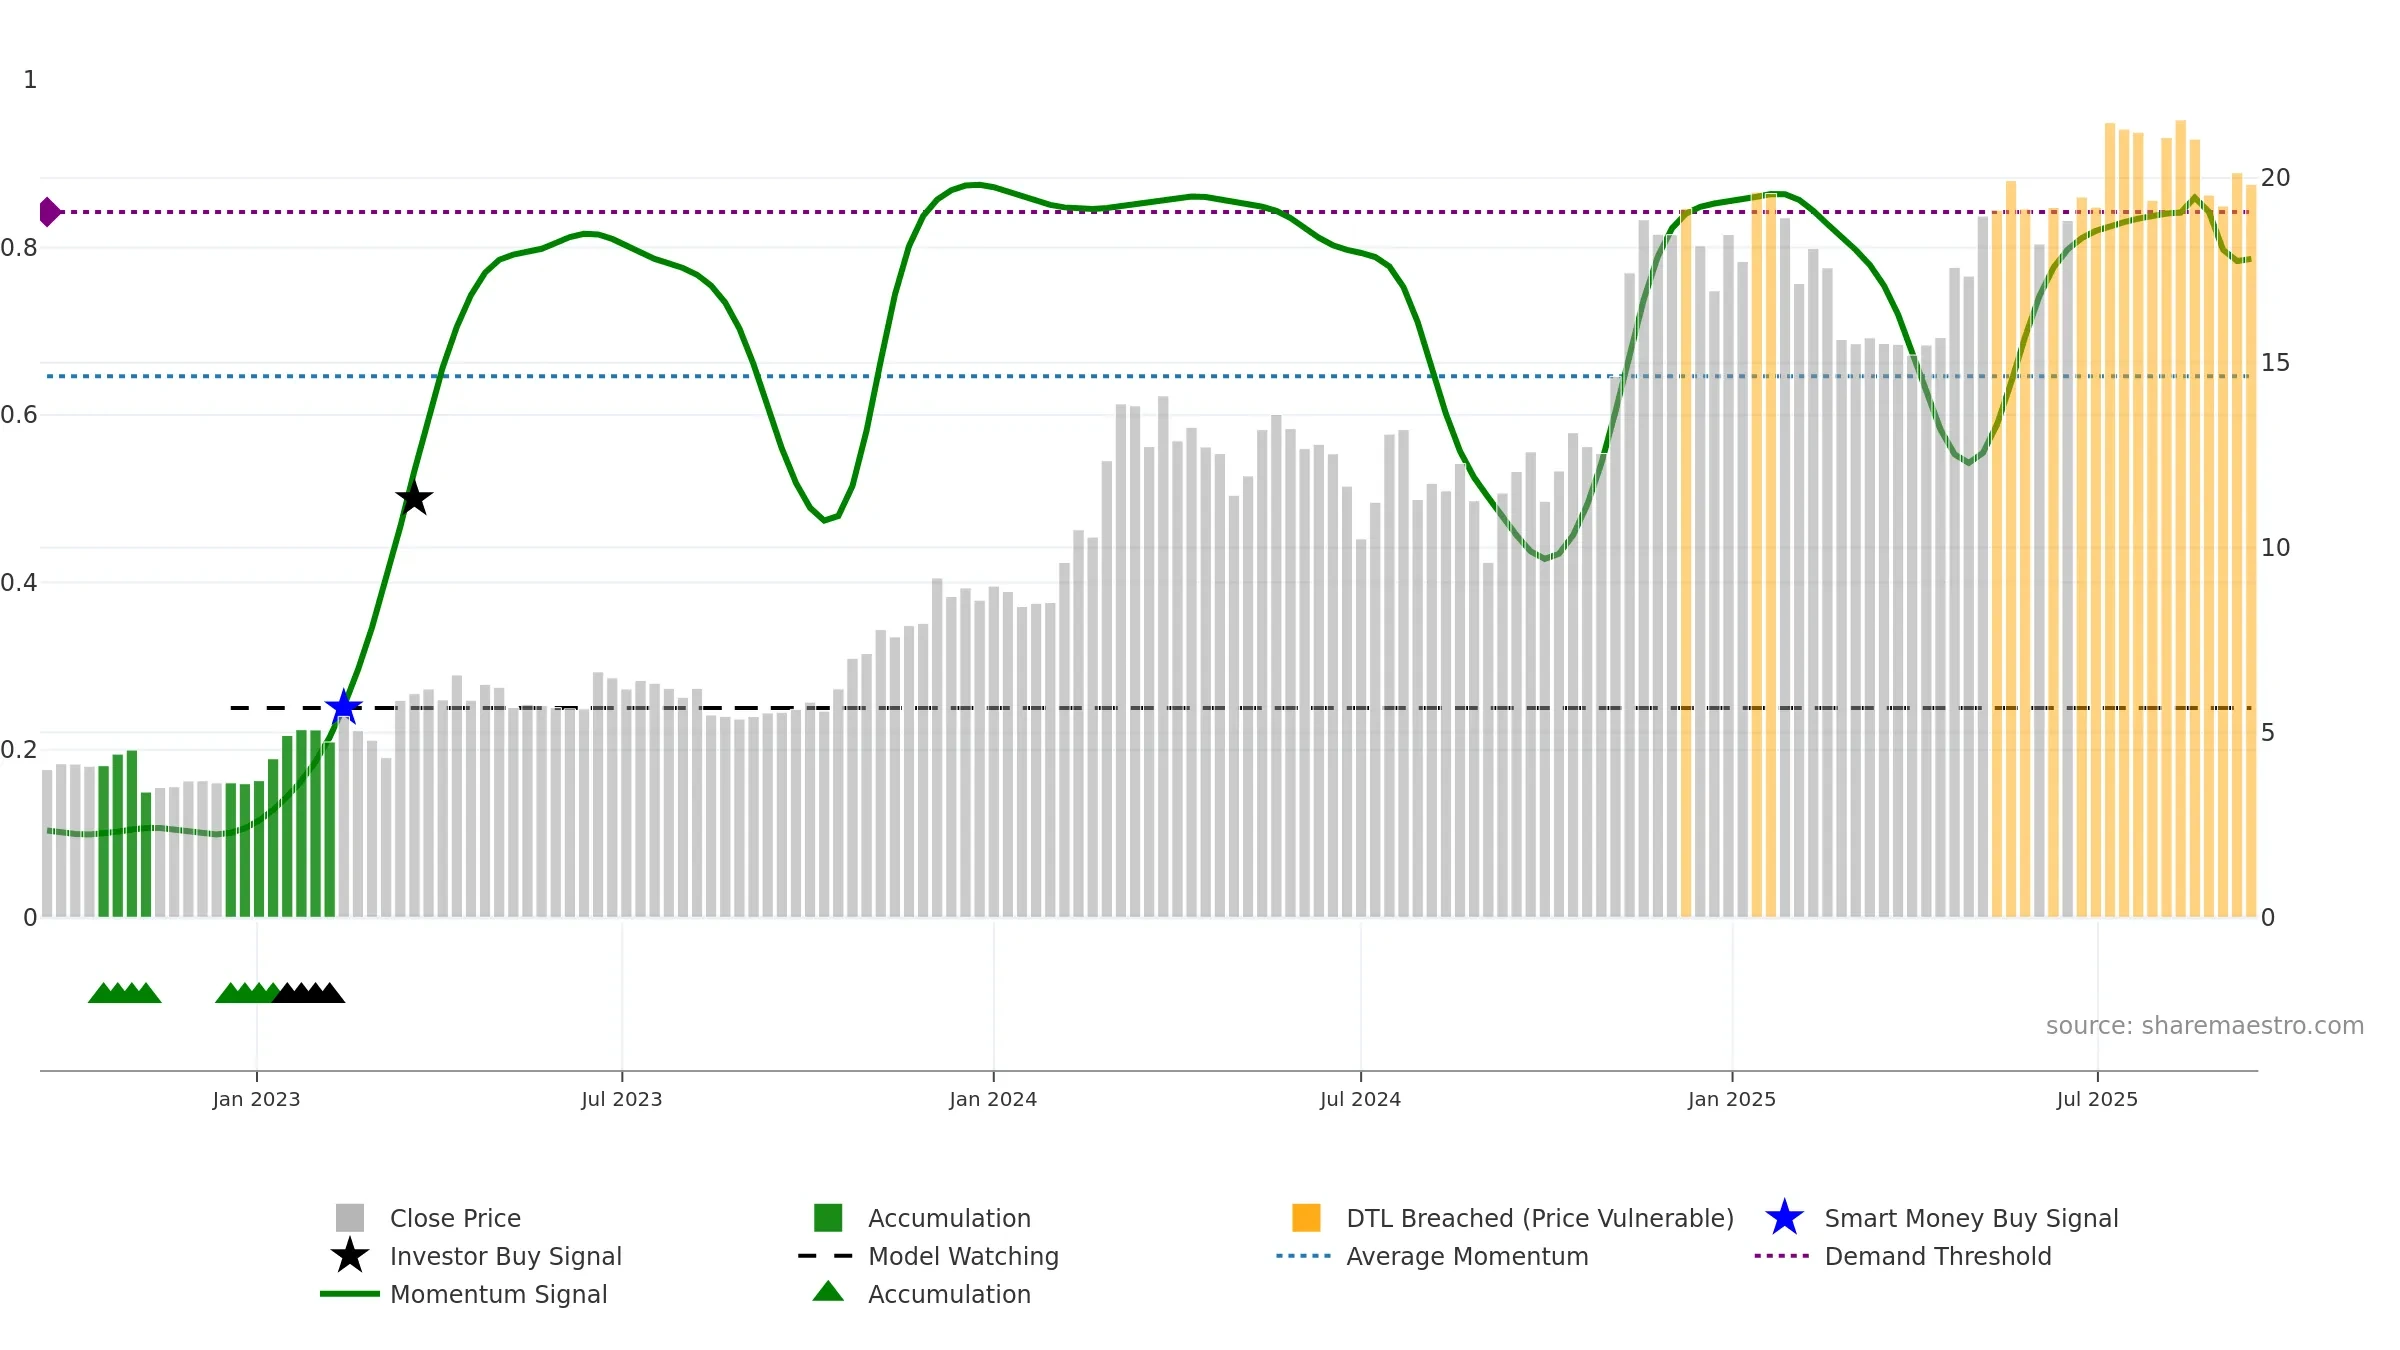
How to read this — Price slope is downward, indicating persistent supply pressure. Elevated weekly volatility increases whipsaw risk. Volume trend diverges from price — watch for fatigue or rotation. Accumulation weeks: 1; distribution weeks: 1. Price-level slope and return-drift differ — moves have been uneven week to week. Distance to baseline is narrowing — reverting closer to its fair-value track.

What this means for you

Down-slope argues for patience; rallies can fade sooner unless participation improves. Because liquidity isn’t confirming, prefer evidence of fresh demand before chasing moves.

Trend
Sharemaestro Trend Line

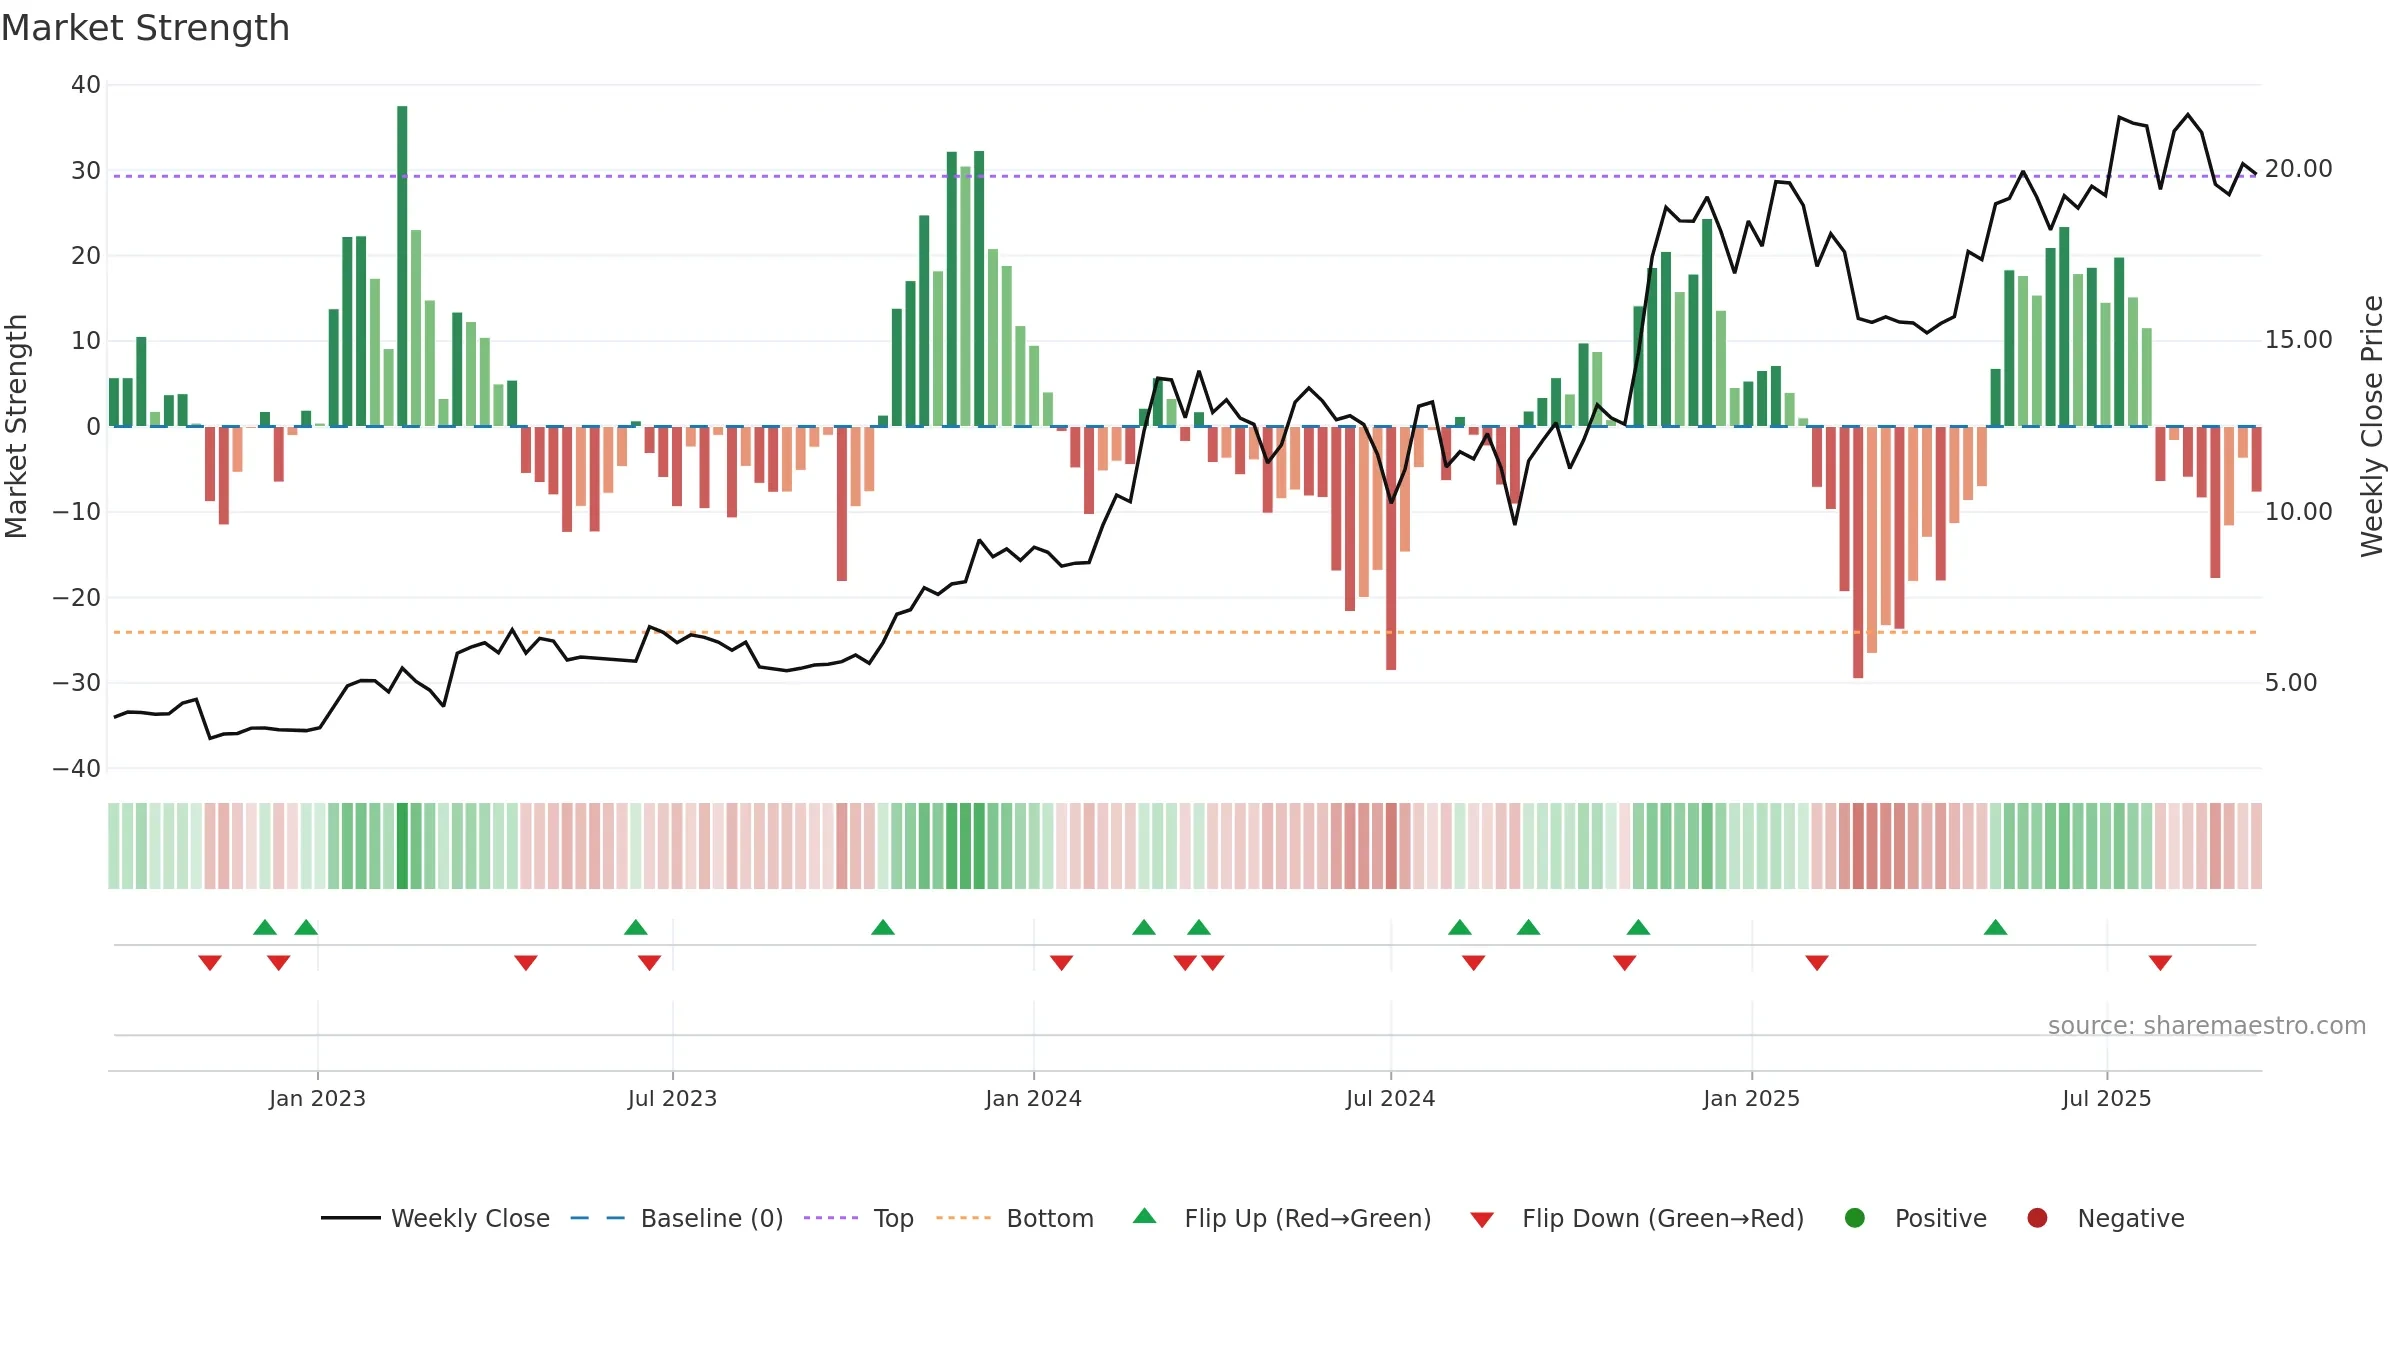
Gauge maps the trend signal to a 0–100 scale.

Gauge Reading89.3/100
DirectionFalling
Accelerationdecelerating
Gauge VolatilityLow
Zone LabelBullish
Bullish Weeks8
Neutral Weeks0
Bearish Weeks0
Interpretation

How to read this — Bullish gauge levels imply persistent upside pressure. A falling gauge warns of momentum fatigue. Deceleration reduces the odds of persistence.

What this means for you

Constructive backdrop; dips are more likely to find support while the gauge stays high.

Conclusion

Negative ★★☆☆☆

Negative setup. ★★☆☆☆ confidence. Price window: 2. Trend: Bullish @ 89. In combination, liquidity diverges from price.

Why: Price window 2.25% over 8w. Close is -8.07% below the window high. Return volatility 4.07%. Volume trend rising. Liquidity divergence with price. Accumulation 1; distribution 1. MA stack mixed. Baseline deviation 0.85% (narrowing). Momentum bullish and falling. Acceleration decelerating. Gauge volatility low.

Price Window Endpoint return over the last N weeks using weekly closes: (Closelast − Closefirst)/Closefirst × 100.
Return Volatility Std-dev of weekly returns (%). Higher = choppier.
Volume Trend Slope of weekly volume across the window (rising / falling / flat).
Vs N-week High % distance of latest close from the highest close in the window.
Accumulation Weeks Weeks price rose on higher volume than the prior week.
Distribution Weeks Weeks price fell on higher volume than the prior week.
MA Stack Relative order of short / intermediate / long MAs. Short > long is constructive.
4–8 Crossover Latest cross of 4-week vs 8-week MA (bullish / bearish / none).
Price vs MAs Whether the close is above/below key averages (8w & 26w).
Baseline Deviation % distance from the market-cycle baseline (fair-value track).
Gauge Reading Smoothed trend signal mapped to 0–100.
Direction Slope sign of the gauge across the window (rising / falling).
Acceleration Change in the slope of the gauge (accelerating / decelerating).
Gauge Volatility Variability of the gauge (low / normal / high).
Zone Label Classification by level (Bullish / Neutral / Bearish).
Target Price (Flag) If flagged: Positive/Negative stance. Otherwise: numeric fair value.
Composite Score Overall model score (0–10).
Hybrid Efficiency Efficiency of growth × quality (0–10).
Rating Model’s verdict for the snapshot.
Weekly Close Sparkline of the last 52 weekly closing prices.
Trend Line Sparkline of the smoothed trend signal over the last 52 weeks.

Tip: Most metrics also include a hover tooltip where they appear in the report.

Download JSON Download CSV JSON-LD Snapshots: 2025-09-15