Gilat Satellite Networks Ltd.
GILT NASDAQ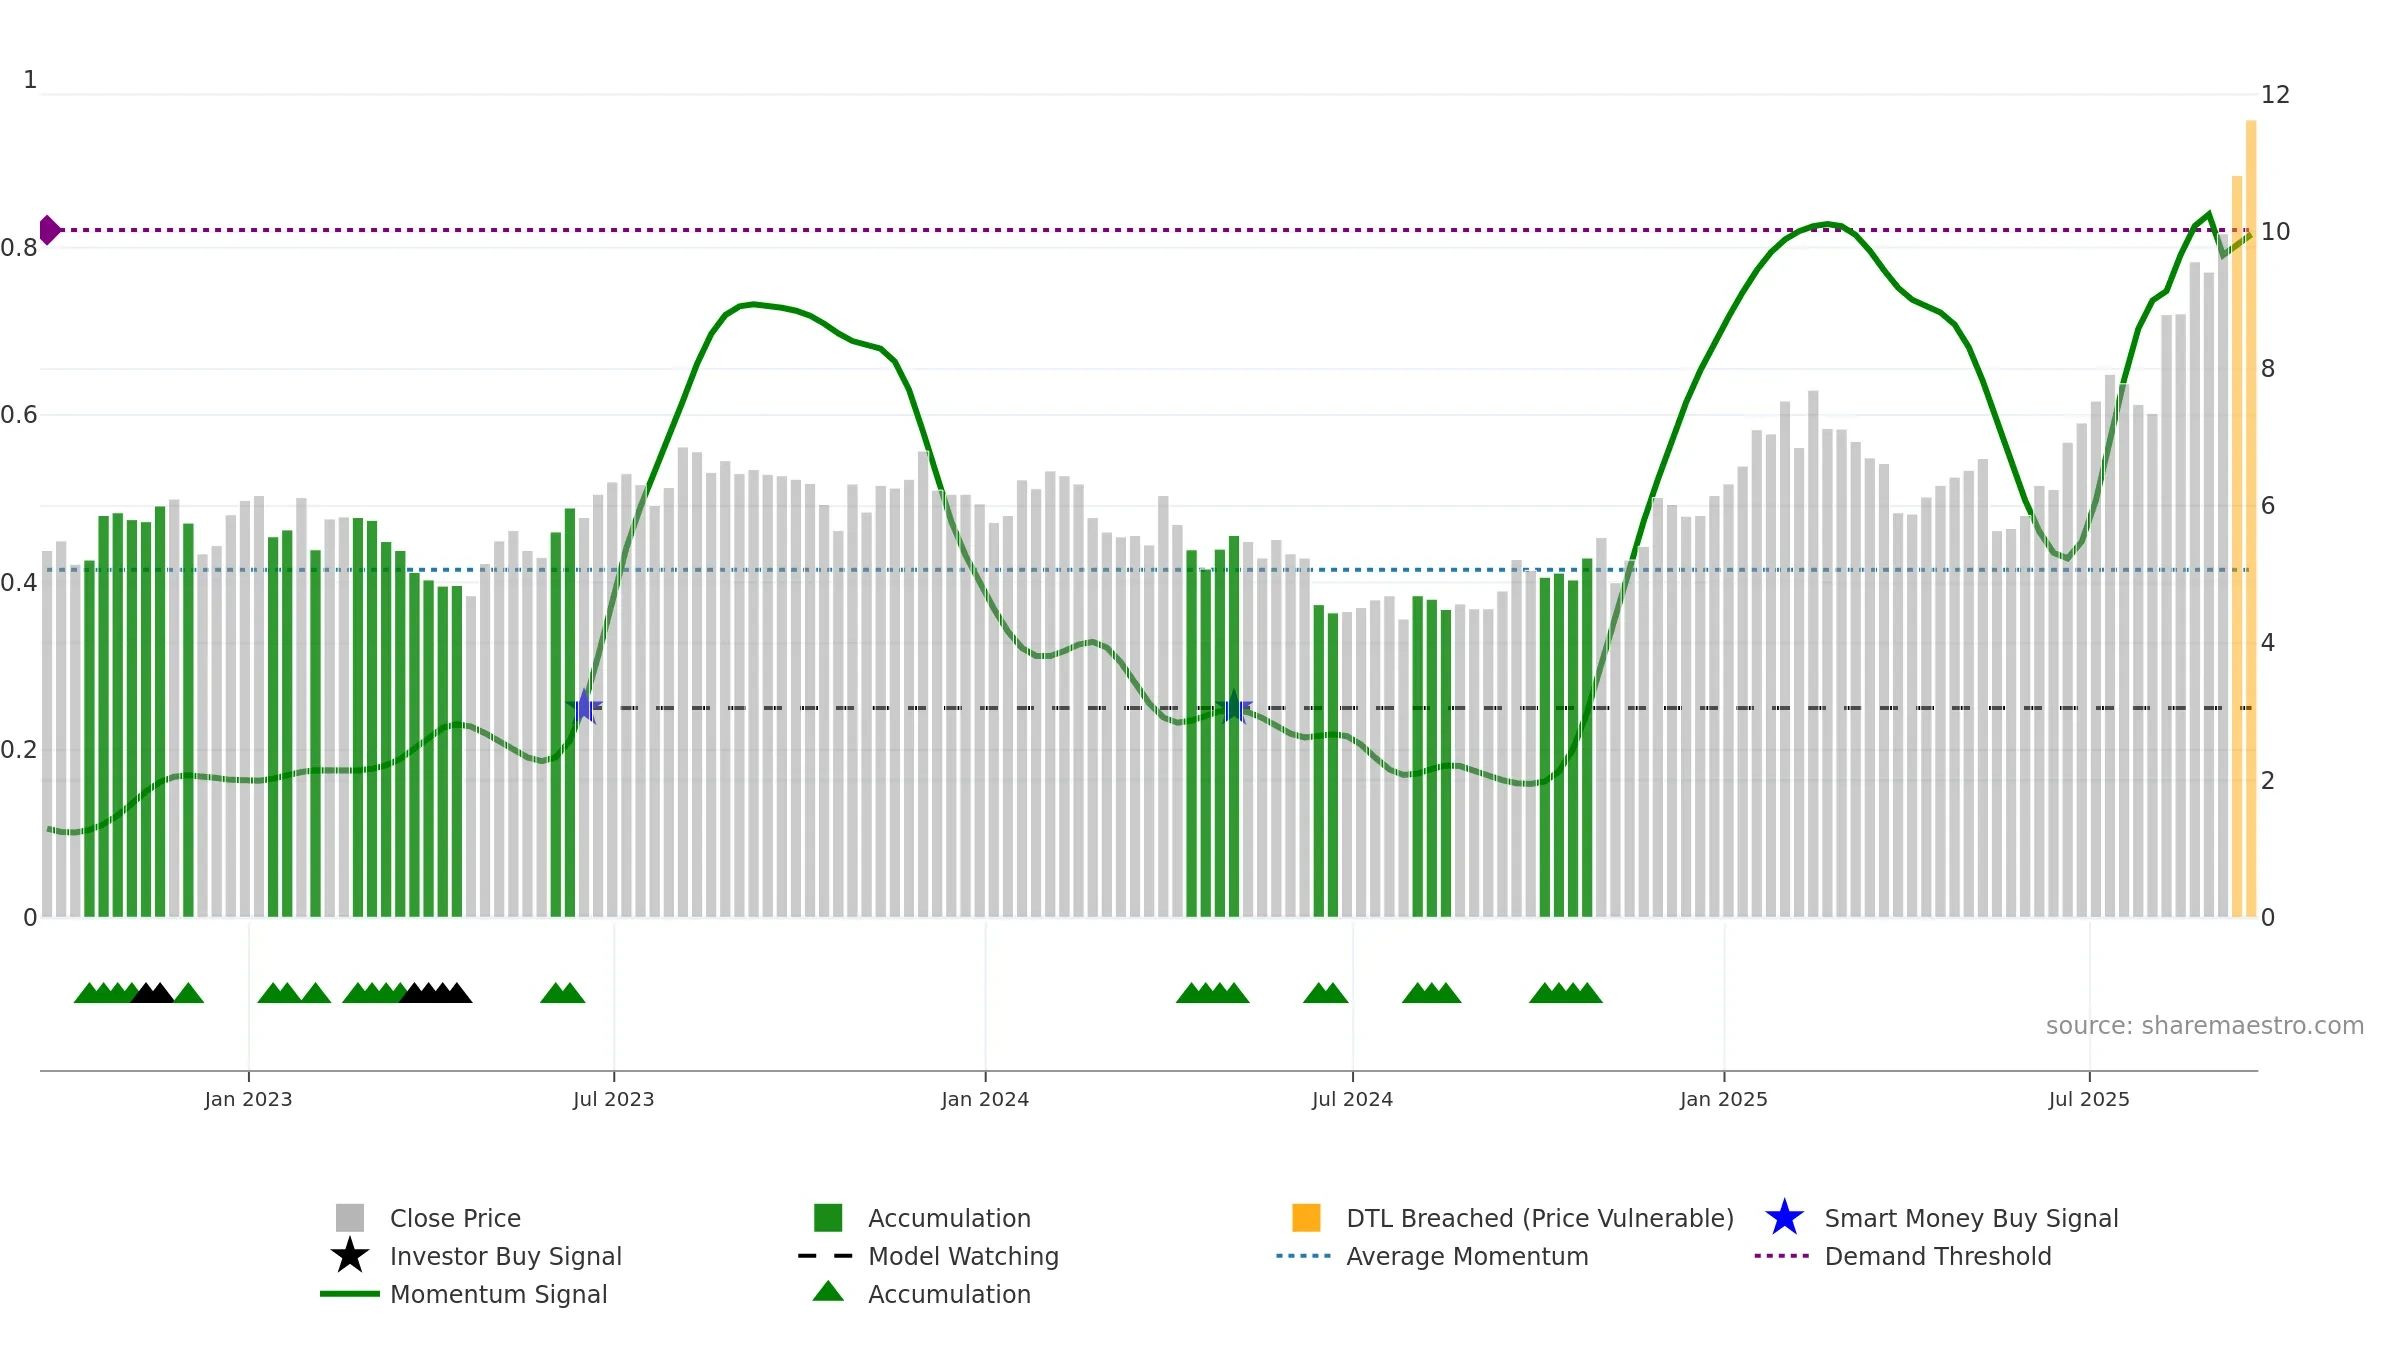
Weekly Report
Gilat Satellite Networks Ltd. closed at 11.6300 (1.66% WoW) . Data window ends Fri, 19 Sep 2025.
How to read this — Price slope is upward, indicating persistent buying over the window. Low weekly volatility favours steadier follow-through. Volume and price are moving in the same direction — a constructive confirmation. Constructive MA stack supports the up-drift; pullbacks may find support at the 8–13 week region. Price holds above key averages, indicating constructive participation.
Up-slope supports buying interest; pullbacks may be contained if activity stays firm.
Gauge maps the trend signal to a 0–100 scale.
How to read this — Gauge is elevated but momentum is rolling over; topping risk is rising. Notable breakdown from ≥0.80 weakens trend quality.
Stay alert: protect gains or seek confirmation before adding risk.
Price is above fair value; upside may be capped without catalysts.
Conclusion
Positive setup. ★★★★☆ confidence. Price window: 58. Trend: Uptrend at Risk; gauge 81. In combination, liquidity confirms the move.
- Momentum is bullish and rising
- Price holds above 8w & 26w averages
- Constructive moving-average stack
- Liquidity confirms the price trend
- High-level but rolling over (topping risk)
- Recent breakdown from ≥0.80 weakens trend quality
Why: Price window 58.23% over 8w. Close is 7.49% above the prior-window high. Return volatility 1.17%. Volume trend rising. Liquidity convergence with price. Trend state uptrend at risk. High-regime (0.80–1.00) downticks 1/3 (33.0%) • Accumulating. MA stack constructive. Momentum bullish and rising. Valuation limited upside without catalysts.
Tip: Most metrics include a hover tooltip where they appear in the report.