Shanghai Milkground Food Tech Co., Ltd
600882 SHA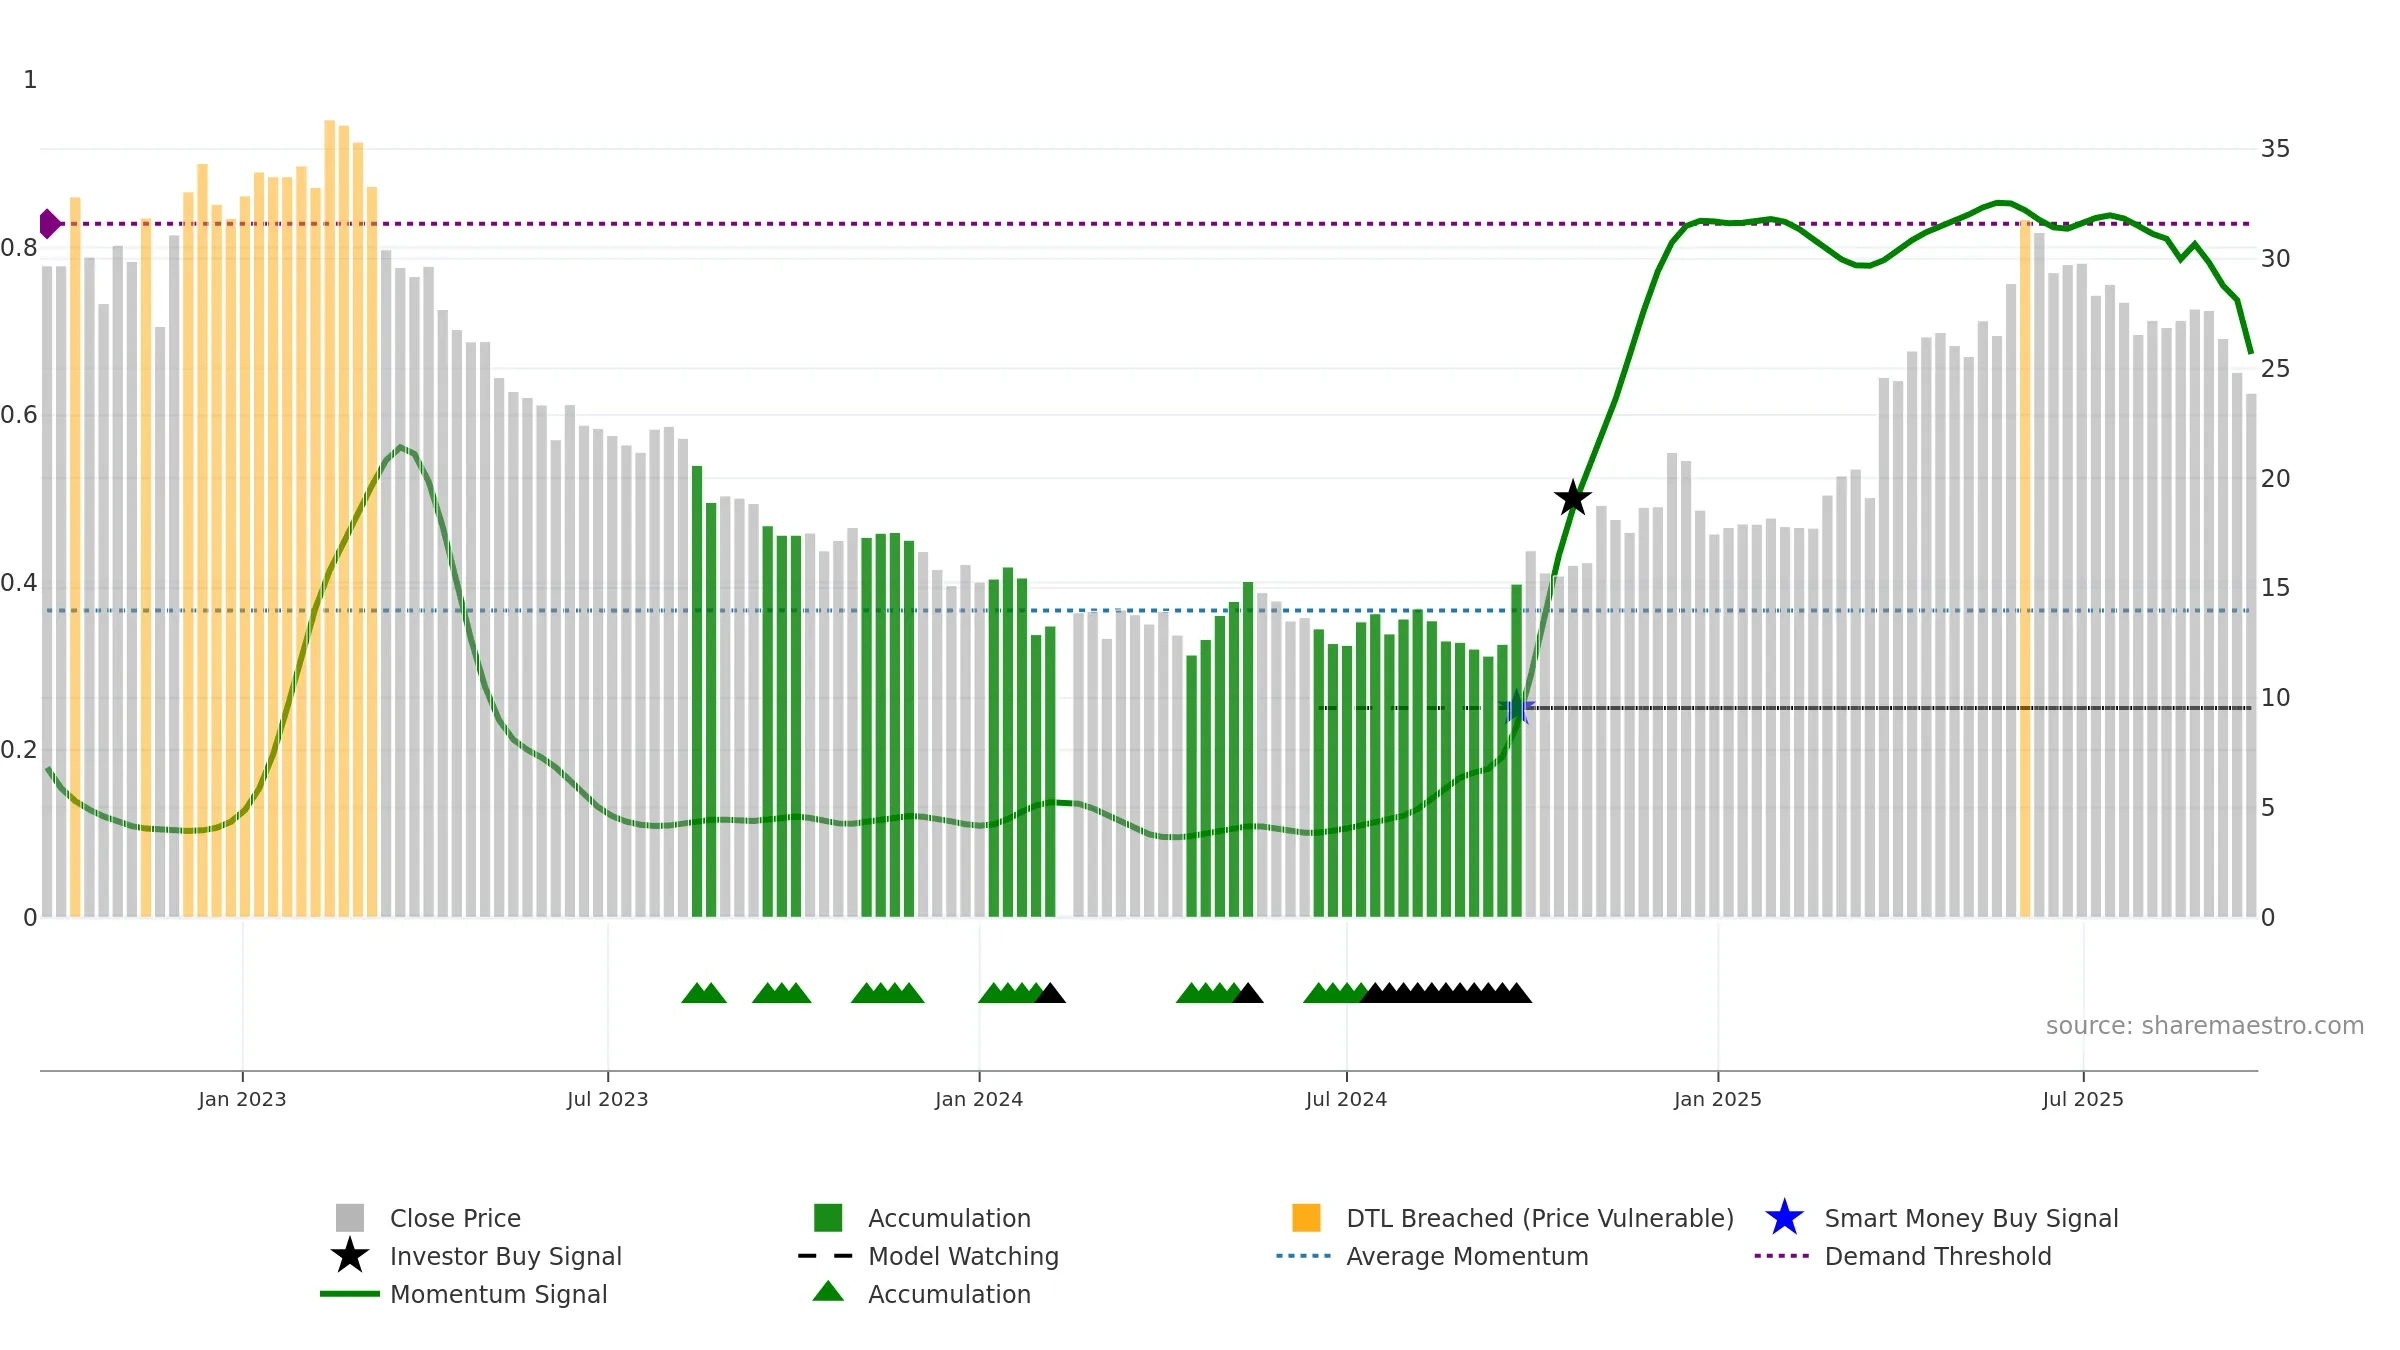
Weekly Summary
Shanghai Milkground Food Tech Co., Ltd closed at 23.8800 (-1.36% WoW) . Data window ends Mon, 22 Sep 2025.
How to read this — Price slope is downward, indicating persistent supply pressure. Low weekly volatility favours steadier follow-through. Volume and price are moving in the same direction — a constructive confirmation. Returns are positively correlated with volume — strength tends to arrive on higher activity. Weak MA stack argues for caution; rallies can fail near the 8–13 week region. Price sits below key averages, keeping pressure on the tape.
Down-slope argues for patience; rallies can fade sooner unless participation improves.
Gauge maps the trend signal to a 0–100 scale.
How to read this — Gauge is elevated but momentum is rolling over; topping risk is rising.
Stay alert: protect gains or seek confirmation before adding risk.

Relative strength is Negative
(< 0%, underperforming).
Latest MRS: -12.69% (week ending Fri, 19 Sep 2025).
Slope: Falling over 8w.
Notes:
- Below zero line indicates relative weakness vs benchmark.
- MRS slope falling over ~8 weeks.
Price is above fair value; upside may be capped without catalysts.
Conclusion
Negative setup. ★★☆☆☆ confidence. Price window: -12. Trend: Uptrend at Risk; gauge 67. In combination, liquidity confirms the move.
- Liquidity confirms the price trend
- Low return volatility supports durability
- High-level but rolling over (topping risk)
- Momentum is weak/falling
- Price is not above key averages
- Weak moving-average stack
Why: Price window -12.21% over 8w. Close is -13.82% below the prior-window high. Return volatility 1.65%. Volume trend falling. Liquidity convergence with price. Trend state uptrend at risk. High-regime (0.80–1.00) downticks 3/3 (100.0%) • Distributing. MA stack weak. Momentum neutral and falling. Valuation limited upside without catalysts.
Tip: Most metrics include a hover tooltip where they appear in the report.